

Salivary Proteomics Identifies Transthyretin as a Biomarker of Early Dementia Conversion
- PMID: 35360272
- PMCID: PMC8925122
- DOI: 10.3233/ADR-210056
Salivary Proteomics Identifies Transthyretin as a Biomarker of Early Dementia Conversion
Abstract
Background: Alzheimer's disease (AD) remains to date an incurable disease with a long asymptomatic phase. Early diagnosis in peripheral biofluids has emerged as key for identifying subjects at risk and developing therapeutics and preventative approaches.
Objective: We apply proteomics discovery to identify salivary diagnostic biomarkers for AD, which are suitable for self-sampling and longitudinal biomonitoring during aging.
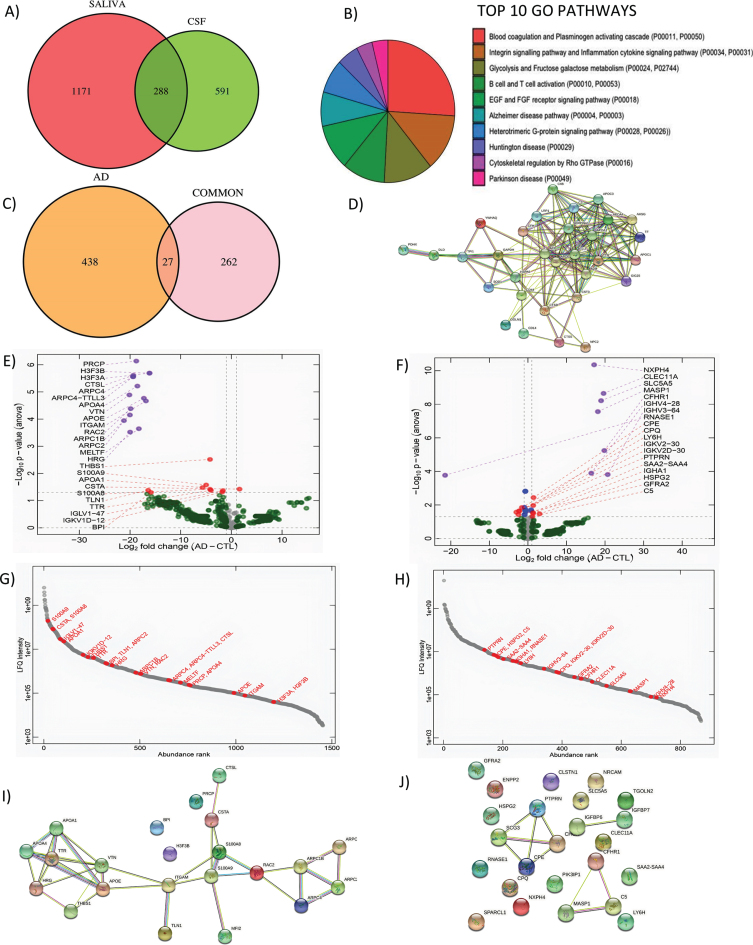
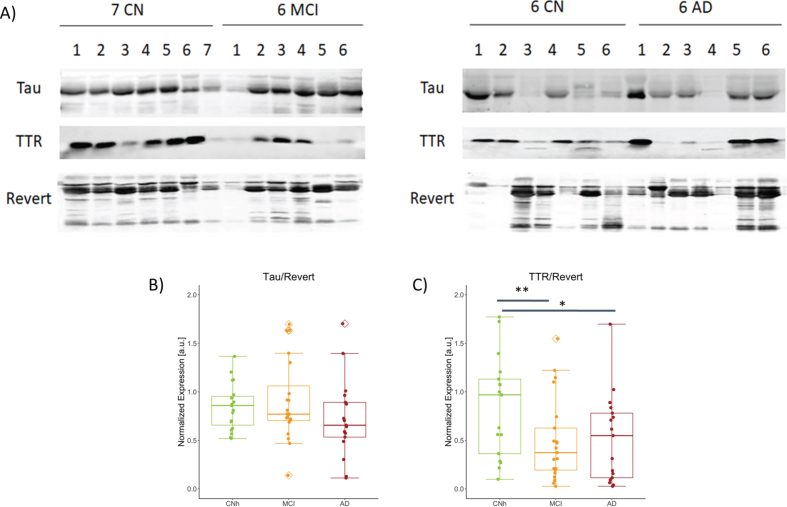
Methods: 57 participants were recruited for the study and were categorized into Cognitively normal (CNh) (n = 19), mild cognitive impaired (MCI) (n = 21), and Alzheimer's disease (AD) (n = 17). On a subset of subjects, 3 CNh and 3 mild AD, shot-gun filter aided sample preparation (FASP) proteomics and liquid chromatography mass spectroscopy (LC-MS/MS) was employed in saliva and cerebrospinal fluid (CSF) to identify neural-derived proteins. The protein level of salivary Transthyretin (TTR) was validated using western blot analysis across groups.
Results: We found that 19.8% of the proteins in saliva are shared with CSF. When we compared the saliva and CSF proteome, 24 hits were decreased with only one protein expressed more. Among the differentially expressed proteins, TTR with reported function in amyloid misfolding, shows a significant drop in AD samples, confirmed by western blot showing a 0.5-fold reduction in MCI and AD compared to CNh.
Conclusion: A reduction in salivary TTR appears with the onset of cognitive symptoms. More in general, the proteomic profiling of saliva shows a plethora of biomarkers worth pursuing as non-invasive hallmarks of dementia in the preclinical stage.
Keywords: Alzheimer’s disease; LC-MS/MS; amyloid-β; cerebrospinal fluid; saliva; tau; transthyretin.
© 2022 – The authors. Published by IOS Press.
Conflict of interest statement
The authors have no conflict of interest to report.
Figures
References
-
- Guerchet M, Prince M, Prina M (2020) Numbers of people with dementia worldwide: An update to the estimates in the World Alzheimer Report 2015. Alzheimer’s Disease International, London.
-
- Olsson B, Lautner R, Andreasson U, Öhrfelt A, Portelius E, Bjerke M, Hölttä M, Rosén C, Olsson C, Strobel G, Wu E, Dakin K, Petzold M, Blennow K, Zetterberg H (2016) CSF and blood biomarkers for the diagnosis of Alzheimer’s disease: A systematic review and meta-analysis. Lancet Neurol 15, 673–684. - PubMed
LinkOut - more resources
Full Text Sources
Research Materials
Miscellaneous
