. 2022 Mar 19;1(1):pgab003.
doi: 10.1093/pnasnexus/pgab003. eCollection 2022 Mar.

LONGL-Net: temporal correlation structure guided deep learning model to predict longitudinal age-related macular degeneration severity

Affiliations

LONGL-Net: temporal correlation structure guided deep learning model to predict longitudinal age-related macular degeneration severity

Alireza Ganjdanesh et al. PNAS Nexus. .

Abstract

Age-related macular degeneration (AMD) is the principal cause of blindness in developed countries, and its prevalence will increase to 288 million people in 2040. Therefore, automated grading and prediction methods can be highly beneficial for recognizing susceptible subjects to late-AMD and enabling clinicians to start preventive actions for them. Clinically, AMD severity is quantified by Color Fundus Photographs (CFP) of the retina, and many machine-learning-based methods are proposed for grading AMD severity. However, few models were developed to predict the longitudinal progression status, i.e. predicting future late-AMD risk based on the current CFP, which is more clinically interesting. In this paper, we propose a new deep-learning-based classification model (LONGL-Net) that can simultaneously grade the current CFP and predict the longitudinal outcome, i.e. whether the subject will be in late-AMD in the future time-point. We design a new temporal-correlation-structure-guided Generative Adversarial Network model that learns the interrelations of temporal changes in CFPs in consecutive time-points and provides interpretability for the classifier's decisions by forecasting AMD symptoms in the future CFPs. We used about 30,000 CFP images from 4,628 participants in the Age-Related Eye Disease Study. Our classifier showed average 0.905 (95% CI: 0.886-0.922) AUC and 0.762 (95% CI: 0.733-0.792) accuracy on the 3-class classification problem of simultaneously grading current time-point's AMD condition and predicting late AMD progression of subjects in the future time-point. We further validated our model on the UK Biobank dataset, where our model showed average 0.905 accuracy and 0.797 sensitivity in grading 300 CFP images.

Keywords: Generative Adversarial Networks; age-related macular degeneration; deep learning; longitudinal outcome prediction.


Figures

Fig. 1.
Fig. 1.
Training procedure and architectures of the classifier and the temporal correlation structure guided GAN model. Given a training input pair, the generator model (U-Net architecture in the middle with shape “formula image”) predicts the fundus image of the second (future) time-point based on the first (current) time-point's image. The L1-norm of the difference of the predicted image and the second time-point (the difference image is magnified for better visualization) in the pair will form the reconstruction loss formula image. In addition, the first time-point's image and the predicted image get concatenated and passed to the discriminator that evaluates whether the generated image has reasonable structural properties, considering the first time-point's fundus image. Patch-wise discrimination is depicted where the scores on several distinct patches contribute to the final GAN model's loss function. Finally, the classifier is trained by the weighted cross-entropy loss function formula image using the pair's first time-point's image and its 3-class encoded label.
Fig. 2.
Fig. 2.
The procedure of predicting the second time-point's AMD condition using the GAN model and the classifier sequentially. The GAN model predicts the second time-point's image, and the classifier predicts a label formula image which will be decoded as Not Adv AMD or Adv AMD in the second time-point.
Fig. 3.
Fig. 3.
The procedure of predicting the second time-point's AMD condition using the GAN model and a binary classifier. The GAN model's prediction is used by the binary classifier to predict second time-point's label.
Fig. 4.
Fig. 4.
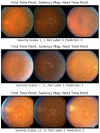
Each row from left to right: first time-point's image, saliency map of it, and second time-point's image. All images are chosen from the test set. The first time-points’ images’ names are “52,340_04_F2_LE_LS,” “52,759_06_F2_RE_LS,” and “3923_08_LE_F2_LS,” respectively. As can be seen in the saliency maps, the classifier has focused on the macula region and its properties such as drusen size and pigmentary abnormalities, which is aligned with the clinical process of AMD diagnosis.
Fig. 5.
Fig. 5.
Longitudinal prediction for the left eye of a subject who has progressed to advanced AMD. Top row from left to right: baseline, prediction at 4th, 6th, and 8th time-points (2, 3, and 4 years, respectively) after baseline. Bottom row from left to right: baseline, ground truth (GT) images for the 4th, 6th, and 8th time-points after baseline. The images in each column are the prediction and their corresponding ground truth. The AMD severity scale of each ground truth image is shown in the bottom line. The name of the baseline image in the AREDS dataset is “51,662_QUA_F2_LE_LS.jpg.”
Fig. 6.
Fig. 6.
Longitudinal prediction for the right eye of a subject who has progressed to advanced AMD. Top row from left to right: baseline, prediction at 4th, 6th, and 8th time-points after baseline. Bottom row from left to right: baseline, ground truth (GT) images for the 4th, 6th, and 8th time-points after baseline. The images in each column are the prediction and their corresponding ground truth. The AMD severity scale of each ground truth image is shown in the bottom line. The name of the baseline image in the AREDS dataset is “51,662_QUA_F2_RE_LS.jpg.”

Similar articles

Cited by

References

    1. Bird AC, et al. . 1995. An international classification and grading system for age-related maculopathy and age-related macular degeneration. Surv Ophthalmol. 39(5):367–374. - PubMed
    1. Trucco E, MacGillivray T, Xu Y. 2019. Computational retinal image analysis: tools, applications and perspectives. Cambridge, MA: Academic Press.
    1. Congdon N, et al. 2004. Causes and prevalence of visual impairment among adults in the United States. Arch Ophthalmol. 122(4):477–485. - PubMed
    1. Quartilho A, et al. . 2016. Leading causes of certifiable visual loss in England and Wales during the year ending 31 March 2013. Eye. 30(4):602–607. - PMC - PubMed
    1. Fritsche LG, et al. . 2014. Age-related macular degeneration: genetics and biology coming together. Annu Rev Genomics Hum Genet. 15:151–171. - PMC - PubMed