. 2022 Feb 28;2(2):100172.
doi: 10.1016/j.crmeth.2022.100172. Epub 2022 Feb 17.

High-throughput identification of autoantibodies that target the human exoproteome

Affiliations

High-throughput identification of autoantibodies that target the human exoproteome

Eric Y Wang et al. Cell Rep Methods. .

Abstract

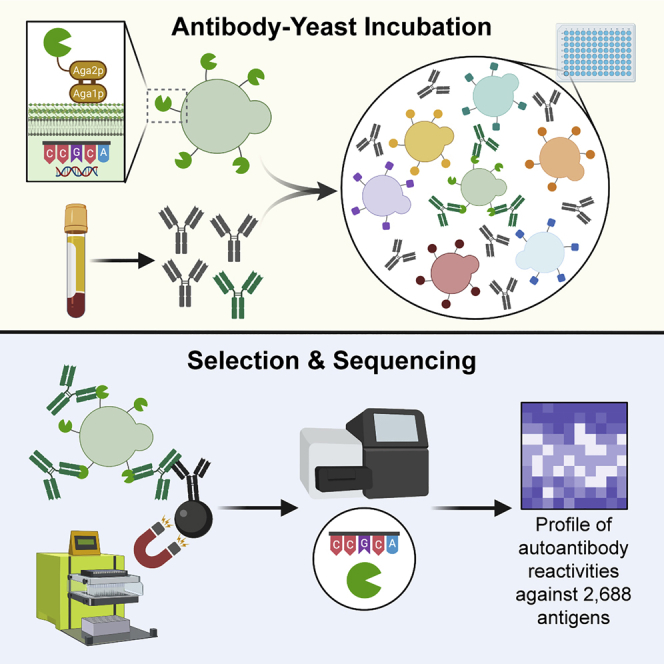
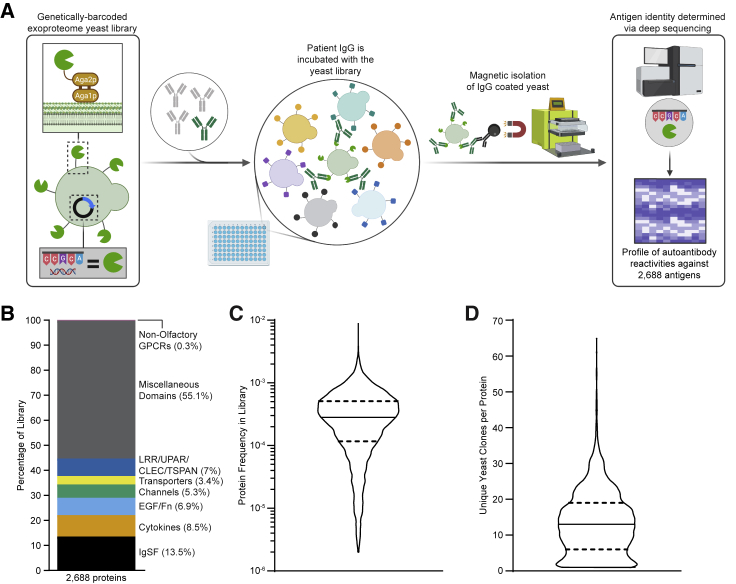
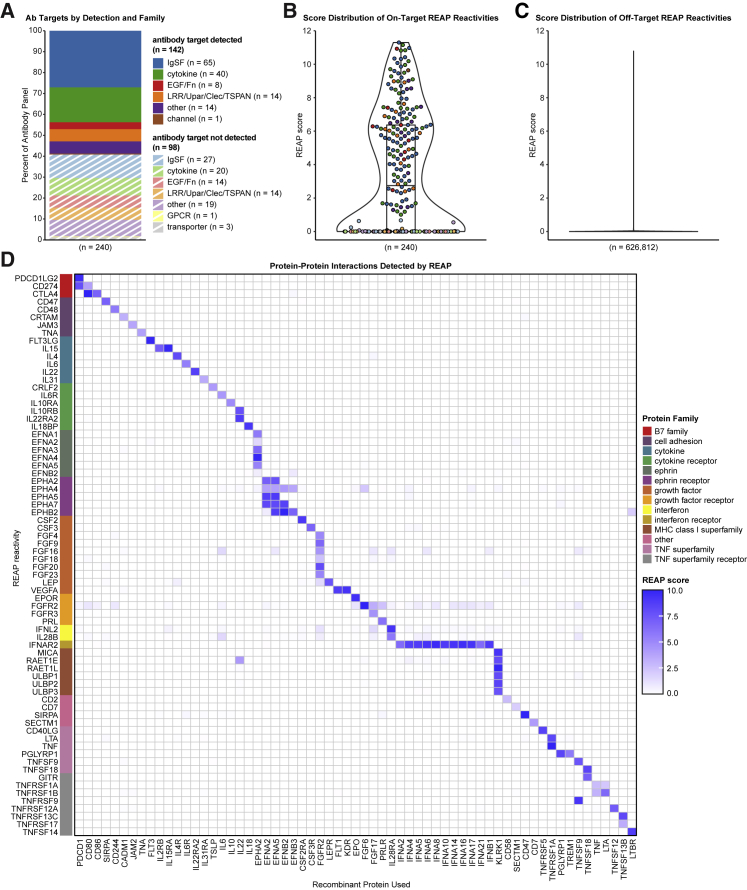
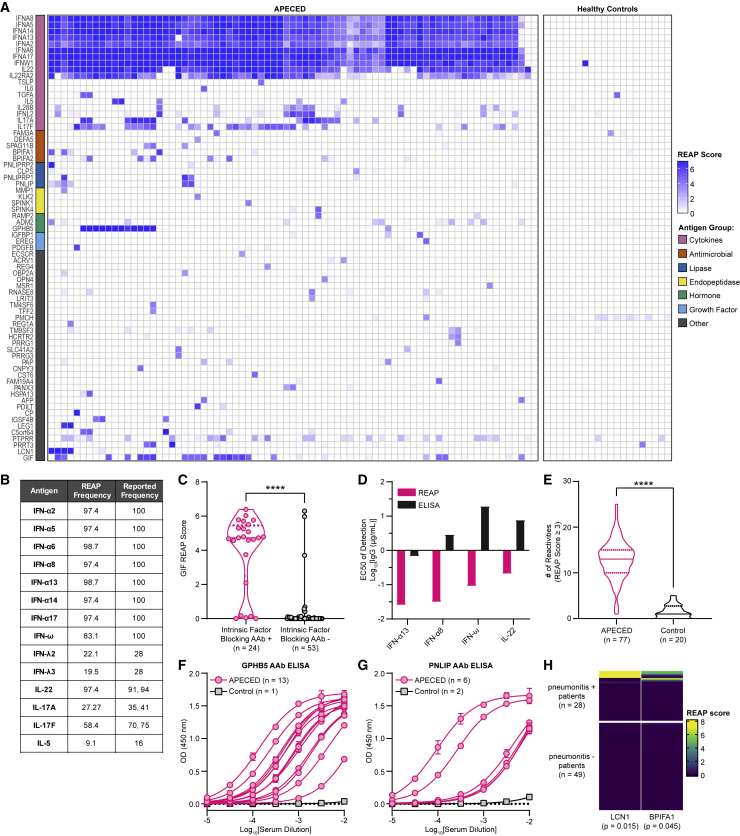
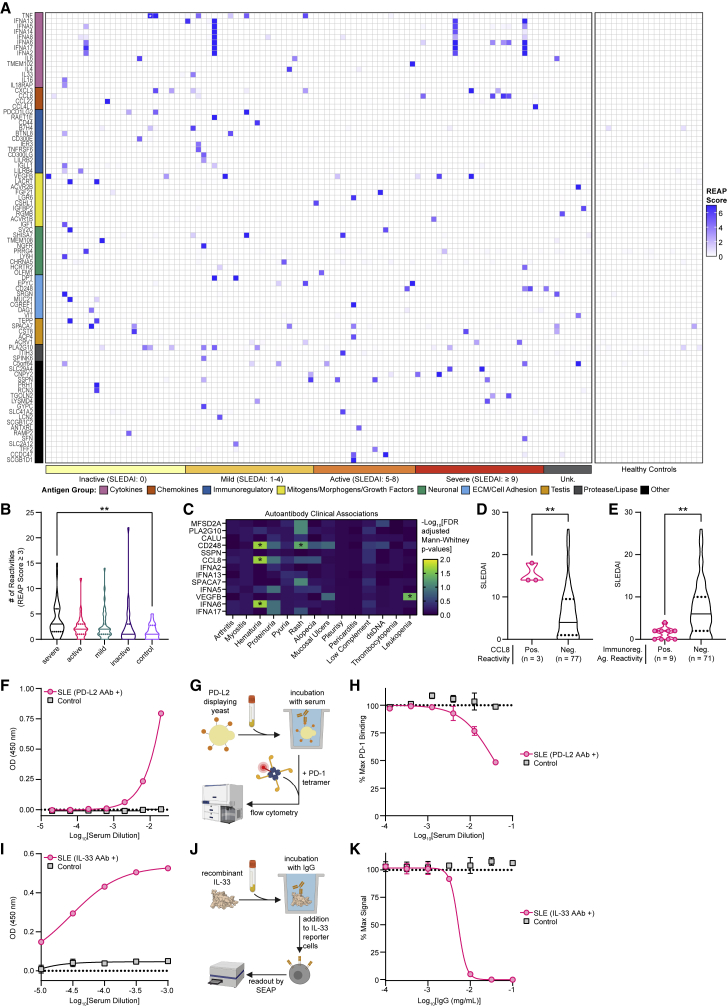
Autoantibodies that recognize extracellular proteins (the exoproteome) exert potent biological effects but are challenging to detect. Here, we developed rapid extracellular antigen profiling (REAP), a high-throughput technique for the comprehensive discovery of exoproteome-targeting autoantibodies. Patient samples are applied to a genetically barcoded yeast surface display library containing 2,688 human extracellular proteins. Antibody-coated yeast are isolated, and sequencing of barcodes is used to identify displayed antigens. To benchmark REAP's performance, we screened 77 patients with autoimmune polyglandular syndrome type 1 (APS-1). REAP sensitively and specifically detected both known and previously unidentified autoantibodies in APS-1. We further screened 106 patients with systemic lupus erythematosus (SLE) and identified numerous autoantibodies, several of which were associated with disease severity or specific clinical manifestations and exerted functional effects on cell signaling ex vivo. These findings demonstrate the utility of REAP to atlas the expansive landscape of exoproteome-targeting autoantibodies and their impacts on patient health outcomes.


Conflict of interest statement

DECLARATION OF INTERESTS E.Y.W., Y.D., C.E.R., and A.M.R. are inventors of a patent describing the REAP technology. A.M.R. is the founder of Seranova Bio; and A.M.R., E.Y.W., Y.D., and C.E.R. hold equity in Seranova Bio.

Figures

None
Graphical abstract
Figure 1
Figure 1
Yeast library and REAP development (A) Simplified schematic of REAP. Antibodies are incubated with a genetically barcoded yeast library displaying members of the exoproteome in 96-well microtiter plates. Antibody-bound yeast are enriched by magnetic column-based sorting and enrichment is quantified by next-generation sequencing. (B) Composition of proteins in the yeast library, categorized by broad protein families. Abbreviations are as follows: immunoglobulin superfamily (IgSF), epidermal growth factor (EGF), fibronectin (Fn), leucine-rich repeat (LRR), urokinase receptor (UPAR), C-type lectin (CLEC), and tetraspanin (TSPAN). The cytokine family consists of proteins belonging to tumor necrosis factor, interferon, interleukin, and growth factor protein families. (C and D) Distribution of total protein frequencies (C) and unique yeast clones per protein (D) in the yeast library. Solid lines indicate the median of the distribution and dotted lines indicate first and third quartiles
Figure 2
Figure 2
Validation of REAP A panel of 236 antibodies with 240 known antigen targets were screened using REAP. (A) Percentages of known antibody targets successfully and unsuccessfully detected by REAP, categorized by broad protein families, as in Figure 1B. (B) Violin plot of REAP scores of known antibody targets from the antibody panel screen. Each point represents an antigen target and points are colored by antigen protein family, as in (A). Boxplot lines indicate the first, median, and third quartiles. (C) Violin plot of REAP scores from the antibody panel screen for all proteins that were not known antibody targets. (D) REAP screen performed using recombinant protein in place of IgG. Proteins on the y axis are categorized by protein family
Figure 3
Figure 3
REAP screen of APS-1 patients A cohort of 77 APS-1 patients and 20 healthy controls were screened using REAP. (A) Heatmap of REAP scores. Antigen groups were manually categorized. (B) Frequencies of positive reactivities (score ≥ healthy donor average score plus 3 SDs) against 14 antigens based on REAP and prior literature (Kisand et al., 2010; Meager et al., 2006; Meyer et al., 2016). (C) Violin plot of GIF REAP scores in APS-1 samples stratified by clinical intrinsic factor blocking autoantibody test results. (D) EC50s of fitted REAP and ELISA dose-response curves for detection of autoantibodies against four proteins in one APS-1 patient. See Figures S1E and S1F for dose-response curves. (E) Violin plot of the number of reactivities in APS-1 and control samples at a score cutoff of 3. (F and G) (F) Anti-GPHB5 and (G) anti-PNLIP pan-IgG ELISAs conducted with serial dilutions of serum. Error bars represent SD. (H) Heatmap of LCN1 and BPIFA1 REAP scores in APS-1 samples stratified by pneumonitis positivity. Listed p values represent significance for the association between LCN1 or BPIFA1 REAP positivity and pneumonitis. Significance in (C) and (E) was determined using a two-sided Mann-Whitney U test. Significance in (H) was determined using a Fisher’s exact test, where LCN1 and BPIFA1 positivity was defined as a REAP score ≥3. In all heatmaps in this figure, score was artificially capped at 7 to aid visualization. In all violin plots in this figure, solid lines represent the median and dotted lines represent the first or third quartile. ∗∗∗∗p ≤ 0.0001
Figure 4
Figure 4
REAP screen of SLE patients A cohort of 106 unique SLE patients spanning 155 samples and 20 healthy controls was screened using REAP. (A) Heatmap of REAP scores where each column is a unique patient. For patients with longitudinal samples, the maximum REAP score for each given reactivity is shown. Antigen groups were manually categorized. Patients are ordered from left to right by increasing SLEDAI score. White stars symbolize detection of a therapeutic antibody. Score was artificially capped at 7 to aid visualization. (B) Violin plots of the number of reactivities in control samples (n = 20) and SLE samples stratified by severe (n = 45), active (n = 33), mild (n = 43), and inactive (n = 34) disease at a score cutoff of 3. Significance was determined using a Kruskal-Wallis test followed by a Dunnett’s test. (C) Heatmap of false discovery rate-adjusted p values from two-sided Mann-Whitney U tests comparing REAP score distributions for specific proteins between patients stratified by clinical manifestations. Only reactivities positive (score ≥ 3) in at least 3 patients were tested. (D) SLEDAI scores for SLE patients stratified by REAP reactivity against CCL8. (E) SLEDAI scores for SLE patients stratified by REAP reactivity against immunoregulatory antigens (defined in [A]). (F) Anti-PD-L2 and (I) anti-IL-33 pan-IgG ELISAs conducted with serial dilutions of SLE or control serum. (G and G) (G) Schematic and (H) results of PD-L2 blocking assay conducted with serial dilutions of serum from a healthy control and the SLE patient in (F). (J and K) (J) Schematic and (K) results of IL-33 neutralization assay conducted with serial dilutions of IgG from a healthy control and the SLE patient in (I). Significance in (D) and (E) was determined using a two-sided Mann-Whitney U test. All error bars in this figure represent SD. For all analyses in this figure; positive reactivities were defined as those with REAP score ≥3. ∗p ≤ 0.05, ∗∗p ≤ 0.01

References

    1. Benjamin Larman H., Salajegheh M., Nazareno R., Lam T., Sauld J., Steen H., Won Kong S., Pinkus J.L., Amato A.A., Elledge S.J., et al. Cytosolic 5′-nucleotidase 1A autoimmunity in sporadic inclusion body myositis: cN1A Autoimmunity in IBM. Ann. Neurol. 2013;73:408–418. - PubMed
    1. Birnbaum M.E., Mendoza J.L., Sethi D.K., Dong S., Glanville J., Dobbins J., Ozkan E., Davis M.M., Wucherpfennig K.W., Garcia K.C. Deconstructing the peptide-MHC specificity of T cell recognition. Cell. 2014;157:1073–1087. - PMC - PubMed
    1. Boder E.T., Wittrup K.D. Yeast surface display for screening combinatorial polypeptide libraries. Nat. Biotechnol. 1997;15:553–557. - PubMed
    1. Boder E.T., Bill J.R., Nields A.W., Marrack P.C., Kappler J.W. Yeast surface display of a noncovalent MHC class II heterodimer complexed with antigenic peptide. Biotechnol. Bioeng. 2005;92:485–491. - PubMed
    1. Bombardier C., Gladman D.D., Urowitz M.B., Caron D., Chang C.H., Committee on Prognosis Studies in SLE Derivation of the SLEDAI. A disease activity index for lupus patients. Arthritis Rheumatol. 1992;35(6):630–640. - PubMed

Publication types