. 2022 Mar 14:9:739620.
doi: 10.3389/fmed.2022.739620. eCollection 2022.

Combined Estrogen Alpha and Beta Receptor Expression Has a Prognostic Significance for Colorectal Cancer Patients

Affiliations

Combined Estrogen Alpha and Beta Receptor Expression Has a Prognostic Significance for Colorectal Cancer Patients

Geriolda Topi et al. Front Med (Lausanne). .

Abstract

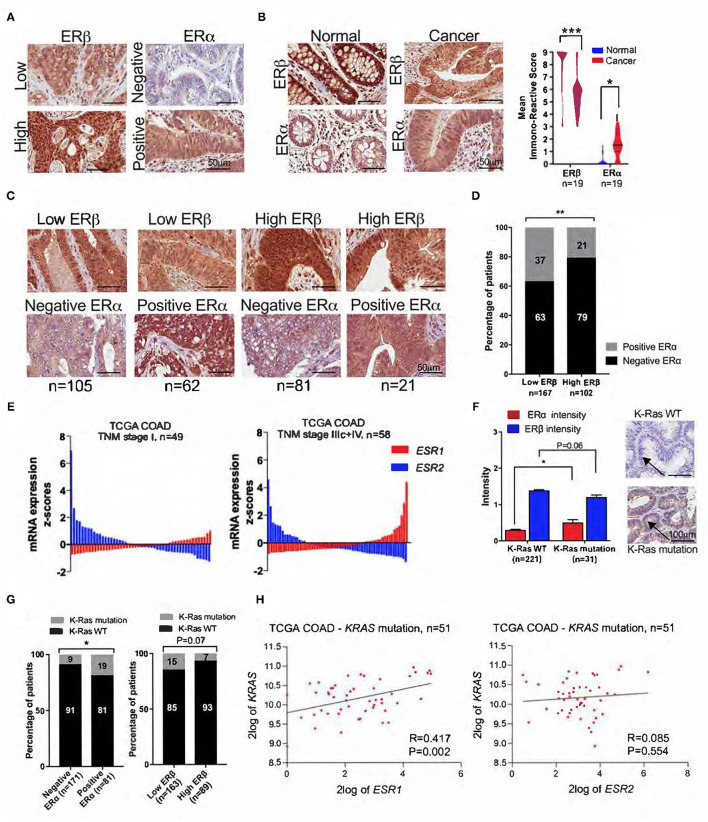
We reported that high estrogen receptor beta (ERβ) expression is independently associated with better prognosis in female colorectal cancer (CRC) patients. However, estrogen receptor alpha (ERα) is expressed at very low levels in normal colon mucosa, and its prognostic role in CRC has not been explored. Herein, we investigated the combined role of ERα and ERβ expression in the prognosis of female patients with CRC, which, to the best of our knowledge, is the first study to investigate this topic. A total number of 306 primary CRCs were immunostained for ERα and ERβ expression. A Cox regression model was used to evaluate overall survival (OS) and disease-free survival (DFS). The combined expression of high ERβ + negative ERα correlates with longer OS (HR = 0.23; 95% CI: 0.11-0.45, P <0.0001) and DFS (HR = 0.10; 95% CI: 0.03-0.26, P < 0.0001) and a more favorable tumor outcome, as well as significantly higher expression of antitumorigenic proteins than combined expression of low ERβ + positive ERα. Importantly, we found that low ERβ expression was associated with local recurrence of CRC, whereas ERα expression was correlated with liver metastasis. Overall, our results show that the combined high ERβ + negative ERα expression correlated with a better prognosis for CRC patients. Our results suggest that the combined expression of ERα and ERβ could be used as a predictive combination marker for CRC patients, especially for predicting DFS.

Keywords: CRC disease-free survival; CRC overall survival; colorectal cancer; estrogen receptor alpha; estrogen receptor beta.


Conflict of interest statement

The authors declare that the research was conducted in the absence of any commercial or financial relationships that could be construed as a potential conflict of interest.

Figures

Figure 1
Figure 1
Consort diagram of colorectal cancer patients involved in the study.
Figure 2
Figure 2
Expression levels of ERα and ERβ in CRC tissue. (A) Representative IHC images showing the nuclear expression of ERα and ERβ in CRC tissue. (B) Representative IHC images of ERα and ERβ expression in normal and matched cancer tissues, and violin plots showing the distribution of IRSs for ERα and ERβ expression in normal and matched cancer tissues. (C) IHC images of CRC tissue in four subgroups of patients with combined ERα and ERβ expression levels. (D) The percentage of CRC patients with negative and positive ERα expression according to low and high ERβ expression. (E) Waterfall plots of the mRNA expression levels of ESR1 (ERα) and ESR2 (ERβ) in the subgroups of CRC patients with TNM stage I (n = 49) and TNM stage IIIc + IV (n = 58) from the TCGA-COAD public database. (F) Intensity of ERα and ERβ expression in patients with wild-type (WT) and KRAS mutations, together with representative IHC images for KRAS status. The arrows indicate negative and positive staining. (G) The percentage of CRC patients with KRAS mutations and KRAS WT according to ERα and ERβ expression. (H) XY scatter plot of the mRNA levels of ESR1 (ERα), ESR2 (ERβ), and KRAS mutations from the TCGA-COAD database with 62 CRC patients. The data are presented as the mean ± SEM (C,F) or as the percentage (E,G). The scale bar is 50 μm (A–C) and 100 μm (F). *P <0.05, **P <0.01, ***P <0.001, paired t-test (B), Mann-Whitney test (F) and χ2 test (D,G).
Figure 3
Figure 3
Prognostic assessment with sensitivity and specificity estimation for only ERα, ERβ and combined ERα – ERβ protein expression without clinical factors in female CRC and TCGA-COAD cohorts. Kaplan-Meier survival curves for: (A) ERα expression in female CRC cohort, (B) ERα and (C) ERβ expressions in TCGA-COAD cohort with cancer stage I-III. ROC curve, sensitivity and specificity analysis for the univariate model for (D) ERα, (E) ERβ and (F) combined ERα – ERβ protein expressions in female CRC cohort for 5-years OS. (G) Water fall plot for estimated risk score profile for combined ERα - ERβ protein expressions in four patients'groups in female CRC cohort with stage and event information (cutoff based on Youden's index association criteria with OS). P-values according to the log-rank test.
Figure 4
Figure 4
Association of concomitant ERβ and ERα expression with CRC patient survival. Kaplan-Meier survival curves for OS: (A) univariate model, n = 269; (B) multivariate model adjusted for age, TNM stage and tumor vascular invasion, n = 214; (C) multivariate model for patients with stage I-III cancer, n = 180. Kaplan-Meier survival curves for DFS: (D) univariate model, n = 232; (E) multivariate model adjusted for age, TNM stage and tumor vascular invasion, n = 183; (F) multivariate model for patients who did not receive adjuvant treatment after surgery, n =128. (G–I) ROC curves comparing the basic model (adjusted for age, TNM stage and tumor vascular invasion), the extended model including only ERβ expression, the extended model including only ERα expression, and the extended model with combined ERβ and ERα expression for OS (G) and DFS (H). (I) ROC curves from the TCGA-COAD database for stage I-III colon cancer, comparing the basic model (adjusted for age, TNM stage and tumor vascular invasion), the extended model including only ERβ expression, the extended model including only ERα expression, and the extended model with combined ERβ + ERα expression for DFS. (G'–I') ROC curves comparing the basic model with the model including the combined ERβ and ERα protein expression for OS (G'), DFS (H') and DFS from the TCGA-COAD database (I'). The tables show the values of the area under the curve (AUC) for each of the corresponding models. P-values according to the log-rank test.
Figure 5
Figure 5
Correlation of hormonal status with subgroups of female CRC patients with both ERβ and ERα expression. Hormonal characteristics for (A) number of full-term pregnancies, where 0 refers to women who never had children; (B) total breastfeeding time for all the children a woman had, where 0 refers to women who never breastfed; (C) age at menopause; and (D) age at menarche. Percentage of female CRC patients with combined high ERβ + negative ERα expression or combined low ERβ + positive ERα expression who never or ever used (E) hormonal contraception (HC); (F) combined (estrogen and progesterone) HC; (G) progesterone HC; (H) hormonal replacement therapy (HRT); (I) combined (estrogen and progesterone) HRT; or (J) estrogen HRT. The data are presented as the mean ± SEM (A–D). *P <0.05, unpaired t-test; χ2 test or Fisher's exact test as indicated.
Figure 6
Figure 6
Correlation of subgroups of patients with ERβ and ERα expression with proteins important for CRC progression and development. (A) Mean IRS for CysLT1R, COX-2, membrane and nuclear β-catenin, CysLT2R, 15-PGDH, Mucin-2, and PGD2 synthase expression levels evaluated with IHC in subgroups of CRC patients with combined high ERβ + negative ERα expression (n = 81) or combined low ERβ + positive ERα expression (n = 62). (B) Expression of the indicated proteins (CysLT1R, COX-2, β-catenin, CysLT2R, 15-PGDH, Mucin-2 and PGD2 synthase) in the TCGA-COAD patients with combined high ERβ + low ERα expression (n = 60) or combined low ERβ + high ERα expression (n = 60) together with the corresponding heat maps. The data are presented as the mean ± SEM. *P < 0.05, **P < 0.01, ***P < 0.001, ****P < 0.0001, Mann-Whitney test.
Figure 7
Figure 7
Correlation of ERβ and ERα expression with CRC metastasis. (A) Binary logistic regression model showing the odds ratios (ORs) and 95% confidence intervals (CIs) for total metastatic events; liver metastasis; lung metastasis; other metastases; ocal recurrences; abdominal metastasis and bone metastasis. (B) Forest plots showing the respective estimates for the corresponding metastatic events for the patients included in the study. (C) Distributions of each clinical factor and associated protein expression pattern in the combined high ERβ + low ERα or combined low ERβ + high ERα expression groups in the TCGA-COAD cohort. The data were visualized via Circos software. The area of each colored ribbon depicts the frequency of the samples. *P < 0.05, **P < 0.01.

Similar articles

Cited by

References

    1. Jia M, Dahlman-Wright K, Gustafsson JA. Estrogen receptor alpha and beta in health and disease. Best Pract Res Clin Endocrinol Metab. (2015) 29:557–68. 10.1016/j.beem.2015.04.008 - DOI - PubMed
    1. Kennelly R, Kavanagh DO, Hogan AM, Winter DC. Oestrogen and the colon: potential mechanisms for cancer prevention. Lancet Oncol. (2008) 9:385–91. 10.1016/S1470-2045(08)70100-1 - DOI - PubMed
    1. Caiazza F, Ryan EJ, Doherty G, Winter DC, Sheahan K. Estrogen receptors and their implications in colorectal carcinogenesis. Front Oncol. (2015) 5:19. 10.3389/fonc.2015.00019 - DOI - PMC - PubMed
    1. Konstantinopoulos PA, Kominea A, Vandoros G, Sykiotis GP, Andricopoulos P, Varakis I, et al. . Oestrogen receptor beta (ERbeta) is abundantly expressed in normal colonic mucosa, but declines in colon adenocarcinoma paralleling the tumour's dedifferentiation. Eur J Cancer. (2003) 39:1251–8. 10.1016/S0959-8049(03)00239-9 - DOI - PubMed
    1. Rudolph A, Toth C, Hoffmeister M, Roth W, Herpel E, Jansen L, et al. . Expression of oestrogen receptor beta and prognosis of colorectal cancer. Br J Cancer. (2012) 107:831–9. 10.1038/bjc.2012.323 - DOI - PMC - PubMed

LinkOut - more resources