. 2022 Mar 14:9:792881.
doi: 10.3389/fmed.2022.792881. eCollection 2022.

Who Is at Risk of Poor Mental Health Following Coronavirus Disease-19 Outpatient Management?

Affiliations

Who Is at Risk of Poor Mental Health Following Coronavirus Disease-19 Outpatient Management?

Katharina Hüfner et al. Front Med (Lausanne). .

Abstract

Background: Coronavirus Disease-19 (COVID-19) convalescents are at risk of developing a de novo mental health disorder or worsening of a pre-existing one. COVID-19 outpatients have been less well characterized than their hospitalized counterparts. The objectives of our study were to identify indicators for poor mental health following COVID-19 outpatient management and to identify high-risk individuals.

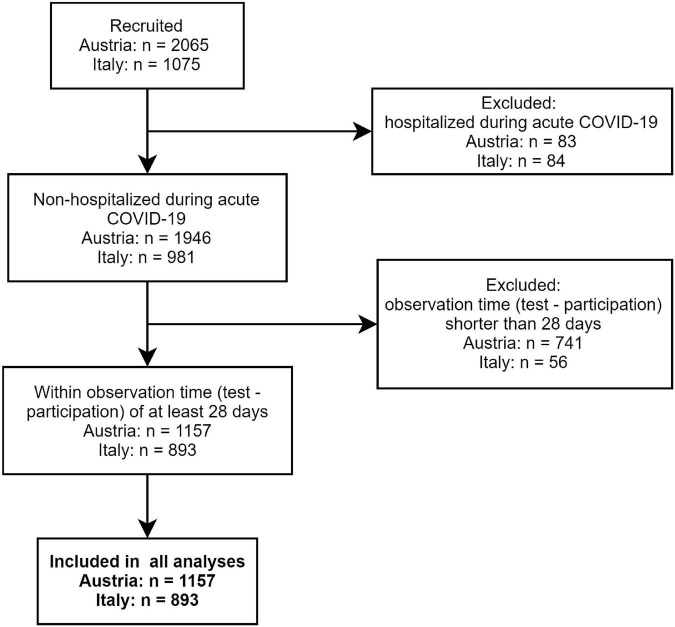
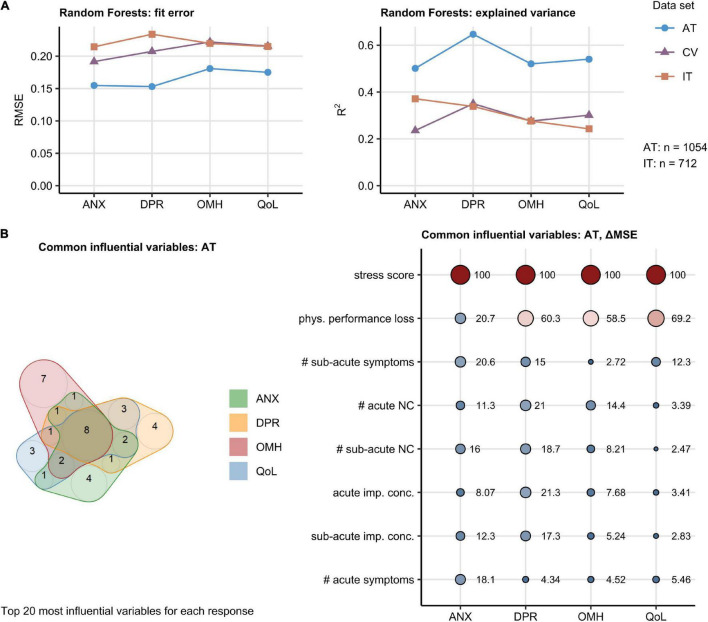
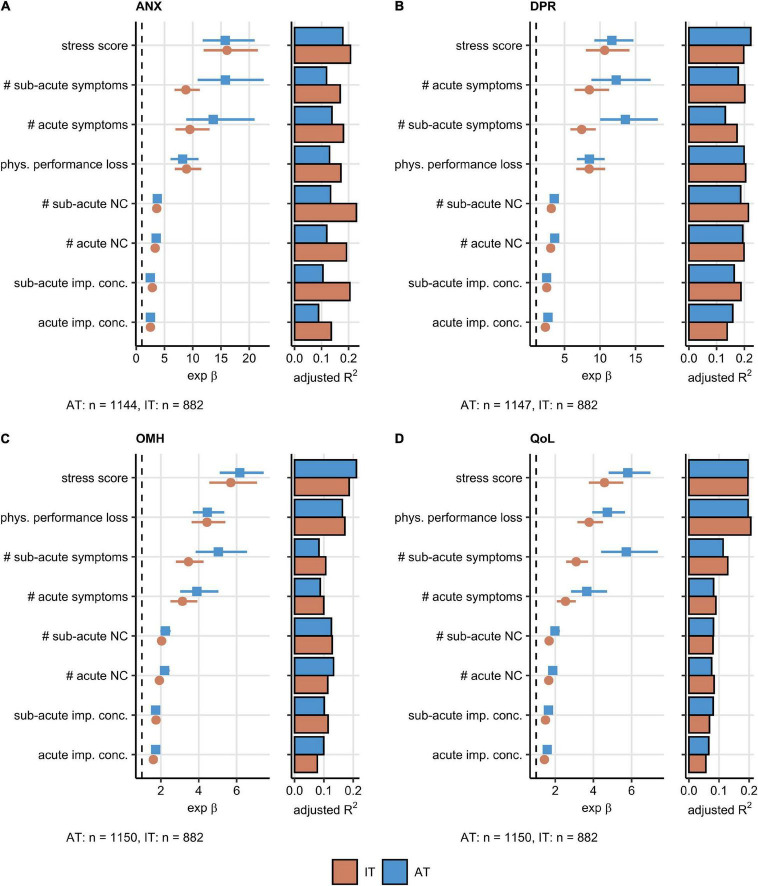
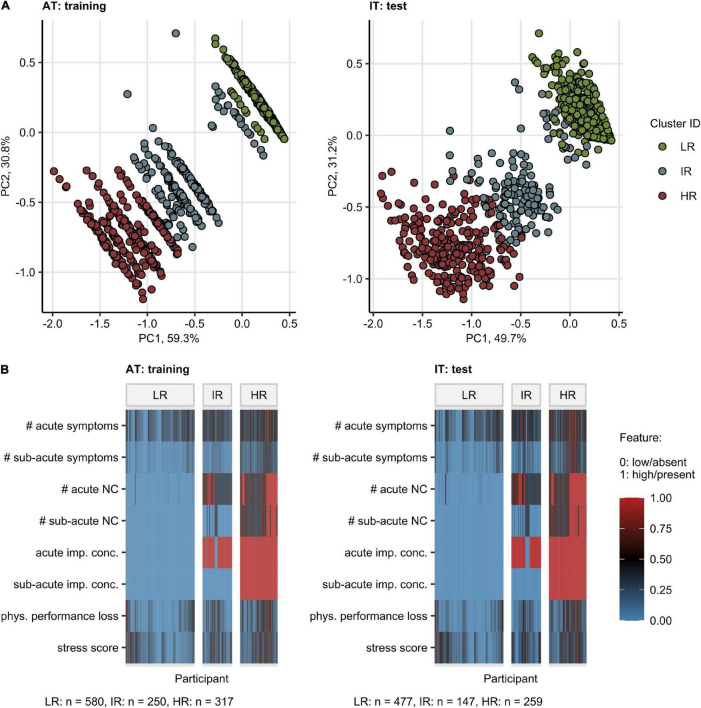
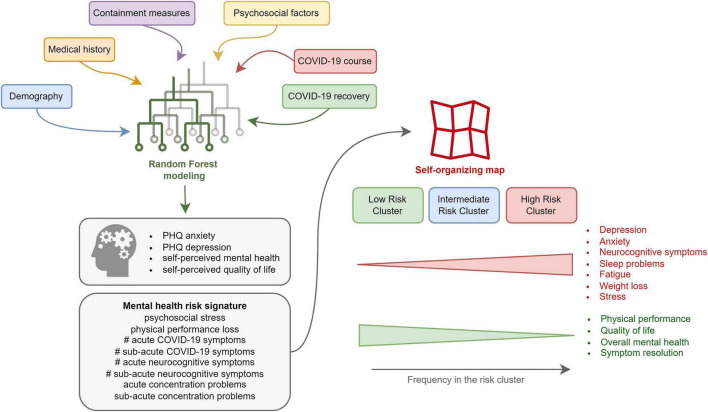
Methods: We conducted a binational online survey study with adult non-hospitalized COVID-19 convalescents (Austria/AT: n = 1,157, Italy/IT: n = 893). Primary endpoints were positive screening for depression and anxiety (Patient Health Questionnaire; PHQ-4) and self-perceived overall mental health (OMH) and quality of life (QoL) rated with 4 point Likert scales. Psychosocial stress was surveyed with a modified PHQ stress module. Associations of the mental health and QoL with socio-demographic, COVID-19 course, and recovery variables were assessed by multi-parameter Random Forest and Poisson modeling. Mental health risk subsets were defined by self-organizing maps (SOMs) and hierarchical clustering algorithms. The survey analyses are publicly available (https://im2-ibk.shinyapps.io/mental_health_dashboard/).

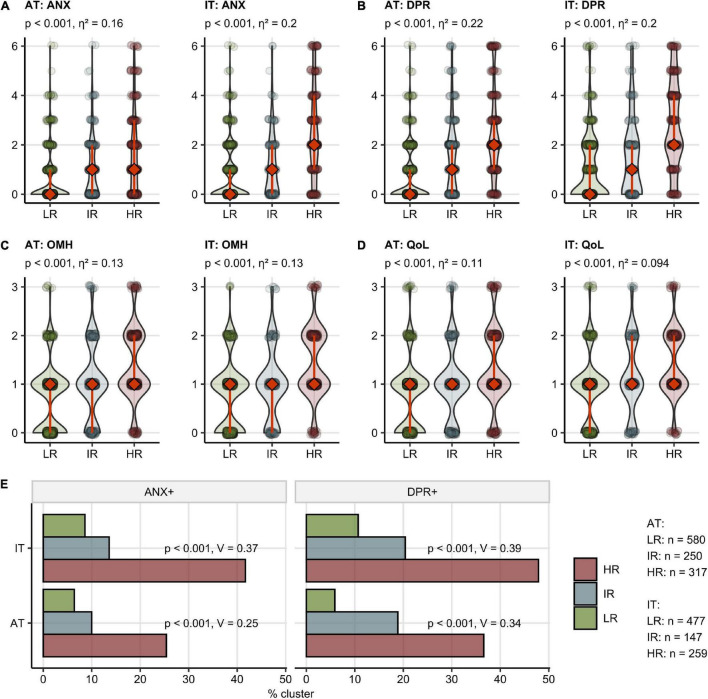
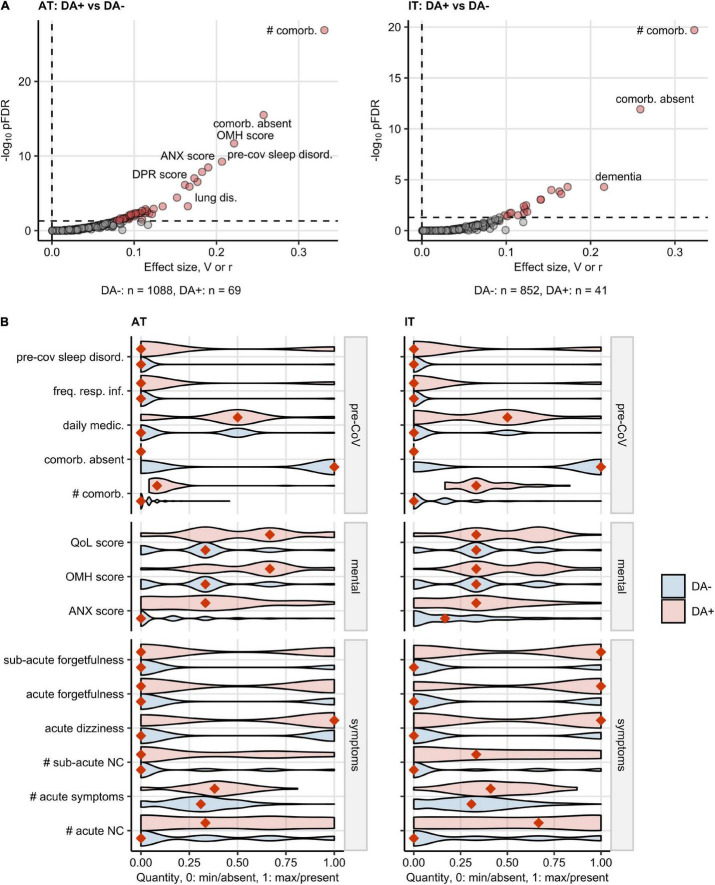
Results: Depression and/or anxiety before infection was reported by 4.6% (IT)/6% (AT) of participants. At a median of 79 days (AT)/96 days (IT) post-COVID-19 onset, 12.4% (AT)/19.3% (IT) of subjects were screened positive for anxiety and 17.3% (AT)/23.2% (IT) for depression. Over one-fifth of the respondents rated their OMH (AT: 21.8%, IT: 24.1%) or QoL (AT: 20.3%, IT: 25.9%) as fair or poor. Psychosocial stress, physical performance loss, high numbers of acute and sub-acute COVID-19 complaints, and the presence of acute and sub-acute neurocognitive symptoms (impaired concentration, confusion, and forgetfulness) were the strongest correlates of deteriorating mental health and poor QoL. In clustering analysis, these variables defined subsets with a particularly high propensity of post-COVID-19 mental health impairment and decreased QoL. Pre-existing depression or anxiety (DA) was associated with an increased symptom burden during acute COVID-19 and recovery.

Conclusion: Our study revealed a bidirectional relationship between COVID-19 symptoms and mental health. We put forward specific acute symptoms of the disease as "red flags" of mental health deterioration, which should prompt general practitioners to identify non-hospitalized COVID-19 patients who may benefit from early psychological and psychiatric intervention.

Clinical trial registration: [ClinicalTrials.gov], identifier [NCT04661462].

Keywords: COVID-19; SARS-CoV-2; anxiety; depression; long COVID; machine learning; mental stress; neurocognitive.


Conflict of interest statement

PT owns Data Analytics as a Service Tirol and has received an honorarium from the ‘Health after COVID-19 in Tyrol’ study team from the Medical University of Innsbruck and Claudiana Bolzano for the study data management, curation and analysis, and minor manuscript work. The remaining authors declare that the research was conducted in the absence of any commercial or financial relationships that could be construed as a potential conflict of interest.

Figures

FIGURE 1
FIGURE 1
Study inclusion flow diagram.
FIGURE 2
FIGURE 2
Random Forest modeling of the mental health and quality of life scoring during Coronavirus Disease-19 (COVID-19) convalescence. The effects of 201 demographic, clinical, socioeconomic, and psychosocial factors (Supplementary Table 1) on the anxiety (ANX), depression (DPR), overall mental health (OMH), and quality of life (QoL) scoring were modeled with the Random Forest technique. Numeric variables were minimum/maximum normalized prior to modeling. The models were trained and calibrated in Austria (AT) cohort, 10-fold cross-validated (CV), and their predictions validated in Italy (IT) cohort. The top 20 most influential explanatory variables were identified in the AT cohort for each mental health and life quality score by unbiased ΔMSE statistic (Supplementary Figures 6–9). The numbers of complete observations are indicated in (A). (A) Random Forest model performance measured by root mean squared error (RMSE) and the fraction of explained variance in mental health and quality of life scoring expressed as R2. (B) Identification of common influential explanatory variables. Left: overlap in the top 20 most influential explanatory variables presented in a quasi-proportional Venn plot. Right: ΔMSE statistics for the most influential explanatory statistics shared by all responses, point size and color corresponds to the ΔMSE value. NC: neurocognitive symptoms, imp. conc.: impaired concentration, phys.: physical, #: number of.
FIGURE 3
FIGURE 3
Association of the most influential factors with the mental health readouts investigated by univariable modeling. Association of the most influential factors for the mental health and quality of life scoring (Figure 2B) with the anxiety (ANX) (A), depression (DPR) (B), overall mental health (OMH) (C), and quality of life (QoL) (D) rating was investigated by univariable, age- and sex-weighted Poisson regression (Supplementary Table 2). Numeric variables were minimum/maximum normalized prior to modeling. Exponent β estimate values with 95% Cis presented as Forest plots. Explained variance fraction estimated by adjusted R2 is presented in adjunct bar plots. The numbers of complete observations are shown under the plots. AT: Austria, IT: Italy. NC: neurocognitive symptoms, imp. conc.: impaired concentration, phys.: physical, #: number of.
FIGURE 4
FIGURE 4
Clustering of the study participants by the most influential factors affecting the mental health and quality of life scoring. Study participants were assigned to the Low Risk (LR), Intermediate Risk (IR), and High Risk (HR) subsets by clustering in respect to the most influential factors for the mental health and quality of life scoring (Figure 2B). Numeric variables were minimum/maximum normalized prior to modeling. The procedure in the training Austria (AT) cohort involved the self-organizing map (SOM, 13 13 hexagonal grid, Manhattan distance between participants) and the hierarchical clustering (Ward D2 method, Manhattan distance between the SOM nodes) algorithms. Assignment of Italy (IT) cohort participants to the clusters was accomplished by the k-nearest neighbors classification. The numbers of participants assigned to the clusters are presented in (B). (A) Cluster assignment of the participants in the 3-dimensional principal component (PC) analysis score plot. The first two components are shown. Percentages of the data set variance associated with the particular PC are presented in the plot axes. (B) Heat map of the minimum/maximum-normalized clustering features. NC: neurocognitive symptoms, imp. conc.: impaired concentration, phys.: physical, #: number of.
FIGURE 5
FIGURE 5
Mental health and quality of life scoring, depression and anxiety prevalence in the mental health risk clusters. Study participants were assigned to the Low Risk (LR), Intermediate Risk (IR), and High Risk (HR) subsets as presented in Figure 4. The numbers of participants assigned to the clusters are presented in (E). (A–D) Rating of anxiety (ANX) (A), depression (DPR) (B), overall mental health (OMH) (C), and quality of life (QoL) (D) in the clusters presented as violin plots, diamonds with whiskers represent medians with IQRs. Statistical significance was assessed by the Kruskal–Wallis test. P-values corrected for multiple testing with the Benjamini-Hochberg method and η2 effect size statistic values are shown in the plot captions. (B) Frequency of positive depression (DPR+) and anxiety (ANX+) screening in the clusters. Statistical significance was assessed by the Benjamini-Hochberg-corrected χ2 test, the effect size was expressed as Cramer’s V.
FIGURE 6
FIGURE 6
Characteristic of baseline features, COVID-19 course, and recovery in participants with pre-existing depression or anxiety. Differences in baseline characteristic, COVID-19 course, recovery, mental health, and quality of life scoring between the participants with pre-existing depression or anxiety (DA+) and the subjects without depression/anxiety history (DA–) were assessed by the χ2 or Mann–Whitney test in Austria (AT) and Italy (IT) cohort. The numeric variables were minimum/maximum normalized prior to modeling. The testing results were corrected from multiple testing with the Benjamini-Hochberg method (FDR: False Discovery Rate). The numbers of DA+ and DA– participants are shown in (A). (A) Multiple testing-adjusted significance (pFDR) and effect size (categorical: Cramer’s V for categorical factors, numeric features: Wilcoxon r) for the investigated variables. Variables significantly different between DA+ and DA – are highlighted in red. (B) Values of the features significantly different between DA+ and DA– participants in both AT and IT collectives presented in violin plots. The numeric features were minimum/maximum normalized. Orange diamonds represent mode (categorical variables) or median values (numeric variables). pre-CoV: before COVID-19, sleep disord.: sleep disorder, freq. resp. inf.: >2 respiratory infections per yes before COVID-19, daily medic.: number of drugs taken daily, comorb.: comorbidities, #: number of, QoL: quality of life, OMH: overall mental health, ANX: anxiety, NC: neurocognitive symptoms.
FIGURE 7
FIGURE 7
Summary of the study results.

References

    1. Martin A, Rief W, Klaiberg A, Braehler E. Validity of the brief patient health questionnaire mood scale (PHQ-9) in the general population. Gen Hosp Psychiatry. (2006) 28:71–7. 10.1016/j.genhosppsych.2005.07.003 - DOI - PubMed
    1. Löwe B, Decker O, Müller S, Brähler E, Schellberg D, Herzog W, et al. Validation and standardization of the generalized anxiety disorder screener (GAD-7) in the general population. Med Care. (2008) 46:266–74. 10.1097/MLR.0b013e318160d093 - DOI - PubMed
    1. Pieh C, Budimir S, Probst T. The effect of age, gender, income, work, and physical activity on mental health during coronavirus disease (COVID-19) lockdown in Austria. J Psychosom Res. (2020) 136:110186. 10.1016/j.jpsychores.2020.110186 - DOI - PMC - PubMed
    1. Nasserie T, Hittle M, Goodman SN. Assessment of the frequency and variety of persistent symptoms among patients with COVID-19: a systematic review. JAMA Netw Open. (2021) 4:e2111417. 10.1001/jamanetworkopen.2021.11417 - DOI - PMC - PubMed
    1. Huang C, Huang L, Wang Y, Li X, Ren L, Gu X, et al. 6-month consequences of COVID-19 in patients discharged from hospital: a cohort study. Lancet. (2021) 397:220–32. 10.1016/S0140-6736(20)32656-8 - DOI - PMC - PubMed

Associated data