

An objective metric of individual health and aging for population surveys
- PMID: 35361249
- PMCID: PMC8974028
- DOI: 10.1186/s12963-022-00289-0
An objective metric of individual health and aging for population surveys
Abstract
Background: We have previously developed and validated a biomarker-based metric of overall health status using Mahalanobis distance (DM) to measure how far from the norm of a reference population (RP) an individual's biomarker profile is. DM is not particularly sensitive to the choice of biomarkers; however, this makes comparison across studies difficult. Here we aimed to identify and validate a standard, optimized version of DM that would be highly stable across populations, while using fewer and more commonly measured biomarkers.
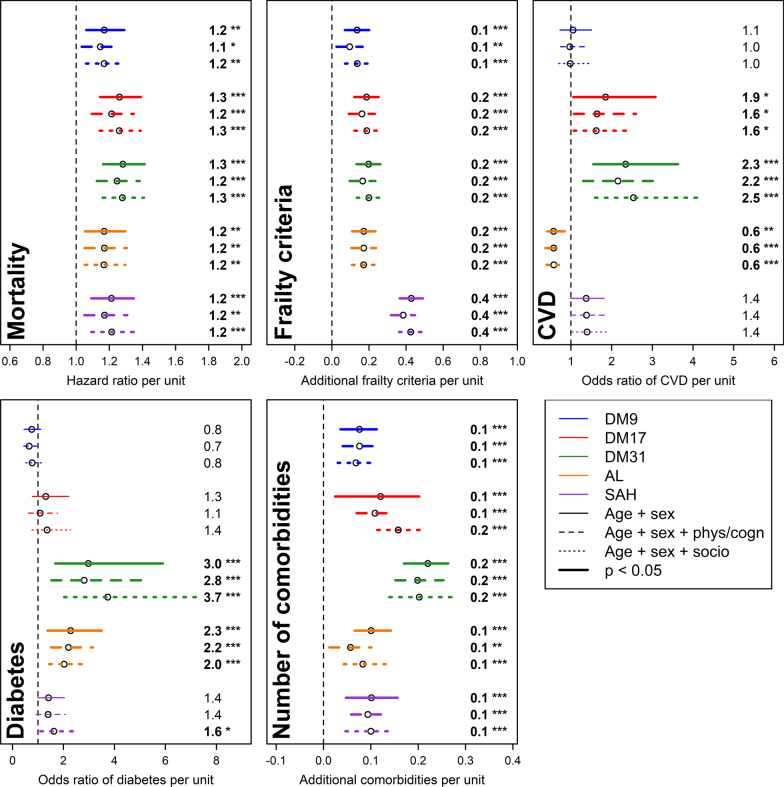
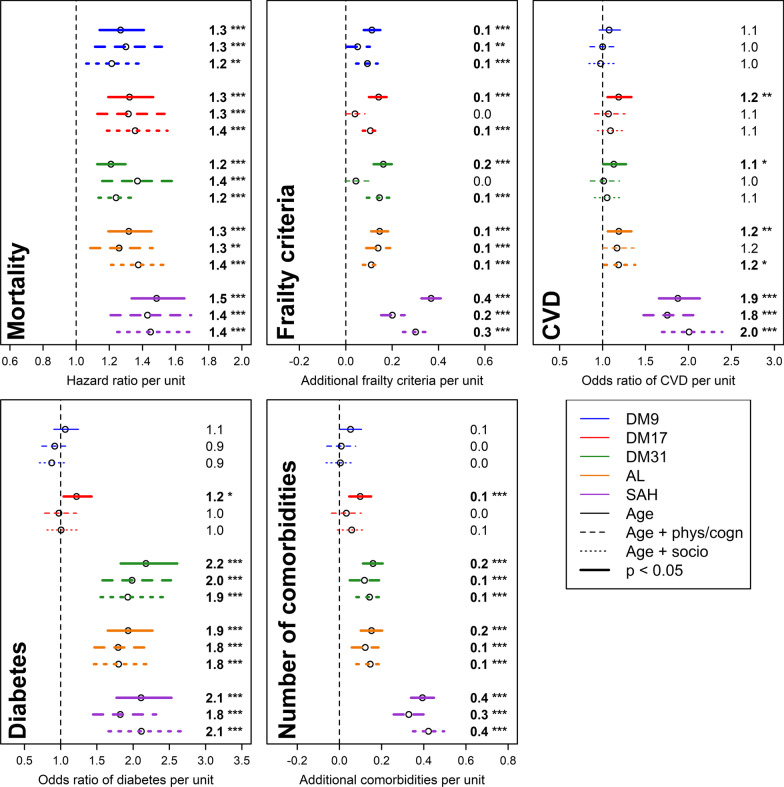
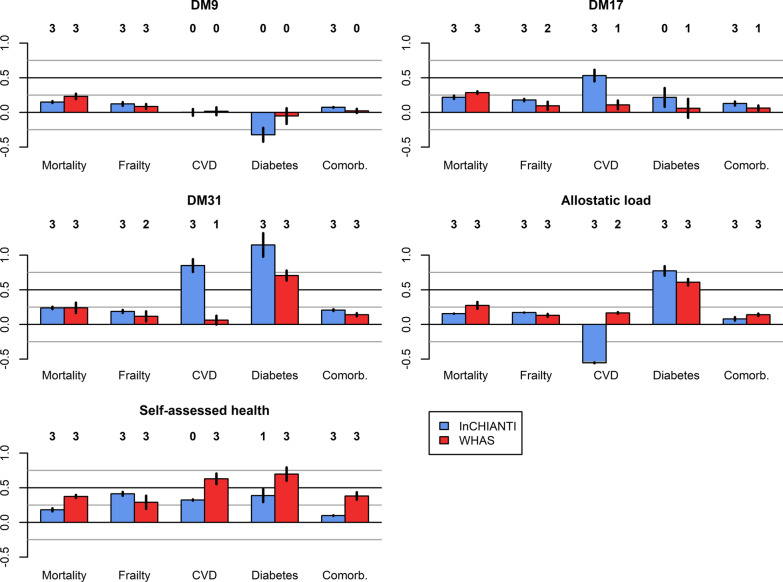
Methods: Using three datasets (the Baltimore Longitudinal Study of Aging, Invecchiare in Chianti and the National Health and Nutrition Examination Survey), we selected the most stable sets of biomarkers in all three populations, notably when interchanging RPs across populations. We performed regression models, using a fourth dataset (the Women's Health and Aging Study), to compare the new DM sets to other well-known metrics [allostatic load (AL) and self-assessed health (SAH)] in their association with diverse health outcomes: mortality, frailty, cardiovascular disease (CVD), diabetes, and comorbidity number.
Results: A nine- (DM9) and a seventeen-biomarker set (DM17) were identified as highly stable regardless of the chosen RP (e.g.: mean correlation among versions generated by interchanging RPs across dataset of r = 0.94 for both DM9 and DM17). In general, DM17 and DM9 were both competitive compared with AL and SAH in predicting aging correlates, with some exceptions for DM9. For example, DM9, DM17, AL, and SAH all predicted mortality to a similar extent (ranges of hazard ratios of 1.15-1.30, 1.21-1.36, 1.17-1.38, and 1.17-1.49, respectively). On the other hand, DM9 predicted CVD less well than DM17 (ranges of odds ratios of 0.97-1.08, 1.07-1.85, respectively).
Conclusions: The metrics we propose here are easy to measure with data that are already available in a wide array of panel, cohort, and clinical studies. The standardized versions here lose a small amount of predictive power compared to more complete versions, but are nonetheless competitive with existing metrics of overall health. DM17 performs slightly better than DM9 and should be preferred in most cases, but DM9 may still be used when a more limited number of biomarkers is available.
Keywords: Allostatic load; Biomarkers; Mahalanobis distance; Physiological dysregulation; Population composition; Self-assessed health.
© 2022. The Author(s).
Conflict of interest statement
AAC declares a CoI as Founder and CEO at Oken Health. No other competing interests are declared.
Figures

References
-
- Lindeboom M, van Doorslaer E. Cut-point shift and index shift in self-reported health. J Health Econ. 2004;23:1083–1099. - PubMed
-
- Bound J. Self-reported versus objective measures of health in retirement models. J Human Resour. 1991;26:106–138.
-
- Charlson M, Szatrowski TP, Peterson J, Gold J. Validation of a combined comorbidity index. J Clin Epidemiol. 1994;47:1245–1251. - PubMed
-
- Fried LP, Tangen CM, Walston J, Newman AB, Hirsch C, Gottdiener J, et al. Frailty in older adults: evidence for a phenotype. J Gerontol A Biol Sci Med Sci. 2001;56:M146–M156. - PubMed
Publication types
MeSH terms
Substances
Grants and funding
LinkOut - more resources
Full Text Sources
Medical
