

Study on the role of transcription factor SPI1 in the development of glioma
- PMID: 35361282
- PMCID: PMC8973577
- DOI: 10.1186/s41016-022-00276-2
Study on the role of transcription factor SPI1 in the development of glioma
Abstract
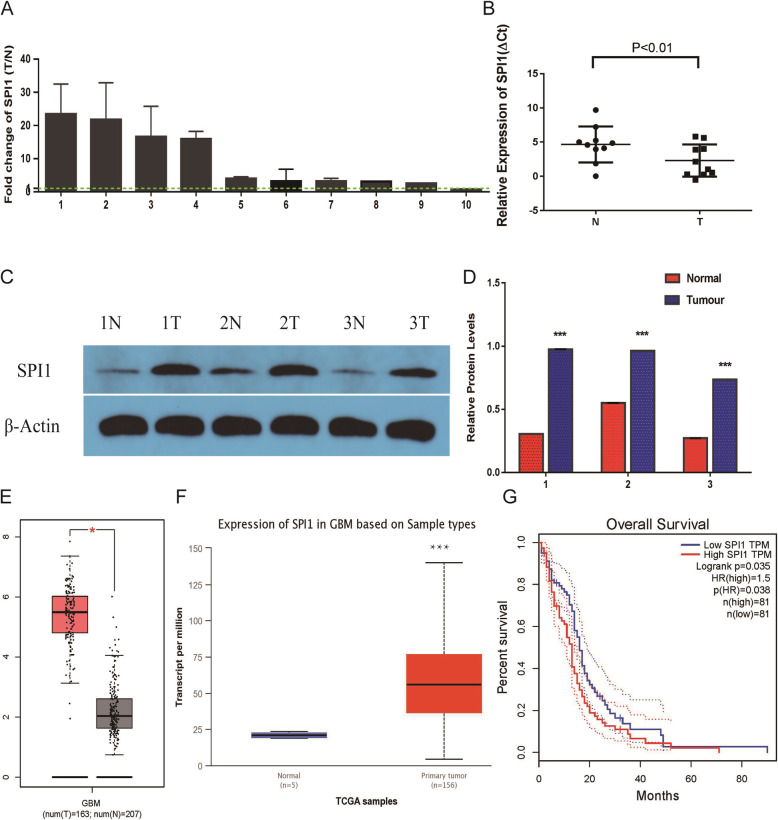
Background: Glioma is a common malignant brain tumor. The purpose of this study was to investigate the role of the transcription factor SPI1 in glioma.
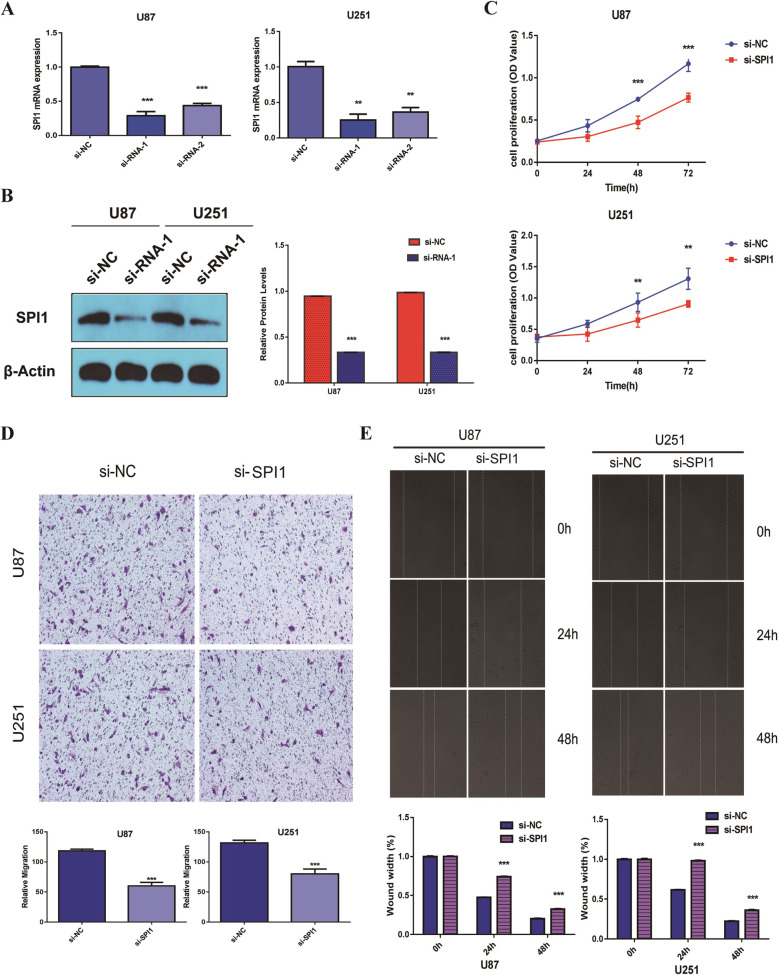
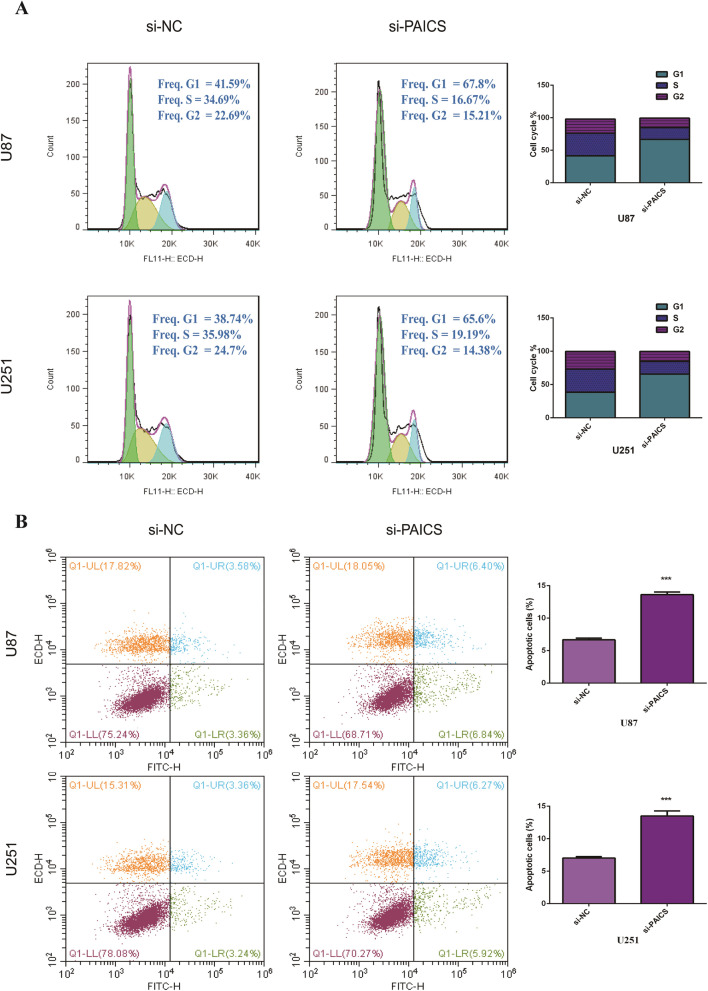
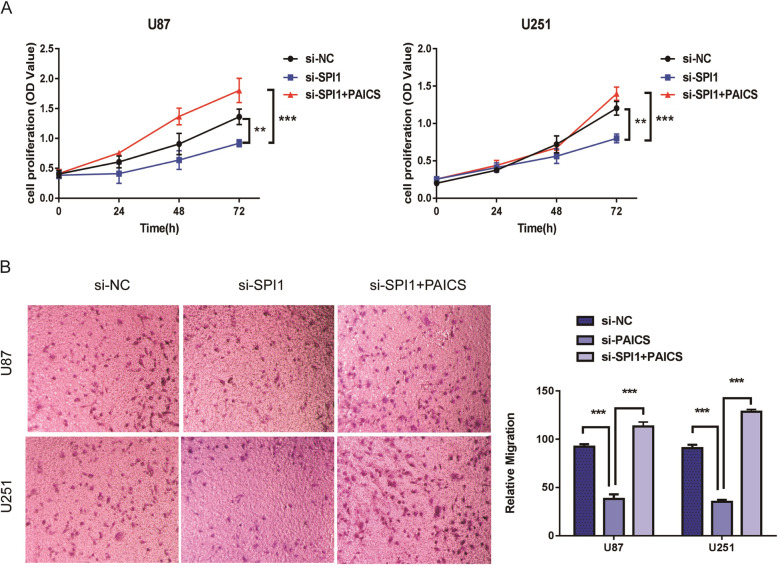
Methods: SPI1 expression in glioma was identified using qRT-PCR and Western blotting. Cell proliferation was assessed using the CCK8 assay. Transwell and wound healing assays were utilized to evaluate cell migration. Additionally, cell cycle and apoptosis were detected using flow cytometry.
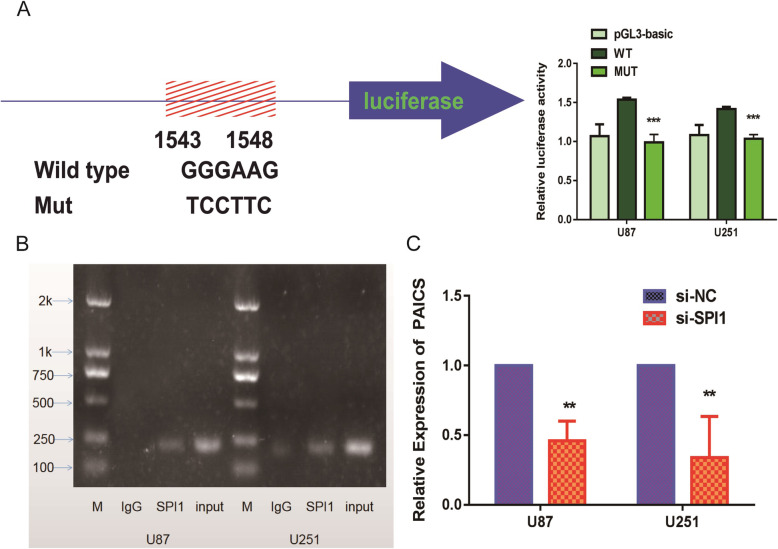
Results: We observed that the expression level of SPI1 was up-regulated in glioma tissues, compared to normal tissues. Furthermore, we found that SPI1 is able to promote proliferation and migration of glioma cells in vitro. Flow cytometry results demonstrate that, compared to si-NC cells, si-SPI1 cells stagnated in the G1 phase, and down-regulation of SPI1 expression is able to increase rates of apoptosis. Double luciferase activity and chromatin immunoprecipitation assay results indicated that SPI1 can bind to the promoter sites and promote the proliferation and migration of glioma cells by regulating the expression of oncogenic PAICS.
Conclusions: Our results suggest that SPI1 can promote proliferation and migration of glioma. Furthermore, SPI1 can be utilized as a potential diagnostic marker and therapeutic target for glioma.
Keywords: Glioma; PAICS; SPI1; migration; proliferation.
© 2022. The Author(s).
Conflict of interest statement
The authors declare that they have no conflict of interest.
Figures
Similar articles
-
PAICS is related to glioma grade and can promote glioma growth and migration.J Cell Mol Med. 2021 Aug;25(16):7720-7733. doi: 10.1111/jcmm.16647. Epub 2021 Jun 26. J Cell Mol Med. 2021. PMID: 34173716 Free PMC article.
-
Microrchidia family CW‑type zinc finger 2 promotes the proliferation, invasion, migration and epithelial‑mesenchymal transition of glioma by regulating PTEN/PI3K/AKT signaling via binding to N‑myc downstream regulated gene 1 promoter.Int J Mol Med. 2022 Feb;49(2):16. doi: 10.3892/ijmm.2021.5071. Epub 2021 Dec 16. Int J Mol Med. 2022. PMID: 34913078 Free PMC article.
-
MicroRNA-383 expression regulates proliferation, migration, invasion, and apoptosis in human glioma cells.Tumour Biol. 2015 Sep;36(10):7743-53. doi: 10.1007/s13277-015-3378-2. Epub 2015 May 4. Tumour Biol. 2015. PMID: 25936342
-
[Down-regulation of lncRNA TTTY15 targeting miR-4500 to inhibit the biological characteristics of A172 glioma cells].Zhonghua Yi Xue Yi Chuan Xue Za Zhi. 2022 Feb 10;39(2):171-175. doi: 10.3760/cma.j.cn511374-20201116-00801. Zhonghua Yi Xue Yi Chuan Xue Za Zhi. 2022. PMID: 35076913 Chinese.
-
Long Non-Coding RNA LINC01260 Inhibits the Proliferation, Migration and Invasion of Spinal Cord Glioma Cells by Targeting CARD11 Via the NF-κB Signaling Pathway.Cell Physiol Biochem. 2018;48(4):1563-1578. doi: 10.1159/000492279. Epub 2018 Aug 2. Cell Physiol Biochem. 2018. Retraction in: Cell Physiol Biochem. 2021;55(5):672. doi: 10.33594/000000462. PMID: 30071522 Retracted.
Cited by
-
Profiling the heterogeneity of colorectal cancer consensus molecular subtypes using spatial transcriptomics.NPJ Precis Oncol. 2024 Jan 10;8(1):10. doi: 10.1038/s41698-023-00488-4. NPJ Precis Oncol. 2024. PMID: 38200223 Free PMC article.
-
Multi-omics joint screening of biomarkers related to M2 macrophages in gastric cancer.Discov Oncol. 2024 Dec 2;15(1):738. doi: 10.1007/s12672-024-01623-8. Discov Oncol. 2024. PMID: 39623254 Free PMC article.
-
Narrowing the Relationship between Human CCR5 Gene Polymorphisms and Chagas Disease: Systematic Review and Meta-Analysis.Life (Basel). 2023 Aug 2;13(8):1677. doi: 10.3390/life13081677. Life (Basel). 2023. PMID: 37629534 Free PMC article.
-
N6-methyladenosine methyltransferase KIAA1429 promoted ovarian cancer aerobic glycolysis and progression through enhancing ENO1 expression.Biol Direct. 2023 Oct 9;18(1):64. doi: 10.1186/s13062-023-00420-7. Biol Direct. 2023. PMID: 37807062 Free PMC article.
-
A multi-omics approach for biomarker discovery in neuroblastoma: a network-based framework.NPJ Syst Biol Appl. 2024 May 17;10(1):52. doi: 10.1038/s41540-024-00371-3. NPJ Syst Biol Appl. 2024. PMID: 38760476 Free PMC article.
References
-
- Guo WQ, Chen YG, Shi RZ, He K, Wang JF, Shao JH, et al. 20(S)-Protopanaxdiol Suppresses the Abnormal Granule-Monocyte Differentiation of Hematopoietic Stem Cells in 4T1 Breast Cancer-Bearing Mouse. Evid Based Complement Alternat Med. 2020;2020:8747023. doi: 10.1155/2020/8747023. - DOI - PMC - PubMed
Grants and funding
LinkOut - more resources
Full Text Sources
Miscellaneous