. 2023 Jan;72(1):153-167.
doi: 10.1136/gutjnl-2021-325915. Epub 2022 Mar 31.

Single-cell RNA sequencing reveals intrahepatic and peripheral immune characteristics related to disease phases in HBV-infected patients

Affiliations

Single-cell RNA sequencing reveals intrahepatic and peripheral immune characteristics related to disease phases in HBV-infected patients

Chao Zhang et al. Gut. 2023 Jan.

Abstract

Objective: A comprehensive immune landscape for HBV infection is pivotal to achieve HBV cure.

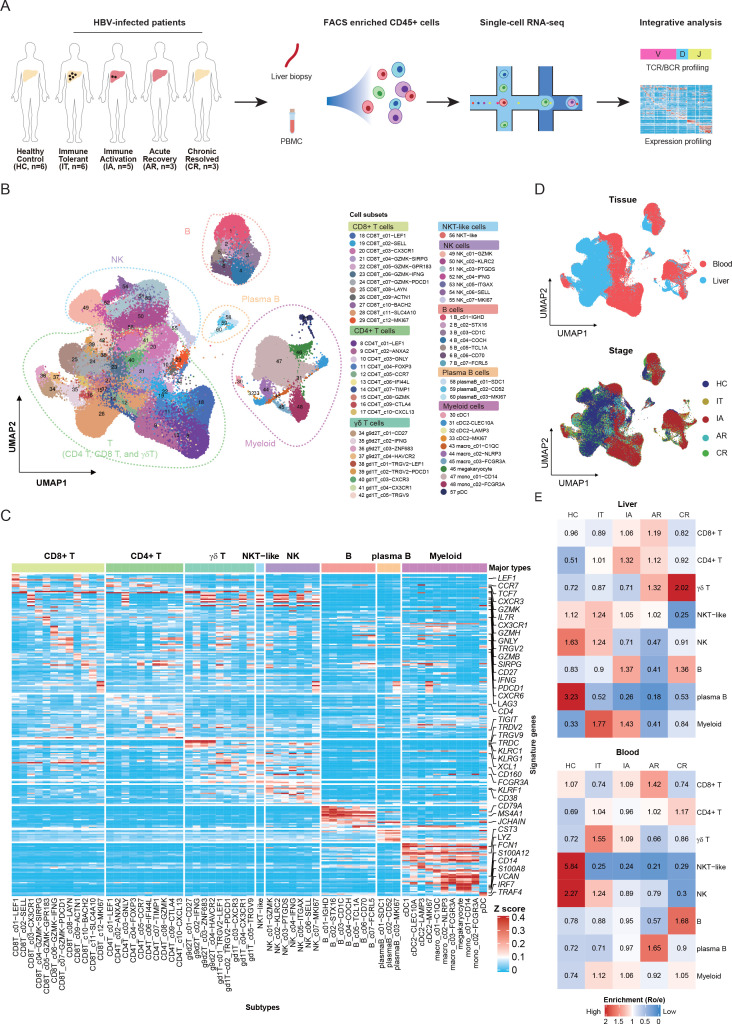
Design: We performed single-cell RNA sequencing of 2 43 000 cells from 46 paired liver and blood samples of 23 individuals, including six immune tolerant, 5 immune active (IA), 3 acute recovery (AR), 3 chronic resolved and 6 HBV-free healthy controls (HCs). Flow cytometry and histological assays were applied in a second HBV cohort for validation.

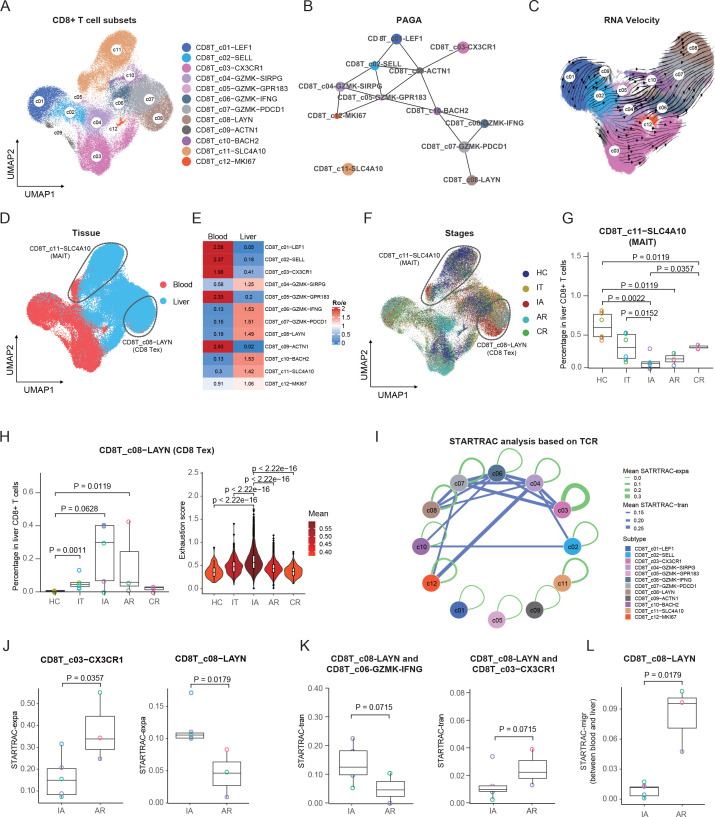
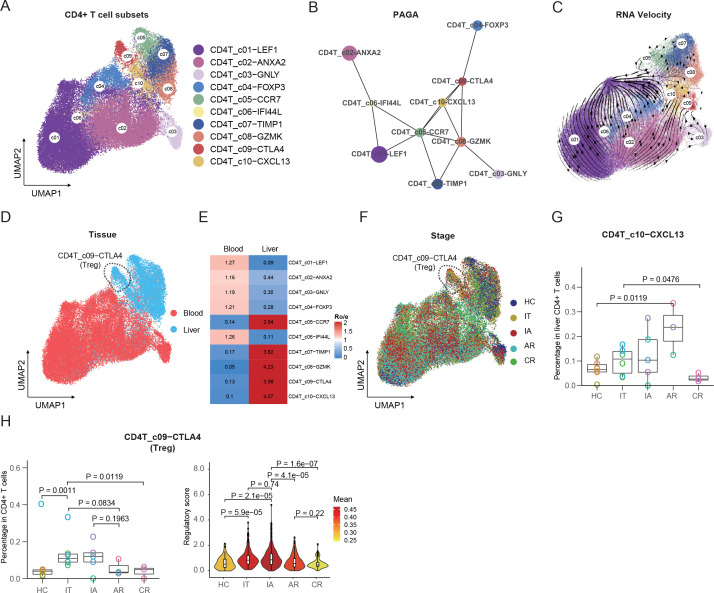
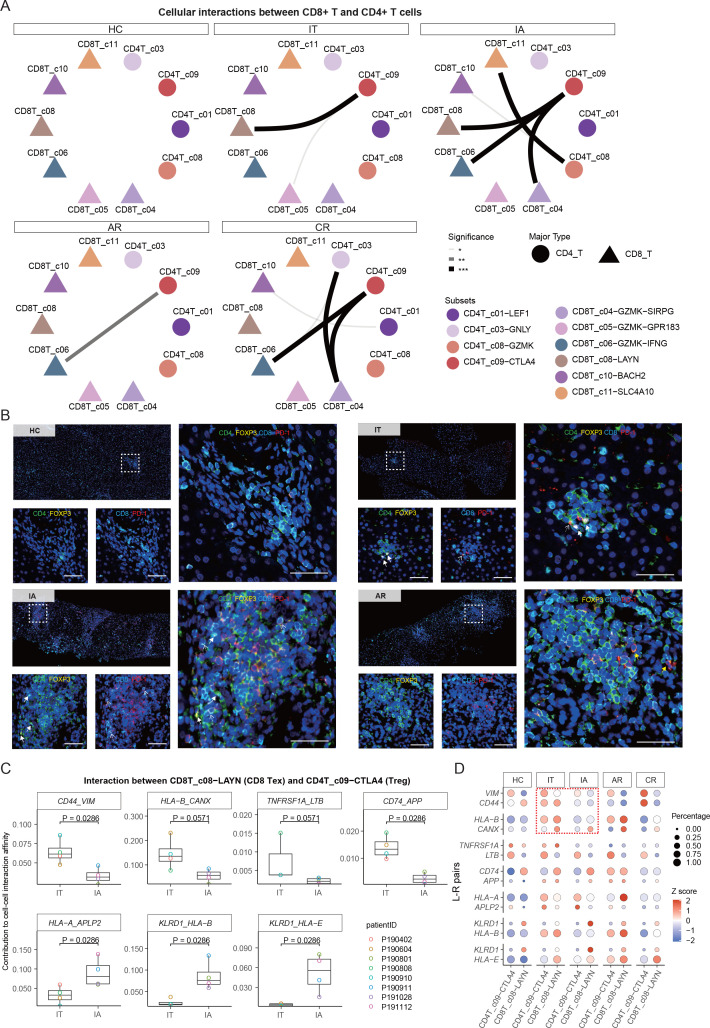
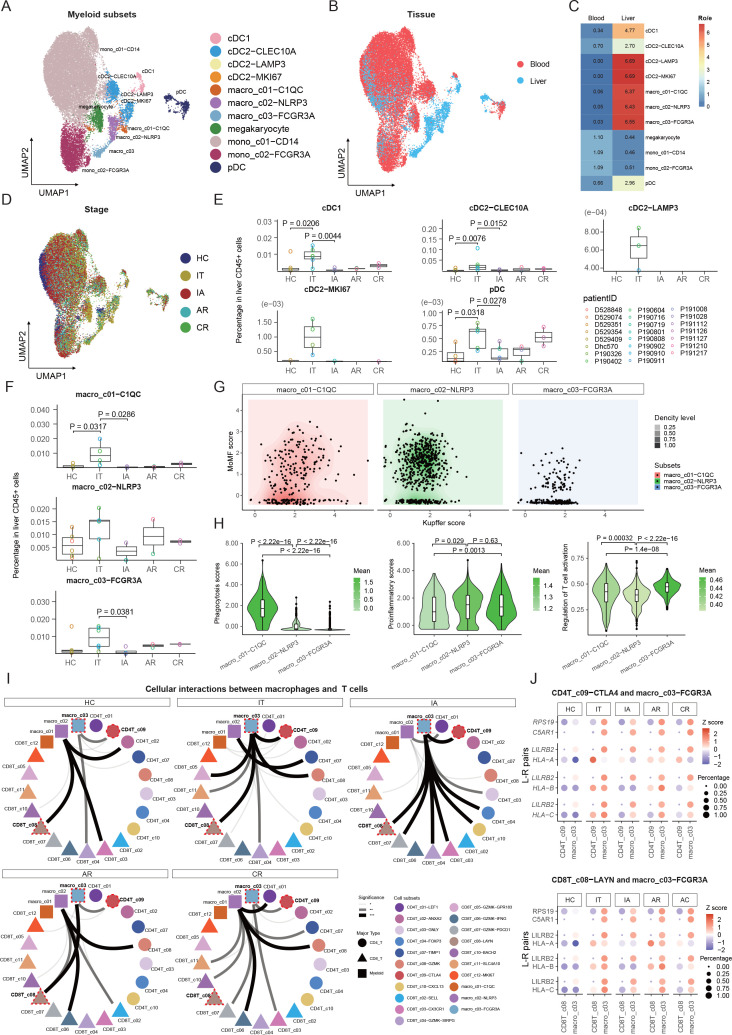
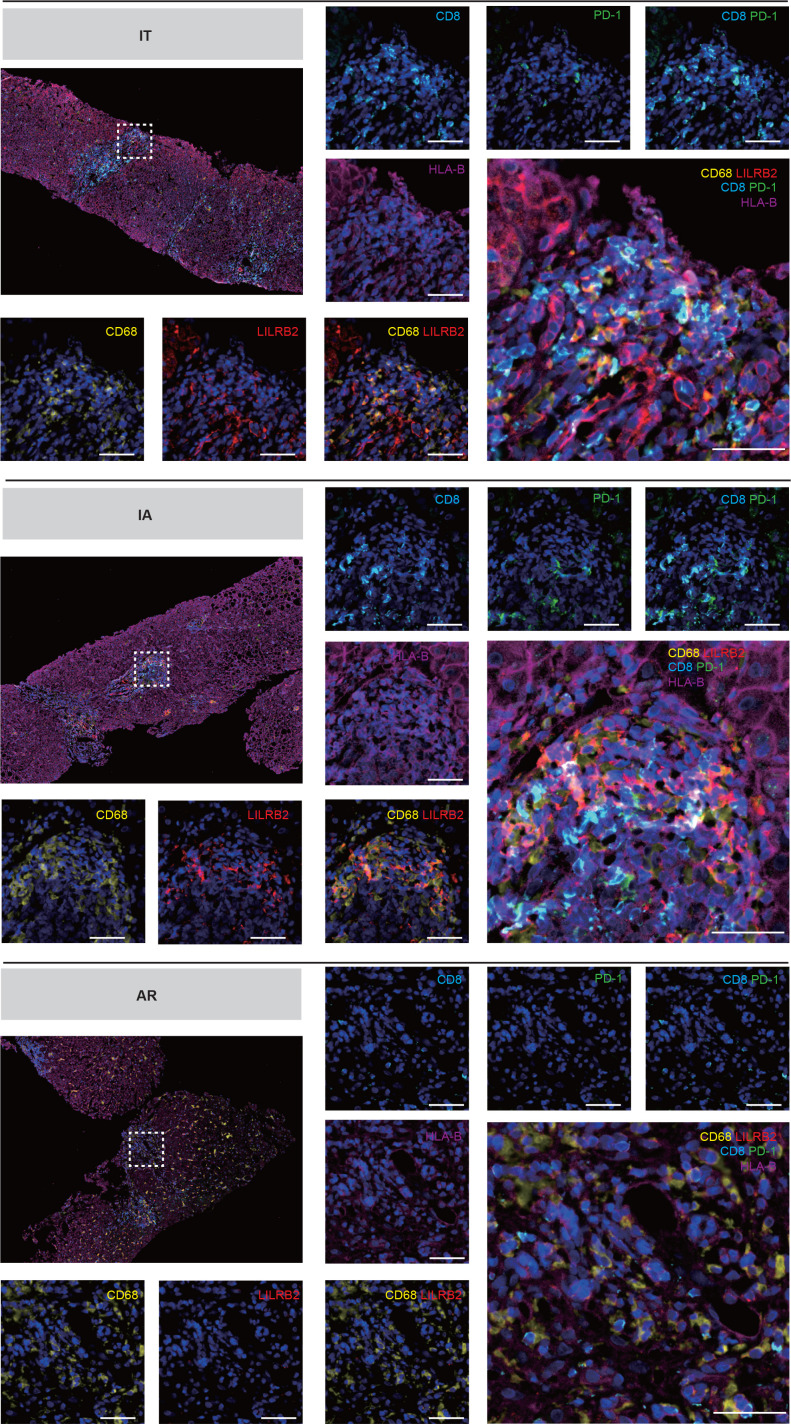
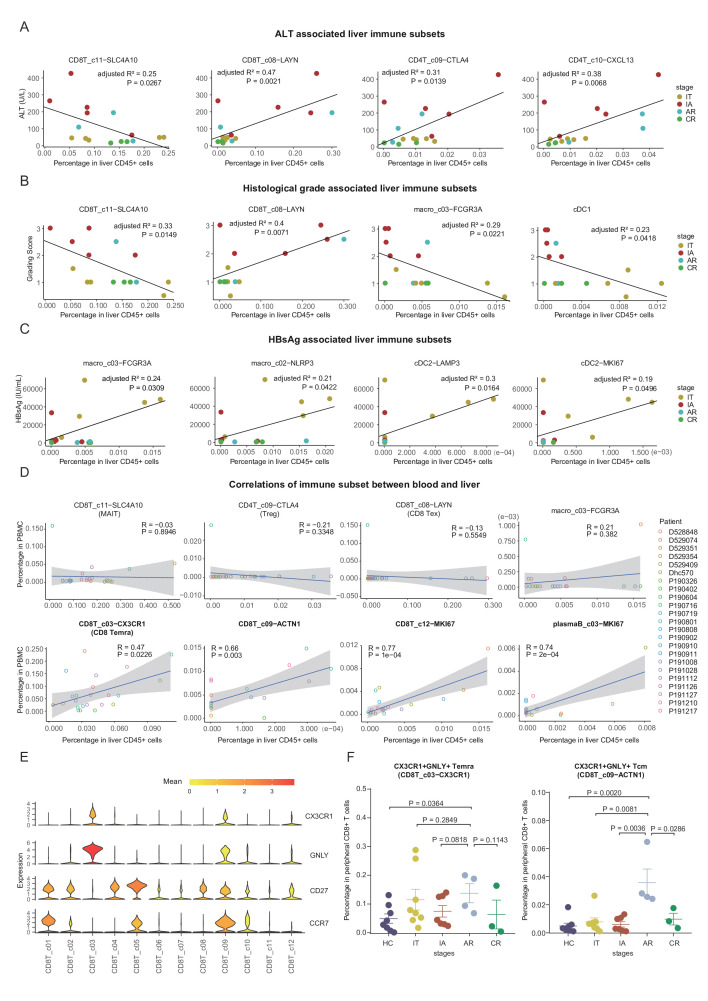
Results: Both IA and AR were characterised by high levels of intrahepatic exhausted CD8+ T (Tex) cells. In IA, Tex cells were mainly derived from liver-resident GZMK+ effector memory T cells and self-expansion. By contrast, peripheral CX3CR1+ effector T cells and GZMK+ effector memory T cells were the main source of Tex cells in AR. In IA but not AR, significant cell-cell interactions were observed between Tex cells and regulatory CD4+ T cells, as well as between Tex and FCGR3A+ macrophages. Such interactions were potentially mediated through human leukocyte antigen class I molecules together with their receptors CANX and LILRBs, respectively, contributing to the dysfunction of antiviral immune responses. By contrast, CX3CR1+GNLY+ central memory CD8+ T cells were concurrently expanded in both liver and blood of AR, providing a potential surrogate marker for viral resolution. In clinic, intrahepatic Tex cells were positively correlated with serum alanine aminotransferase levels and histological grading scores.

Conclusion: Our study dissects the coordinated immune responses for different HBV infection phases and provides a rich resource for fully understanding immunopathogenesis and developing effective therapeutic strategies.

Keywords: HEPATITIS B; IMMUNE RESPONSE; MACROPHAGES; T LYMPHOCYTES; TOLERANCE.


Conflict of interest statement

Competing interests: ZZ is a founder of Analytical Bioscience and an advisor for InnoCare. All financial interests are unrelated to this study. The remaining authors declare no competing interests.

Figures

Figure 1
Figure 1
Single-cell transcriptome map of immune cells in liver and blood. (A) An experimental scheme diagram of the overall study design. Hepatic immune cells and paired PBMCs were collected and subjected for cell barcoding. The cDNA libraries of 5′-mRNA expression, TCR and BCR were constructed independently, followed by high-throughput sequencing and downstream analyses. (B) UMAP plots of the 243 000 single cells from 23 individuals, including 8 major clusters and 60 subclusters. (C) Gene expression heatmap in each cell cluster. EXP, z-score normalised mean expression. (D) UMAP plots of major cell clusters showing tissue distribution and stage distribution. (E) Tissue prevalence of major cell clusters estimated by Ro/e score. AR, acute recovery; BCR, B-cell receptor; cDNA, complementary DNA; CR, chronic resolved; HC, healthy control; IA, immune active; IT, immune tolerant; NK, natural killer; PBMC, peripheral blood mononuclear cell; TCR, T-cell receptor; UMAP, uniform manifold approximation and projection.
Figure 2
Figure 2
Immunological features of CD8+ T-cell subsets. (A) UMAP plots of CD8+ T-cell subsets. (B) PAGA analysis showing the potential developmental connectivity between different CD8+ T-cell subsets. (C) RNA velocity analysis showing the transition potential among CD8+ T-cell subsets. (D) UMAP plots of CD8+ T-cell subsets showing tissue distribution. (E) Tissue prevalence of CD8+ T-cell subsets estimated by Ro/e score. (F) UMAP plots of CD8+ T-cell subsets showing stage distribution. (G) Box plots showing the proportions of MAIT cells in liver CD8+ T cells across stages. One-sided unpaired Wilcoxon test. (H) Box plots showing the proportions and violin plots showing the exhaustion scores of Tex cells across stages. One-sided unpaired Wilcoxon test. (I) Clonal expansion and state transition of CD8+ T-cell subsets estimated by STARTRAC analysis based on all patients. (J) Box plots showing the expansion levels (STARTRAC-expa) of Temra and Tex subsets in IA and AR stages. One-sided unpaired Wilcoxon test. (K) Box plots showing the transition scores (STARTRAC-tran) between Tex and CD8T_c06-GZMK-IFNG and CD8T_c03−CX3CR1 in IA and AR stages. One-sided unpaired Wilcoxon test. (L) Box plots showing the migration scores (STARTRAC-migr) of the Tex subset between blood and liver in IA and AR stages. One-sided unpaired Wilcoxon test. AR, acute recovery; CR, chronic resolved; HC, healthy control; IA, immune active; IT, immune tolerant; MAIT, mucosal-associated invariant T; PAGA, partition-based graph abstraction; STARTRAC, single T-cell analysis by RNA sequencing and TCR tracking; Temra, recently activated effector memory or effector T; Tex, exhausted CD8+ T; UMAP, uniform manifold approximation and projection.
Figure 3
Figure 3
Immunological features of CD4+ T-cell subsets and interaction with CD8+ T cells. (A) The UMAP plots of CD4+ T-cell subsets. (B) PAGA analysis showing the potential developmental connectivity between different CD4+ T-cell subsets. (C) RNA velocity analysis showing the transition potential among CD4+ T-cell subsets. (D) The UMAP plots of CD4+ T-cell subsets showing tissue distribution. (E) Tissue prevalence of CD4+ T-cell subsets estimated by Ro/e score. (F) The UMAP plots of CD4+ T-cell subsets showing stage distribution. (G) Box plots showing the proportions of CXCL13+ CD4+ T cells in liver CD4+ T cells across stages. One-sided unpaired Wilcoxon test. (H) Box plots showing the proportions and violin plots showing the regulatory scores of liver-resident Treg cells across stages. One-sided unpaired Wilcoxon test. AR, acute recovery; CR, chronic resolved; HC, healthy control; IA, immune active; IT, immune tolerant; PAGA, partition-based graph abstraction; Treg, regulatory T-cell; UMAP, uniform manifold approximation and projection.
Figure 4
Figure 4
Multicolour IHC staining of Treg and Tex cells in the liver. (A) CSOmap analysis showing the interaction between CD8+ T-cell and CD4+ T-cell subsets. (B) Multicolour IHC staining in the liver across HC, IT, IA and AR groups. One representative image for each group is shown. White dotted arrows indicate Tex cells, white solid arrows indicated Tregs, yellow solid arrows indicated CD4 +PD1+cells. scale bar, 50 µm. (C) Box plots showing the contributions of indicated L-R pairs to interaction affinity between Tex and Treg in IT and IA stages. one-sided unpaired Wilcoxon test. (D) Bubble heatmap showing the selected L-R pairs between Treg and Tex cells. AR, acute recovery; CR, chronic resolved; CSOmap, cellular spatial organisation mapper; HC, healthy control; IA, immune active; IHC, immunohistochemistry; IT, immune tolerant; L-R, ligand–receptor; Tex, exhausted CD8+ T; Treg, regulatory T-cell.
Figure 5
Figure 5
Immunological features of myeloid cell subsets and interaction with T cells. (A) UMAP plots of myeloid cell subsets. (B) UMAP plots of myeloid cell subsets showing tissue distribution. (C) Tissue prevalence of myeloid cell subsets estimated by the Ro/e score. (D) UMAP plots of myeloid cell subsets showing stage distribution. (E) Box plots showing the proportions of DC subsets in liver CD45+ cells across stages. One-sided unpaired Wilcoxon test. (F) Box plots showing the proportions of macrophage subsets in liver CD45+ cells across stages. One-sided unpaired Wilcoxon test. (G) Dot plots of macrophages defined by Kupffer score and MoMF score. (H) Violin plots showing the functional scores (phagocytosis, proinflammatory, regulation of T-cell activation) of macrophage subsets across stages. One-sided unpaired Wilcoxon test. (I) CSOmap analysis showing the interaction between macrophage and T-cell subsets. (J) Bubble heatmap showing the selected ligand-receptor pairs between FCGR3A+ macrophage and Treg or Tex cells. AR, acute recovery; CR, chronic resolved; CSOmap, cellular spatial organisation mapper; DC, dendritic cell; HC, healthy control; IA, immune active; IT, immune tolerant; Tex, exhausted CD8+ T; Treg, regulatory T-cell; UMAP, uniform manifold approximation and projection.
Figure 6
Figure 6
Multicolour IHC staining of Tex cells and macrophages in the liver across IT, IA and AR groups. Multicolour IHC staining in the liver of HBV-infected patients. One representative image for each group is shown. Scale bar, 50 µm. AR, acute recovery; IA, immune active; IHC, immunohistochemistry; IT, immune tolerant; Tex, exhausted CD8+ T.
Figure 7
Figure 7
Associations between intrahepatic immune features and clinical parameters in HBV-infected patients. (A) Correlations of the compositions of cell subsets in liver CD45+ cells with ALT levels in HBV-infected patients. (B) Correlations of the compositions of cell subsets in liver CD45+ cells with histological grading of liver biopsies in HBV-infected patients. (C) Correlations of the compositions of cell subsets in liver CD45+ cells with serum HBsAg levels in HBV-infected patients. (D) Correlations of immune subsets between blood and liver. (E) Violin plots showing the expression levels of indicated genes in each CD8+ T-cell subset. (F) Dot plots showing the frequencies of CX3CR1+GNLY+ Temra or Tcm cells in CD8+ T cells from blood across stages. One-sided unpaired Wilcoxon test. ALT, alanine aminotransferase; AR, acute recovery; CR, chronic resolved; HbsAg, HBV surface antigen; HC, healthy control; IA, immune active; IT, immune tolerant; PBMC, peripheral blood mononuclear cell; Tcm, central memory T; Temra, recently activated effector memory or effector T.

References

    1. Seto W-K, Lo Y-R, Pawlotsky J-M, et al. . Chronic hepatitis B virus infection. The Lancet 2018;392:2313–24. 10.1016/S0140-6736(18)31865-8 - DOI - PubMed
    1. Thomas DL. Global elimination of chronic hepatitis. N Engl J Med 2019;380:2041–50. 10.1056/NEJMra1810477 - DOI - PubMed
    1. Gehring AJ, Protzer U. Targeting innate and adaptive immune responses to cure chronic HBV infection. Gastroenterology 2019;156:325–37. 10.1053/j.gastro.2018.10.032 - DOI - PubMed
    1. Wang Fu‐Sheng, Fan Jian‐Gao, Zhang Z, Wang FS, Fan JG, et al. . The global burden of liver disease: the major impact of China. Hepatology 2014;60:2099–108. 10.1002/hep.27406 - DOI - PMC - PubMed
    1. Zhang Z, Zhang J-Y, Wang L-F, et al. . Immunopathogenesis and prognostic immune markers of chronic hepatitis B virus infection. J Gastroenterol Hepatol 2012;27:223–30. 10.1111/j.1440-1746.2011.06940.x - DOI - PubMed

Publication types

Substances