. 2022 Mar 31;13(1):1709.
doi: 10.1038/s41467-022-29332-2.

Effects of cryo-EM cooling on structural ensembles

Affiliations

Effects of cryo-EM cooling on structural ensembles

Lars V Bock et al. Nat Commun. .

Abstract

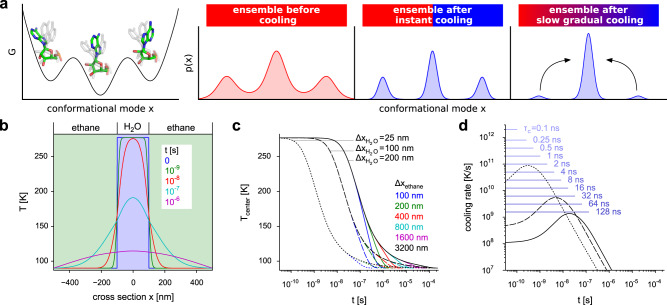
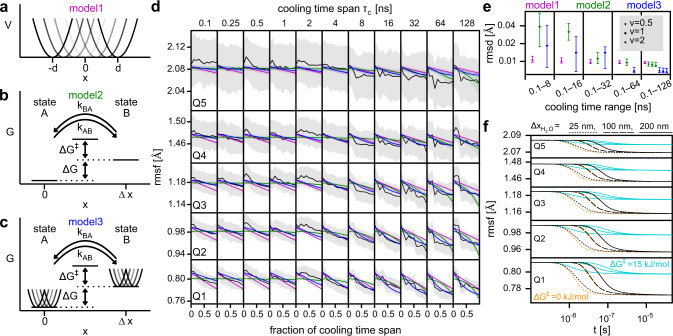
Structure determination by cryo electron microscopy (cryo-EM) provides information on structural heterogeneity and ensembles at atomic resolution. To obtain cryo-EM images of macromolecules, the samples are first rapidly cooled down to cryogenic temperatures. To what extent the structural ensemble is perturbed during cooling is currently unknown. Here, to quantify the effects of cooling, we combined continuum model calculations of the temperature drop, molecular dynamics simulations of a ribosome complex before and during cooling with kinetic models. Our results suggest that three effects markedly contribute to the narrowing of the structural ensembles: thermal contraction, reduced thermal motion within local potential wells, and the equilibration into lower free-energy conformations by overcoming separating free-energy barriers. During cooling, barrier heights below 10 kJ/mol were found to be overcome, which is expected to reduce B-factors in ensembles imaged by cryo-EM. Our approach now enables the quantification of the heterogeneity of room-temperature ensembles from cryo-EM structures.


Conflict of interest statement

The authors declare no competing interests.

Figures

Fig. 1
Fig. 1. Effect of cooling on structural ensembles and estimated temperature drop during plunge-freezing.
a Schematic of a free-energy landscape along a conformational mode (left) and probability densities of structural ensembles (from left to right) before cooling, after instant cooling, and after slow cooling. b Temperature drop during plunge-freezing of a water layer embedded in ethane. Solution of the heat equation for a layer of water (thickness ΔxH2O = 200 nm) surrounded by two layers of ethane (thickness Δxethane = 400 nm, each). The temperature profile T is shown for different times t. Temperatures at the left and right borders are kept at 90 K. c The temperature Tcenter at x = 0 nm is shown as function of time t for different thicknesses of water and ethane layers. d The cooling rate at x = 0 nm is shown as function of t for different water-layer thicknesses and for Δxethane = 3200 nm. Cooling rates for linear temperature decreases with different cooling time spans τc are shown as blue lines.
Fig. 2
Fig. 2. Effects of different cooling rates in T-quench MD simulations.
a Schematic of T-quench simulation protocol. From a trajectory of the ribosome ⋅ EF-Tu complex at T = 277.15 K, 41 snapshots were extracted (1000–3000 ns, every 50 ns). From these snapshots, T-quench simulations of different lengths (cooling time span τc 0.1 ns to 128 ns) were started with linearly decreasing temperature from 277.15 K to 77 K. b Histograms of the root mean square fluctuations (rmsf) of the heavy atoms of the ribosome ⋅ EF-Tu complex obtained from ensembles of 41 snapshots. The histogram for the ensemble before cooling is shown (light red area). Red horizontal lines show the 6-quantiles (Q1–Q5). For each cooling time span τc, the rmsf histogram of the ensemble of the final snapshots of the 41 cooling simulations is shown (light blue area) with 6-quantiles (horizontal blue lines). c Rmsf quantiles are shown as a function of the simulation time before (mean value: cyan line, standard deviation: light cyan area) and after rescaling the conformations (black line, gray area).
Fig. 3
Fig. 3. Models of cooling behavior.
Schematics of thermodynamic model1 with uniformly distributed harmonic potentials (a), kinetic two-state model2 (b), and combined model3 (c). d Comparison of the time dependence of the rmsf quantiles obtained from T-quench simulations after rescaling (black lines, compare Fig. 2c) with those obtained from the models (magenta, green, and blue lines). Standard deviations from simulations and the models are shown as gray and colored areas, respectively. e For each model, the root mean square deviation (rmsd) of the predicted rmsf values from the rmsf values obtained from the T-quench simulations (d, black lines) is shown. Rmsf values were obtained from 41 simulations for each cooling time span. To obtain model parameters, the T-quench rmsf values for different ranges of cooling time spans were used (0.1–8 ns, 0.1–16 ns, … ). The symbols denote the mean values and the vertical lines correspond to the 95% confidence intervals obtained from the parameter distributions. f Rmsf decrease during plunge freezing as a function of time for the quantiles estimated from combining model3 with temperature drops (Fig. 1c) for different water-layer thicknesses (ΔxH2O).
Fig. 4
Fig. 4. B-factor dependency on barrier height and temperature.
a Difference between B-factors at the temperatures before cooling (Th) and after cooling (Tc) calculated from model3 as a function of barrier height ΔG for different water-layer thicknesses (ΔxH2O). The ΔG values at which the B-factor is reduced halfway between the reduction at 0 kJ/mol and 20 kJ/mol is indicated in red. Lines denote expected values and gray areas correspond to the 95% confidence intervals (obtained from bootstrapping the parameter distributions). b B-factors as a function of temperature calculated from model3 under equilibrium conditions (upper panel; expected values: blue lines, 95% confidence interval: light blue area). The B-factors of the harmonic potentials are shown in cyan. B-factors obtained from X-ray crystallography at different temperatures (black dots) for proteins thaumatin (middle panel) and ribonuclease-A (lower panel). B-factors calculated from model3 applied to the experimental B-factors (blue and cyan).

Similar articles

Cited by

References

    1. Bai X-c, McMullan G, Scheres SH. How cryo-EM is revolutionizing structural biology. Trends Biochem. Sci. 2015;40:49–57. - PubMed
    1. Wu S, Armache JP, Cheng Y. Single-particle cryo-EM data acquisition by using direct electron detection camera. Microscopy. 2016;65:35–41. - PMC - PubMed
    1. Cheng Y. Single-particle cryo-EM-How did it get here and where will it go. Science. 2018;361:876–880. - PMC - PubMed
    1. Yip KM, Fischer N, Paknia E, Chari A, Stark H. Atomic-resolution protein structure determination by cryo-EM. Nature. 2020;587:157–161. - PubMed
    1. Nakane T, et al. Single-particle cryo-EM at atomic resolution. Nature. 2020;587:152–156. - PMC - PubMed

Publication types

Substances