. 2022 Mar 31;13(1):1753.
doi: 10.1038/s41467-022-29184-w.

Fibre optic distributed acoustic sensing of volcanic events

Affiliations

Fibre optic distributed acoustic sensing of volcanic events

Philippe Jousset et al. Nat Commun. .

Abstract

Understanding physical processes prior to and during volcanic eruptions has improved significantly in recent years. However, uncertainties about subsurface structures distorting observed signals and undetected processes within the volcano prevent volcanologists to infer subtle triggering mechanisms of volcanic phenomena. Here, we demonstrate that distributed acoustic sensing (DAS) with optical fibres allows us to identify volcanic events remotely and image hidden near-surface volcanic structural features. We detect and characterize strain signals associated with explosions and locate their origin using a 2D-template matching between picked and theoretical wave arrival times. We find evidence for non-linear grain interactions in a scoria layer of spatially variable thickness. We demonstrate that wavefield separation allows us to incrementally investigate the ground response to various excitation mechanisms. We identify very small volcanic events, which we relate to fluid migration and degassing. Those results provide the basis for improved volcano monitoring and hazard assessment using DAS.


Conflict of interest statement

The authors declare no competing interests.

Figures
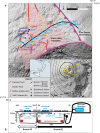
Fig. 1
Fig. 1. Fibre optic cable, seismometer and infrasound sensor locations and deployment near Etna volcano summit (Piano delle Concazze) and Valle del Bove on the digital elevation model.
a The iDAS interrogator (Method: DAS, optical fibre and conventional sensors), set up at Pizzi Deneri Observatory (light blue square), is connected to the fibre indicated by the black (“branch B1”) and the white (“branch B2”) lines, respectively. b Sketch of the cable deployment. From the interrogator (inside and around the observatory, channel 1–50), the cable is buried in compacted material (channels 50 until 200) and then in lose scoria deposits (transparent reddish area in a.), at about 15–25 cm depth (deep section) along B1 with channels 1 to 410, then the cable turns (still within the deep section) along B2 with channels 411 until 520, then the cable has a shallow section (under a few cm of scoria and lying directly above the deep cable), from channels 521 until 630 (with same geographic location as deep channels 520 until 411, respectively), and finally, the shallow cable turns along B1 (still above the deep cable) from channels 631 until 715 (with same geographic location as deep channels 410 until 326). Insets: Local and regional contexts. Summit craters’ locations: NSEC (New South-East Crater); SEC (South East Crater); BN (Bocca Nuova); VOR (Voragine); NEC (North-East Crater). Red square: Thermal camera location: EMOT. The yellow box indicates the location of the main map.
Fig. 2
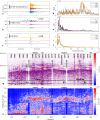
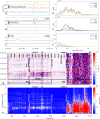
Fig. 2. Explosion at Etna New South-East Crater (NSEC), September 5, 2018, at 10:54:11.
a Strain rate from distributed acoustic sensing (DAS) records at channels 484 (blue), 494 (red) and 505 (yellow), corresponding to positions of infrasound sensors in (c). Fibre channel position accuracy ±3 m (Method: DAS interrogator, fibre optic cable and conventional sensor network characteristics). b. Velocity seismograms from broadband seismometer CAZG (Supplementary Table 3), near DAS channel 494. c Pressure records from infrasound sensors CARB-IF1, 2, 3. d Strain rate (a) spectra. e Ground velocity (b) spectra. f Pressure (c) spectra. g Strain rate record at the 710 DAS channels along the 1.3 km fibre around the explosion time. B1 and B2 are the two geographically distinct branches in Fig. 1. FZ: fault zone (~50 m width), at channels 315–340 (deep cable) and channels >700 (shallow cable). h Strain rate-frequency distribution along the cable. Note higher strain rate amplitudes at low frequencies 1–10 Hz (seismic signal) for branch B1 and at high frequencies 18–21 Hz (infrasound induced signal) for both branches.
Fig. 3
Fig. 3. Explosion at Etna New South-East Crater (NSEC), September 5, 2018, at 14:04:35.
a Strain rate from distributed acoustic sensing (DAS) records at channels 484 (blue), 494 (red) and 505 (yellow), corresponding to positions of infrasound sensors in (c). Fibre channel position accuracy ±3 m (Method: DAS interrogator, fibre optic cable and conventional sensor network characteristics). b Velocity seismograms from broadband seismometer CAZG (Supplementary Table 3), near DAS channel 494. c Pressure records from infrasound sensors CARB-IF1, 2, 3. d Strain rate (a) spectra. e Ground velocity (b) spectra. f Pressure (c) spectra. g Strain rate record at the 710 DAS channels along the 1.3 km fibre around the explosion time. B1 and B2 are the two geographically distinct branches in Fig. 1. FZ: fault zone (~50 m width), at channels 315–340 (deep cable) and channels >700 (shallow cable). h Strain rate-frequency distribution along the cable.
Fig. 4
Fig. 4. Coherent wavefield enhancement and separation for volcanic explosion record shown in Fig. 2.
a Stage 1: Separation of seismic and infrasound wavefield. Left: Original DAS records. Centre: Estimated contribution from seismic wave propagation. Right: Estimated contribution from infrasound induced wave propagation. The black frame indicates the closeup displayed in the top right corner of each image. The grey frame indicates the zoom-in of (b). b Stage 2: Separation of forward and backward propagating wavefield: (Left) Closeup of the DAS-infrasound wavefield (indicated by the grey frame in a). (Centre) coherence-enhanced infrasound wavefield. (Right) backpropagating energy stemming from a structure crossing the cable near channel 490, whose reflection properties (e.g., amplitude variations) can be more accurately delineated in the separated domain. c The observed strain rate arrival times are compared with theoretical arrival times for all craters, assuming an acoustic wave velocity of 340 ms−1 in the air (coloured lines for the craters; Lines for NEC, VOR and BN are hardly distinguishable as they nearly overlap). This 2D template matching is consistent with an explosion at NSEC (as verified in Supplementary Movie 1). White circles indicate the observed arrival times of the infrasound high frequency signal picked from the geophone records (Supplementary Fig. 9).
Fig. 5
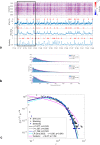
Fig. 5. Continuous detection of weak volcanic events.
a Typical example of 30 min strain rate data (31/08/2018 17:15:00–17:45:00, filtered 0.1–5 Hz). 3 lower panels: detection results (red dots represent event detection times) based on (top) Short-term average (STA)–long-term average (LTA) with STA = 0.7 s, LTA = 10 s and threshold = 3; (middle) stacking (summation of trace amplitude); (bottom) local similarity algorithm. The black rectangle indicates the extend of Fig. 6a. b Histograms of inter-event times between detected events for the whole acquisition period (31/08/2018 until 16/09/2018, see all detections in Supplementary Fig. 2). For each detection method, the corresponding gamma distribution (pink) and exponential models (black) are given, with their parameters specified in the legend (top) STA-LTA (R ~ 30.9 events/hour); (middle) stacking (R ~ 28.3 events/hour); (bottom) local similarity (R ~ 35.9 events/hour). c Distribution of observed inter-event time Δt of DAS detected events after rescaling by the average event rate R, i.e., τ=R Δt. Continuous lines represent fits of data to the theoretical universal gamma distribution (Method: Probability density functions of inter-event times), and are compared with gamma distributions for LP events at Etna and tectonic events in Southern California.
Fig. 6
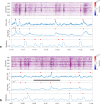
Fig. 6. DAS detection of small transients.
Similar layout as Fig. 5a for few minutes of DAS records, except that strain rate (top panel) is plotted for DAS data filtered 0.1–0.6 Hz to highlight differences between transient patterns, e.g., those detected by the similarity method, i.e., STP events, from those detected by STA/LTA and the stacking method, i.e., DG events. STPs contain mostly low frequencies (1–2 Hz), whereas DG events have also higher frequency content (up to 10 Hz, see Supplementary Figs. 14 and 15). 3 lower panels: detection results (red dots represent event detection times) based on (top) STA-LTA (STA = 0.7 s; LTA = 10 s; threshold = 3); (middle) stacking (summation of trace amplitude); (bottom) local similarity. a Zoom (31/08/2018 at ~17:17) of Fig. 5a. b 12/09/2018 at ~11:00, during which a video was taken from North East Crater (NEC) rim (Supplementary Movie 3). Black line: time span of the video. Note that this event is detected with the STA-LTA and stacking detection methods, but not by the similarity method.
Fig. 7
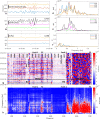
Fig. 7. Detailed records within the tremor of a degassing (DG) event.
Records are filtered in the range 0.1–0.6 Hz. Note that DG event records have higher frequencies, which are filtered out in this figure. Unfiltered signals are shown in Supplementary Fig. 14. DG events do not exhibit any infrasound signal in our records. a Strain rate from distributed acoustic sensing (DAS) records at channels 484 (blue), 494 (red), and 505 (yellow), corresponding to positions of infrasound sensors in (c). Fibre channel position accuracy ±3 m (Method: DAS interrogator, fibre optic cable and conventional sensor network characteristics). b Velocity seismograms from broadband seismometer CAZG (Supplementary Table 3), near DAS channel 494. c Pressure records from infrasound sensors CARB-IF1, 2, 3. d Strain rate (a) spectra. e Ground velocity (b) spectra. f Pressure (c) spectra. g Strain rate record at the 710 DAS channels along the 1.3 km fibre. B1 and B2 are the two geographically distinct branches in Fig. 1. FZ: fault zone (~50 m width), at channels 315–340 (deep cable) and channels >700 (shallow cable). h Strain rate-frequency distribution along the cable.
Fig. 8
Fig. 8. Detailed records within the tremor of a Single Tremor Pulse (STP) event.
Similar layout as in Fig. 2. Records are filtered in the range 0.1–0.6 Hz. STP events do not contain higher frequencies. Unfiltered signals are shown in Supplementary Fig. 15. STP events do not exhibit any infrasound signal in our records. a Strain rate from distributed acoustic sensing (DAS) records at channels 484 (blue), 494 (red) and 505 (yellow), corresponding to positions of infrasound sensors in (c). Fibre channel position accuracy ±3 m (Method: DAS interrogator, fibre optic cable and conventional sensor network characteristics). b Velocity seismograms from broadband seismometer CAZG (Supplementary Table 3), near DAS channel 494. c Pressure records from infrasound sensors CARB-IF1, 2, 3. d Strain rate (a) spectra. e Ground velocity (b) spectra. f Pressure (c) spectra. g Strain rate record at the 710 DAS channels along the 1.3 km fibre. B1 and B2 are the two geographically distinct branches in Fig. 1. FZ: fault zone (~50 m width), at channels 315–340 (deep cable) and channels >700 (shallow cable). h Strain rate-frequency distribution along the cable.

References

    1. Brown SK, et al. Volcanic fatalities database: analysis of volcanic threat with distance and victim classification. Appl. Volcanol. 2017;6:15.
    1. Surono, Jousset P, et al. The 2010 explosive eruption of Java’s Merapi volcano—a “100-year” event. J. Volcanol. Geotherm. Res. 2012;241–242:121–145.
    1. Chouet B, Matoza RS. A multi-decadal view of seismic methods for detecting precursors of magma movement and eruption. J. Volcanol. Geotherm. Res. 2013;252:108–175.
    1. McNutt, S. R. & Roman, D. C. In The Encyclopedia of Volcanoes, (ed. Sigurdsson H.), 2nd Edn. (Academic Press, 2015).
    1. Neuberg J, Lucket R, Ripepe M, Braun T. Highlight from a seismic broadband array on Stromboli. Geophys. Res. Lett. 1994;21:9.