

Updating global urbanization projections under the Shared Socioeconomic Pathways
- PMID: 35361772
- PMCID: PMC8971473
- DOI: 10.1038/s41597-022-01209-5
Updating global urbanization projections under the Shared Socioeconomic Pathways
Abstract
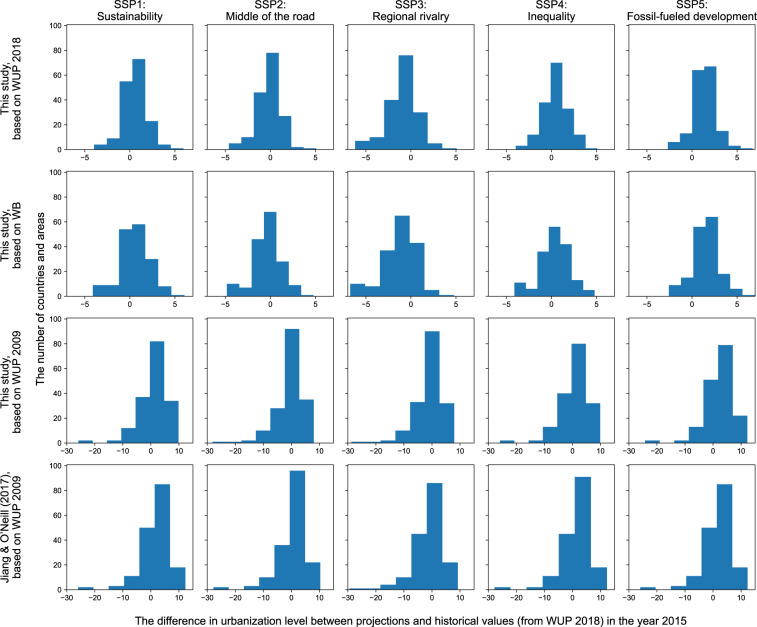
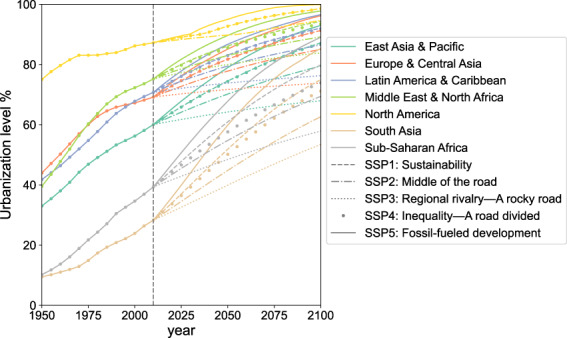
Urbanization level is an important indicator of socioeconomic development, and projecting its dynamics is fundamental for studies related to global socioeconomic and climate change. This paper aims to update the projections of global urbanization from 2015 to 2100 under the Shared Socioeconomic Pathways by using the logistic fitting model and iteratively identifying reference countries. Based on historical urbanization level database from the World Urbanization Prospects, projected urbanization levels and uncertainties are provided for 204 countries and areas every five years. The 2010-2100 year-by-year projected urbanization levels and uncertainties based on the annual historical data from the World Bank (WB) for 188 of countries and areas are also provided. The projections based on the two datasets were compared and the latter were validated using the historical values of the WB for the years 2010-2018. The updated dataset of urbanization level is relevant for understanding future socioeconomic development, its implications for climate change and policy planning.
© 2022. The Author(s).
Conflict of interest statement
The authors declare that they have no known competing interests or personal relationships that could have appeared to influence the work reported in this paper.
Figures


References
-
- UNPD (United Nations, Department of Economic and Social Affairs, Population Division). World Urbanization Prospects: The 2018 Revision (ST/ESA/SER.A/420). https://population.un.org/wup/Publications/Files/WUP2018-Report.pdf (New York: United Nations, 2019).
-
- Montgomery, M. R., Stren, R., Cohen, B. & Reed, H. E. Cities transformed: demographic change and its implications in the developing world. (National Academies Press, 2003).
-
- Cohen, B. Urbanization in developing countries: Current trends, future projections, and key challenges for sustainability. Technol Soc. 18 (2006).
-
- Davis JC, Henderson JV. Evidence on the political economy of the urbanization process. J. Urban Econ. 2003;53:98–125. doi: 10.1016/S0094-1190(02)00504-1. - DOI
Publication types
Grants and funding
LinkOut - more resources
Full Text Sources
