. 2022 Mar 31;9(1):135.
doi: 10.1038/s41597-022-01253-1.

High resolution optical mapping of cardiac electrophysiology in pre-clinical models

Affiliations

High resolution optical mapping of cardiac electrophysiology in pre-clinical models

Christopher O'Shea et al. Sci Data. .

Erratum in

Abstract

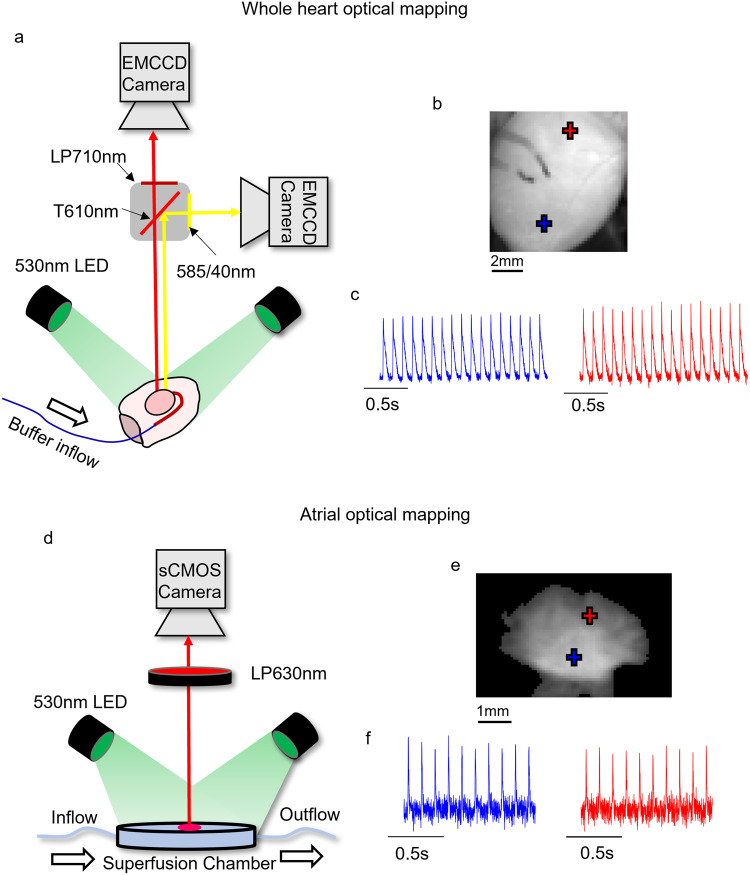
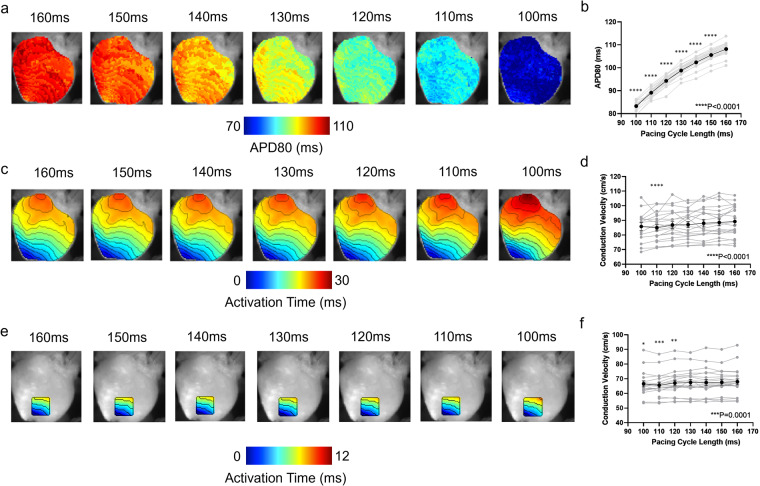
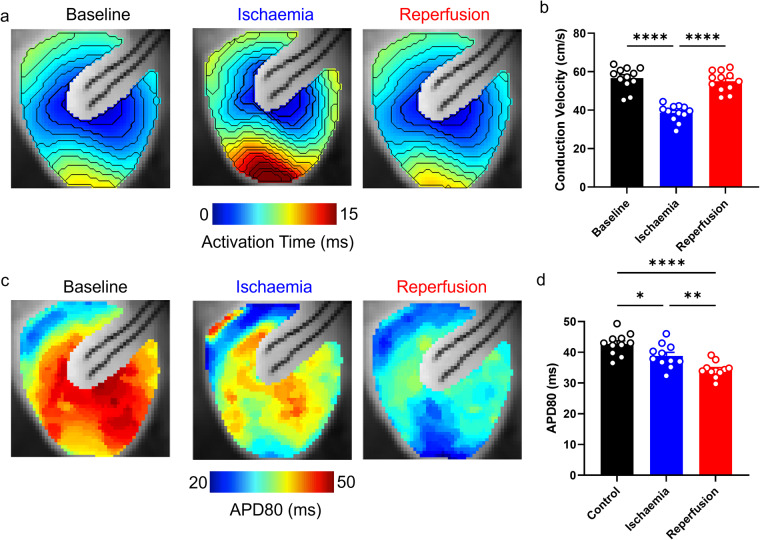
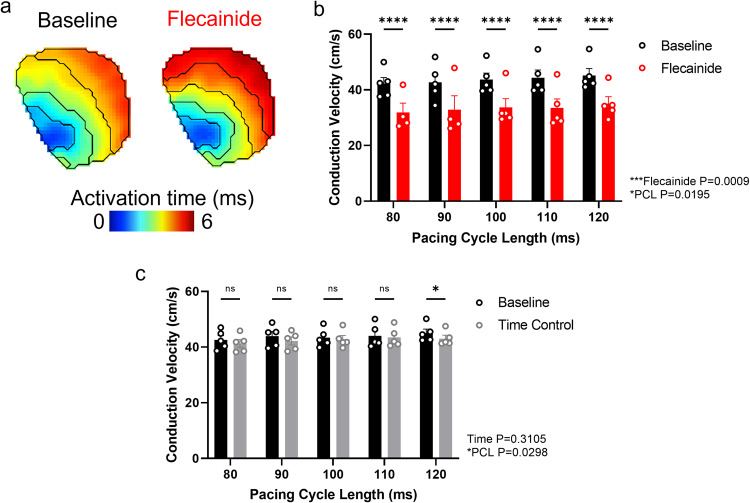
Optical mapping of animal models is a widely used technique in pre-clinical cardiac research. It has several advantages over other methods, including higher spatial resolution, contactless recording and direct visualisation of action potentials and calcium transients. Optical mapping enables simultaneous study of action potential and calcium transient morphology, conduction dynamics, regional heterogeneity, restitution and arrhythmogenesis. In this dataset, we have optically mapped Langendorff perfused isolated whole hearts (mouse and guinea pig) and superfused isolated atria (mouse). Raw datasets (consisting of over 400 files) can be combined with open-source software for processing and analysis. We have generated a comprehensive post-processed dataset characterising the baseline cardiac electrophysiology in these widely used pre-clinical models. This dataset also provides reference information detailing the effect of heart rate, clinically used anti-arrhythmic drugs, ischaemia-reperfusion and sympathetic nervous stimulation on cardiac electrophysiology. The effects of these interventions can be studied in a global or regional manner, enabling new insights into the prevention and initiation of arrhythmia.


Conflict of interest statement

The authors declare no competing interests.

Figures

Fig. 1
Fig. 1
Optical mapping experimental setups. (a) Schematic diagram of optical mapping setup used for guinea pig and mouse whole heart optical mapping data in this dataset. (b) Fluorescent image of mouse whole heart loaded with di-4-anepps. (c) Example signals from marked locations collected from di-4-anepps loaded heart. (d) Schematic diagram of optical mapping setup used for mouse atrial optical mapping data in this dataset. (e) Fluorescent image of mouse atria loaded with di-4-anepps. (f) Example signals from marked locations collected from di-4-anepps loaded atria. LP = Long pass, T = Transmission, EMCCD = Electron multiplied charged coupled device, sCMOS = Scientific complementary metal oxide semiconductor.
Fig. 2
Fig. 2
Restitution dynamics of guinea pig heart. (a) Example action potential duration 80 (APD80) images from guinea pig whole heart at decreasing pacing cycle lengths (PCL). (b) Grouped data of APD80 as a function of PCL. (c) Example activation images from guinea pig whole heart at decreasing PCLs. (d) Grouped data of conduction velocity as a function of decreasing PCLs. (e) Example activation images from guinea pig whole heart at decreasing PCLs with analysis area restricted to an area at the apex of the heart. (f) Grouped data of conduction velocity as a function of decreasing PCLs with restricted analysis area. n = 20. One-way ANOVA. ***P < 0.001, ****P < 0.0001 for overall interaction of APD80/CV with PCL, shown above x-axis. Multiple comparisons are for each PCL against the slowest PCL (160 ms). Significance (*P < 0.05, **P < 0.01, ***P < 0.001, ****P < 0.0001) are shown above respective PCL where a significant difference versus 160 ms pacing was identified.
Fig. 3
Fig. 3
Effects of ibutilide and sympathetic nervous stimulation (SNS) in guinea pig heart. (a) Example optical action potential recordings (i) and action potential duration 80 (APD80) maps (ii) in control conditions and following ibutilide treatment. (b) Grouped data of APD80 (i) and APD80 heterogeneity (ii) before and after ibutilide treatment, both without (black) and with (blue) SNS. (c) Grouped data of conduction velocity (i) and conduction velocity heterogeneity (ii) before and after ibutilide treatment, both without (black) and with (blue) SNS. n = 5 for control, 4 for SNS. Two-way ANOVA. *P < 0.05, **P < 0.01. Multiple comparisons are made between all Baseline and ibutilide treated groups, and between control and SNS. Pacing cycle length = 160 ms.
Fig. 4
Fig. 4
Ramp protocol induced arrhythmia in guinea pig whole hearts. (a) Example trace from guinea pig heart during ramp pacing protocol (initial pacing cycle length of 170 ms, which is decreased by 10 m every 20 stimuli until onset of fibrillation) inducing alternans and ventricular fibrillation (VF). (b) Example dominant frequency (DF) maps during physiological pacing and VF. (c) Example optical wave similarity (OWS, i) and action potential duration 80 alternans (ΔAPD80, ii) maps at decreasing PCLs. Note: blue areas in alternans maps denote areas where ΔAPD80 could not be calculated. (d) Grouped data showing OWS as a function of PCL and during VF. (e) Grouped data showing ΔAPD80 as a function of PCL. n = 6. One-way ANOVA. ****P < 0.0001 for overall interaction of OWS/ΔAPD80 with PCL, shown above x-axis. Multiple comparisons are for each PCL against the slowest PCL (160 ms). Significance (*P < 0.05, **P < 0.01) are shown above respective PCL were a significant difference versus 160 ms pacing was identified.
Fig. 5
Fig. 5
Flecainide and carbenoxolone induced conduction slowing in mouse whole hearts. (a) Example activation maps from mouse whole heart at increasing concentrations of flecainide. (b) Grouped conduction velocity data from mouse whole heart at increasing concentrations of flecainide. (c) Example activation maps from mouse whole heart at increasing concentrations of carbenoxolone. (d) Grouped conduction velocity data from mouse whole heart at increasing concentrations of carbenoxolone. n = 6 for both experiments. One-way ANOVA, **P < 0.01, ***P < 0.001, ****P < 0.0001 against 0 µM flecainide/carbenoxolone respectively. Pacing cycle length = 110 ms.
Fig. 6
Fig. 6
Ischaemia induced conduction slowing and action potential shortening in mouse whole hearts. (a) Example activation maps from mouse whole heart in before (black), during (blue, ischaemia) and after (red, reperfusion) low-flow ischaemia. (b) Grouped conduction velocity data from mouse whole heart in control, ischaemia and reperfusion conditions. (c) Example action potential duration 80 (APD80) maps from mouse whole heart at baseline (black), during (blue, ischaemia) and after (red, reperfusion) low-flow ischaemia. (d) Grouped APD80 data from mouse whole heart in control, ischaemia, and reperfusion conditions. n = 12. One-way ANOVA, *P < 0.05, **P < 0.01. ****P < 0.0001. Multiple comparisons are made between all groups (Baseline, Ischaemia, Reperfusion). Pacing cycle length = 110 ms.
Fig. 7
Fig. 7
Flecainide-induced conduction slowing in mouse left atria. (a) Example activation maps at baseline and following 1 µM flecainide treatment of mouse left atria. (b) Group data of conduction velocity before and following 1 µM flecainide treatment of mouse left atria at a range of pacing cycle lengths (PCLs). c) Grouped data of conduction velocity at baseline and 20 minutes later from mouse left atria at a range of PCLs. n = 5. Two-way ANOVA, *P < 0.05, ***P < 0.001, ****P < 0.00001 between baseline and flecainide/time control respectively. Overall interaction of CV with PCL and flecainide/time is shown to the bottom right of the figures *P < 0.05, ***P < 0.001.

Similar articles

Cited by

References

    1. Roth GA, et al. Global, Regional, and National Burden of Cardiovascular Diseases for 10 Causes, 1990 to 2015. J. Am. Coll. Cardiol. 2017;70:1–25. doi: 10.1016/j.jacc.2017.04.052. - DOI - PMC - PubMed
    1. Atienza F, Martins RP, Jalife J. Translational research in atrial fibrillation: A quest for mechanistically based diagnosis and therapy. Circ. Arrhythmia Electrophysiol. 2012;5:1207–1215. doi: 10.1161/CIRCEP.111.970335. - DOI - PMC - PubMed
    1. Salama G, Morad M. Merocyanine 540 as an optical probe of transmembrane electrical activity in the heart. Science (80-.). 1976;191:485–487. doi: 10.1126/science.191.4226.485. - DOI - PubMed
    1. Berenfeld O, Efimov I. Optical Mapping. Cardiac Electrophysiology Clinics. 2019;11:495–510. doi: 10.1016/j.ccep.2019.04.004. - DOI - PubMed
    1. O’Shea C, et al. Cardiac optical mapping – State-of-the-art and future challenges. Int. J. Biochem. Cell Biol. 2020;126:105804. doi: 10.1016/j.biocel.2020.105804. - DOI - PMC - PubMed