. 2022 Mar 31;13(1):1700.
doi: 10.1038/s41467-022-29401-6.

USP8 inhibition reshapes an inflamed tumor microenvironment that potentiates the immunotherapy

Affiliations

USP8 inhibition reshapes an inflamed tumor microenvironment that potentiates the immunotherapy

Wenjun Xiong et al. Nat Commun. .

Abstract

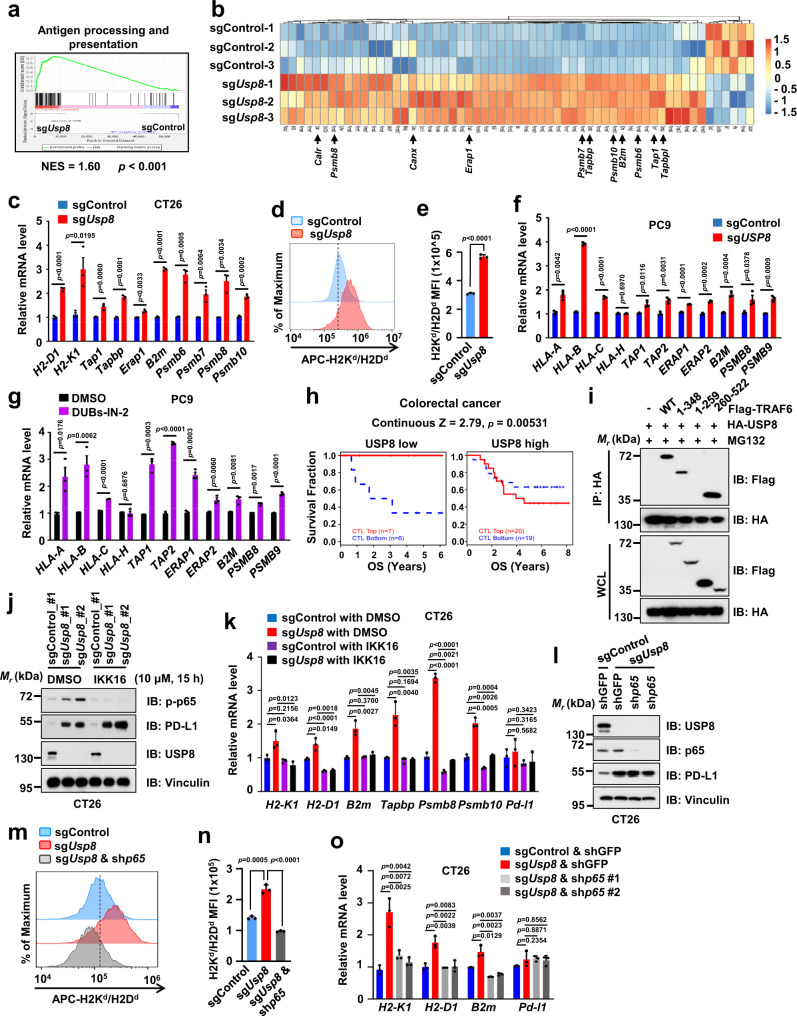
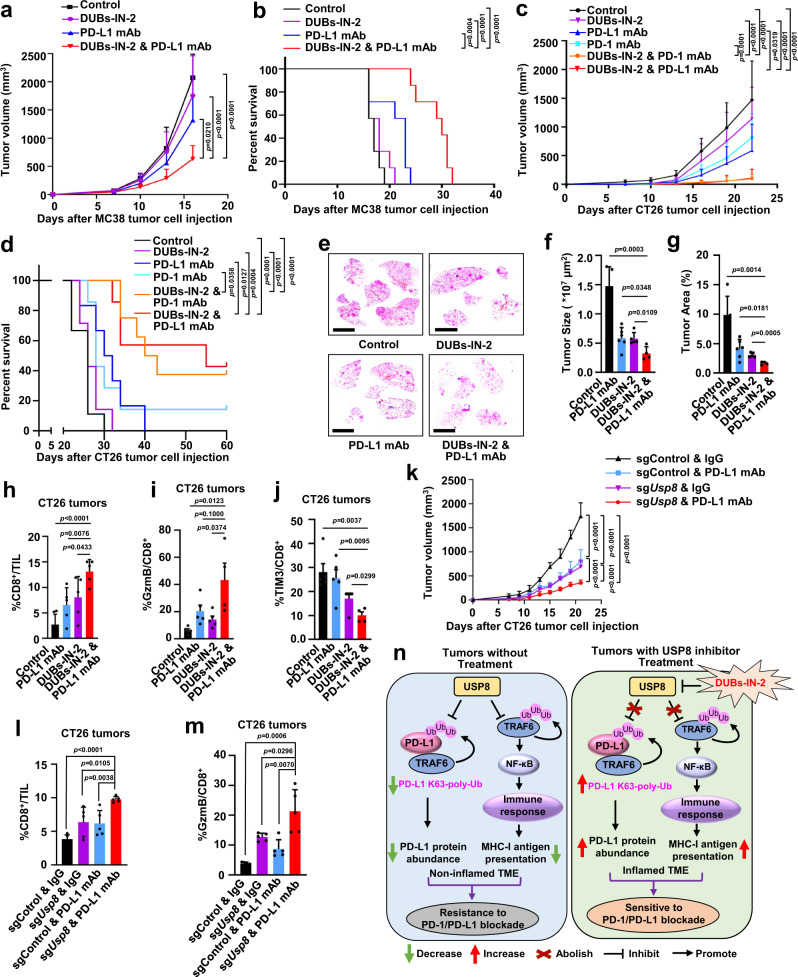
Anti-PD-1/PD-L1 immunotherapy has achieved impressive therapeutic outcomes in patients with multiple cancer types. However, the underlined molecular mechanism(s) for moderate response rate (15-25%) or resistance to PD-1/PD-L1 blockade remains not completely understood. Here, we report that inhibiting the deubiquitinase, USP8, significantly enhances the efficacy of anti-PD-1/PD-L1 immunotherapy through reshaping an inflamed tumor microenvironment (TME). Mechanistically, USP8 inhibition increases PD-L1 protein abundance through elevating the TRAF6-mediated K63-linked ubiquitination of PD-L1 to antagonize K48-linked ubiquitination and degradation of PD-L1. In addition, USP8 inhibition also triggers innate immune response and MHC-I expression largely through activating the NF-κB signaling. Based on these mechanisms, USP8 inhibitor combination with PD-1/PD-L1 blockade significantly activates the infiltrated CD8+ T cells to suppress tumor growth and improves the survival benefit in several murine tumor models. Thus, our study reveals a potential combined therapeutic strategy to utilize a USP8 inhibitor and PD-1/PD-L1 blockade for enhancing anti-tumor efficacy.


Conflict of interest statement

G.J.F. has patents/pending royalties on the PD-1/PD-L1 pathway from Roche, Merck MSD, Bristol-Myers-Squibb, Merck KGA, Boehringer-Ingelheim, AstraZeneca, Dako, Leica, Mayo Clinic, and Novartis. G.J.F. has served on advisory boards for Roche, Bristol-Myers-Squibb, Xios, Origimed, Triursus, iTeos, NextPoint, IgM, and Jubilant. G.J.F. has equity in Nextpoint, Triursus, Xios, and IgM. W.W. is a co-founder and consultant for the ReKindle Therapeutics. Other authors declare no competing interests.

Figures

Fig. 1
Fig. 1. USP8 inhibition elevates PD-L1 protein abundance in cancer cells.
a Immunoblot (IB) analysis of whole-cell lysates (WCL) derived from H460 cells treated with indicated inhibitors or dimethyl sulfoxide (DMSO). Three independent biological repeats were conducted. bd IB analysis of WCL derived from H460 cells treated with DUBs-IN-2 (2 µM and 4 µM) for 6 h (b). Cell surface PD-L1 was analyzed after DUBs-IN-2 (2 µM) treatment for 6 h (c, d). eg IB analysis of WCL derived from PC9 cells treated with DUBs-IN-2 (2 µM and 4 µM) for 24 h (e). Cell surface PD-L1 was analyzed after 24 h for indicated treatment (f, g). hk IB analysis of WCL derived from CT26 cells infected with indicated lentiviral sgControl or sgUsp8 (h). Cell surface PD-L1 on indicated CT26 cells was analyzed (i, j). PD-L1 mRNAs were analyzed using reverse transcription quantitative PCR (RT-qPCR) (k). l, m IB analysis of WCL derived from sgControl- or sgUsp8-treated CT26 cells treated with 400 µg/ml cycloheximide (CHX) at indicated time points (l). PD-L1 band intensity was quantified by ImageJ, which was normalized to vinculin and then to the t = 0 time point (m). np IB analysis of WCL derived from shGFP- or shUsp8-treated B16-F10 cells, which were selected with puromycin (1 μg/ml) for generating stable cell lines; three independent biological repeats were conducted (n). IB analysis of WCL derived from B16-F10 cells stably infected with indicated lentiviral shRNAs. Cells were treated with 200 µg/ml CHX at indicated time points (o). PD-L1 band intensity was quantified by ImageJ, which was normalized to vinculin and then to the t = 0 time point (p). q Representative images from IHC staining of PD-L1 and USP8 in human lung squamous carcinoma. Scale bar, upper panels: 100 μm; lower panels: 50 μm. n = 63 biologically independent patient samples. For d, g, j, k, m, and p data were presented as mean ± S.D.; n = 3 biologically independent samples; Two-sided t-test. The relevant raw data and uncropped dots are provided as a Source Data file.
Fig. 2
Fig. 2. USP8 specifically interacts with PD-L1 and removes its K63-linked poly-ubiquitination.
a Immunoblot (IB) analysis of whole-cell lysates (WCL) and anti-Flag immunoprecipitates (IPs) derived from 293T cells transfected with indicated constructs. Cells were treated with 10 µM MG132 for 12 h before harvesting. EV: empty vector. b, c IB analysis of WCL and anti-PD-L1 IPs derived from CT26 (b) and PC9 (c) cells. d IB analysis of glutathione S-transferase (GST) pull-down precipitates from 293 T-cell lysates with ectopic expression of HA-PD-L1 incubated with bacterially purified recombinant GST or GST-USP8 protein. e A schematic illustration of USP8 with different domains including the N-terminal amino acid (aa) 1–313, middle region (aa314–714), and C-terminal USP domain (aa715–1118). MIT: microtubule interacting and transport; USP: ubiquitin-specific peptidase. f IB analysis of WCL and anti-Flag IPs derived from 293T cells transfected with indicated constructs. Cells were treated with 10 µM MG132 for 12 h before harvesting. g, h IB analysis of WCL and Ni-NTA pull-down products derived from lysates of 293T cells transfected with the indicated constructs. Cells were treated with 10 µM MG132 for 12 h before harvesting. Ub: ubiquitin. i, j IB analysis of WCL and anti-PD-L1 IPs derived from lysates of CT26 (i) and PC9 (j) cells using indicated antibodies. Cells were treated with 20 µM MG132 for 6 h before harvesting. k IB analysis of WCL and Ni-NTA pull-down products derived from lysates of 293T cells transfected with the indicated constructs. Cells were treated with 10 µM MG132 for 12 h before harvesting. l IB analysis of WCL and anti-PD-L1 IPs derived from lysates of sgControl or sgUsp8 CT26 cells using indicated antibodies. Cells were treated with 20 µM MG132 for 6 h before harvesting. For ad and fl, two independent experiments were conducted. The relevant uncropped dots are provided as a Source Data file.
Fig. 3
Fig. 3. The E3 ligase TRAF6 positively regulates PD-L1 protein abundance through promoting K63-linked ubiquitination of PD-L1.
a Immunoblot (IB) analysis of whole-cell lysates (WCL) derived from 293 T cells co-transfected with indicated constructs. b, c IB analysis of WCL derived from 293 T cells co-transfected with indicated constructs. Cells were treated with 200 µg/ml cycloheximide (CHX) as indicated time points (b). PD-L1 band intensity was quantified by ImageJ, which was normalized to vinculin and then to the t = 0 time point (c). EV: empty vector. dg IB analysis of WCL derived from sgControl or sgTRAF6-treated H460 (d) or CT26 cells (f). PD-L1 mRNAs were analyzed using the RT-qPCR (e, g). h, i Representative images from IHC staining of PD-L1 and TRAF6 in human lung squamous carcinoma (h). Scale bar, upper panels: 300 μm; lower panels: 100 μm. Quantification of PD-L1 and TRAF6 staining intensities were performed by semi-quantitative scoring (i). n = 73, r = 0.3381, p = 0.0034; correlation coefficients were calculated using the Pearson test. Two-sided p-value was given. j IB analysis of WCL and anti-Flag IPs from 293T cells co-transfected with indicated Flag-TRAF constructs. k IB analysis of glutathione S-transferase (GST) pull-down precipitates from 293T cell lysates with ectopic expression of HA-PD-L1 incubated with bacterially purified recombinant GST or GST-TRAF6 protein. l A schematic illustration of TRAF6 protein sequence with different domains or truncated mutants. m IB analysis of WCL and anti-HA IPs from 293T cells co-transfected with indicated constructs. n IB analysis of WCL and Ni-NTA pull-down products derived from lysates of 293T cells co-transfected with indicated constructs. o IB analysis of WCL and Ni-NTA pull-down products derived from lysates of 293T cells co-transfected with indicated constructs. For j, m, n, and o, cells were treated with 10 µM MG132 for 12 h before harvesting. For c, e, and g data were presented as mean ± S.D. n = 3 biologically independent samples. Two-sided t-test. For a, j, k, and mo, two independent experiments were conducted. The relevant raw data and uncropped dots are provided as a Source Data file.
Fig. 4
Fig. 4. USP8 deficiency elevates multiple immune response genes that facilitate anti-tumor immunity.
a Volcano plot showing differential gene expression for RNA-seq results from sgUsp8 versus sgControl CT26 cells. Dots in red represent 473 upregulated genes (log2(FC) > 1 and adjusted p-value < 0.05) and dots in blue represent 514 downregulated genes (log2(FC) < -1 and adjusted p-value < 0.05) in sgUsp8 versus sgControl CT26 cells. Highlighted genes are involved in innate and adaptive immune response pathways. FC: fold-change. Statistical analysis was performed using Wald-test with Benjamini-Hochberg correction. b A dot map showing top 10 terms in Gene Ontology (GO) analysis of differential genes in sgUsp8 versus sgControl CT26 cells. n = 3 biologically independent samples per group. Statistical analysis was performed using modified Fisher’s exact tests. c Heatmap showing differential expression of genes in the Fig. 4b of top 10 terms in GO analysis. d, e RT-qPCR analysis of the indicated genes from sgControl and sgUsp8 CT26 (d) or PC9 (e) cells. Data were presented as mean ± S.D. n = 3 biologically independent samples. Two-sided t-test. The relevant raw data and uncropped dots are provided as a Source Data file.
Fig. 5
Fig. 5. Inhibition of USP8 elevates the antigen presentation pathway largely through activating the TRAF6-NF-κB signaling.
a Gene-set enrichment analysis (GSEA) for MHC-I-dependent antigen processing and presentation pathway genes in sgUsp8 versus sgControl cells. n = 3 biologically independent samples per group. p values are calculated using Kolmogorov–Smirnov tests. NES: normalized enrichment score. b Heatmap showing differential expression of genes in Fig. 5a. c mRNA levels of indicated genes from sgUsp8 or sgControl CT26 cells were analyzed using RT-qPCR. d, e Cell surface H2Kd/H2Dd on sgUsp8 or sgControl CT26 cells was analyzed by flow cytometry. f mRNA levels of indicated genes from sgControl or sgUsp8 PC9 cells were analyzed using RT-qPCR. g mRNA levels of indicated genes from PC9 cells treated with DMSO or DUBs-IN-2 (2 µM) for 24 h were analyzed using RT-qPCR. h The association between cytotoxic T lymphocyte level (CTL) and overall survival (OS) for colorectal cancer patients (GSE71187 cohort) under the condition of USP8 high or low expression was analyzed using Kaplan–Meier curves by the Tumor Immune Dysfunction and Exclusion (TIDE) algorithm. Two-sided Wald-test. i Immunoblot (IB) analysis of whole-cell lysates (WCL) and anti-HA IPs from 293 T cells co-transfected with indicated constructs. Cells were treated with 10 µM MG132 for 12 h. Three independent experiments were conducted. j IB analysis of WCL derived from sgControl or sgUsp8 CT26 cells treated with indicated inhibitors of NF-κB (IKK16, 10 µM) for 15 h. Three independent experiments were conducted. k mRNA levels of indicated genes from sgControl or sgUsp8 CT26 treating with DMSO or 10 μM IKK16 for 15 h. l-n IB analysis of WCL derived from sgControl or sgUsp8 CT26 cells infected with indicated lentiviral shGFP or shp65 (l). Cell surface H2Kd/H2Dd was analyzed by flow cytometry (m, n). o mRNA levels of indicated genes from sgControl or sgUsp8 CT26 cells infected with indicated lentiviral shGFP or shp65. For c, eg, k, n, and o data were presented as mean ± S.D.; n = 3 biologically independent samples; Two-sided t-test. The relevant raw data and uncropped dots are provided as a Source Data file.
Fig. 6
Fig. 6. The combination of USP8 inhibitor with PD-1/PD-L1 blockade significantly suppresses tumor growth in vivo.
a, b Tumor growth or Kaplan–Meier survival curves for C57BL/6 bearing MC38 tumors with indicated treatments. n = 7 mice/group. log-rank test (b). mAb: monoclonal antibody. c, d Tumor growth or Kaplan–Meier survival curves for BALB/c mice bearing CT26 tumors with indicated treatments. n = 9 (control), 7 (DUBs-IN-2), 6 (PD-L1 mAb), 7 (PD-1 mAb), 8 (PD-1 mAb plus DUBs-IN-2) or 7 (PD-L1 mAb plus DUBs-IN-2) mice. log-rank test (d). eg Representative images of HE staining (e), tumor sizes (f), or tumor areas (g) in tumor-burdened lungs of KP mice were analyzed. Scale bars represent 5 mm. n  =  5, 6, 5, or 4 mice/group. h Quantification of CD8+ T cells represented as percentage of tumor-infiltrating lymphocytes (TIL) in CT26 tumors after indicated treatments. n  =  6, 5, 5, or 5 mice/group. i, j Quantification of Granzyme B (GzmB) (i) or TIM3 (j) represented as percentage on CD8+ TILs in CT26 tumors after indicated treatments. n  =  5, 5, 5, or 4 mice/group. k Tumor growth of sgControl or sgUsp8 CT26 cells in BALB/c mice with indicated treatments. n = 5 mice/group. l Quantification of CD8+ T cells represented as percentage of TIL in sgControl or sgUsp8 CT26 tumors after indicated treatments. n = 5 mice/group. m Quantification of GzmB represented as percentage on tumor-infiltrating CD8+ T cells in sgControl or sgUsp8 CT26 tumors after indicated treatments. n = 5 mice/group. n A working model for targeting USP8 sensitizes tumors to PD-1/PD-L1 blockade. USP8 downregulates PD-L1 and MHC-I-mediated antigen-presenting, leading to non-inflamed TME and resistance to PD-1/PD-L1 blockade (left panel). However, inhibition of USP8 by DUBs-IN-2 upregulates PD-L1 and antigen-presenting, setting up an inflamed TME and sensitive to anti-PD-1/PD-L1 immunotherapy (right panel). Ub: ubiquitin. TME: tumor microenvironment. For a, c, k data were presented as mean ± S.D.; two-way ANOVA test. For f, g, hj, l, m data were presented as mean ± S.D.; two-sided t-test. Source data are provided as a Source Data file.

References

    1. Ribas A, Wolchok JD. Cancer immunotherapy using checkpoint blockade. Science. 2018;359:1350–1355. - PMC - PubMed
    1. Zappasodi R, Merghoub T, Wolchok JD. Emerging concepts for immune checkpoint blockade-based combination therapies. Cancer Cell. 2018;33:581–598. - PMC - PubMed
    1. Sharma P, Hu-Lieskovan S, Wargo JA, Ribas A. Primary, adaptive, and acquired resistance to cancer immunotherapy. Cell. 2017;168:707–723. - PMC - PubMed
    1. Kalbasi A, Ribas A. Tumour-intrinsic resistance to immune checkpoint blockade. Nat. Rev. Immunol. 2020;20:25–39. - PMC - PubMed
    1. Hegde PS, Chen DS. Top 10 challenges in cancer immunotherapy. Immunity. 2020;52:17–35. - PubMed

MeSH terms

Substances