

Methane emissions and rumen metabolite concentrations in cattle fed two different silages
- PMID: 35361825
- PMCID: PMC8971404
- DOI: 10.1038/s41598-022-09108-w
Methane emissions and rumen metabolite concentrations in cattle fed two different silages
Abstract
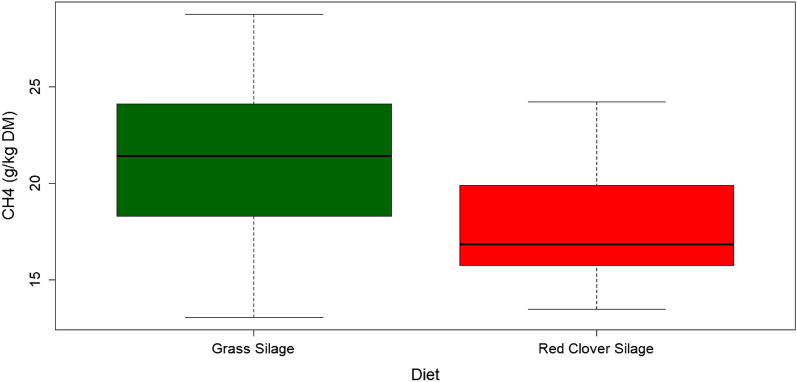
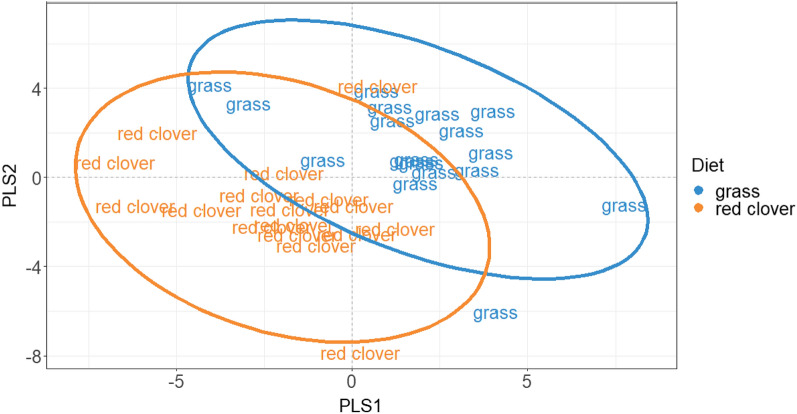
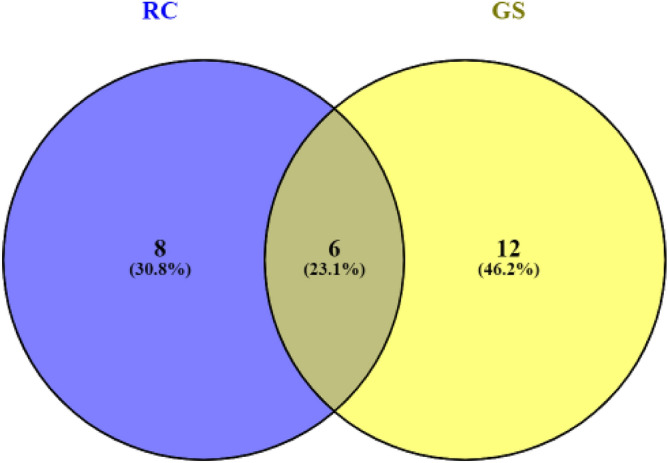
In this study, 18 animals were fed two forage-based diets: red clover (RC) and grass silage (GS), in a crossover-design experiment in which methane (CH4) emissions were recorded in respiration chambers. Rumen samples obtained through naso-gastric sampling tubes were analysed by NMR. Methane yield (g/kg DM) was significantly lower from animals fed RC (17.8 ± 3.17) compared to GS (21.2 ± 4.61) p = 0.008. In total 42 metabolites were identified, 6 showing significant differences between diets (acetate, propionate, butyrate, valerate, 3-phenylopropionate, and 2-hydroxyvalerate). Partial least squares discriminant analysis (PLS-DA) was used to assess which metabolites were more important to distinguish between diets and partial least squares (PLS) regressions were used to assess which metabolites were more strongly associated with the variation in CH4 emissions. Acetate, butyrate and propionate along with dimethylamine were important for the distinction between diets according to the PLS-DA results. PLS regression revealed that diet and dry matter intake are key factors to explain CH4 variation when included in the model. Additionally, PLS was conducted within diet, revealing that the association between metabolites and CH4 emissions can be conditioned by diet. These results provide new insights into the methylotrophic methanogenic pathway, confirming that metabolite profiles change according to diet composition, with consequences for CH4 emissions.
© 2022. The Author(s).
Conflict of interest statement
The authors declare no competing interests.
Figures
References
-
- Saunois M, et al. The global methane budget 2000–2012. Earth Syst. Sci. Data. 2016;8(2):697–751. doi: 10.5194/essd-8-697-2016. - DOI
Publication types
MeSH terms
Substances
LinkOut - more resources
Full Text Sources
Other Literature Sources
