. 2022 Jun;19(6):696-704.
doi: 10.1038/s41592-022-01445-y. Epub 2022 Mar 31.

Merfin: improved variant filtering, assembly evaluation and polishing via k-mer validation

Affiliations

Merfin: improved variant filtering, assembly evaluation and polishing via k-mer validation

Giulio Formenti et al. Nat Methods. 2022 Jun.

Abstract

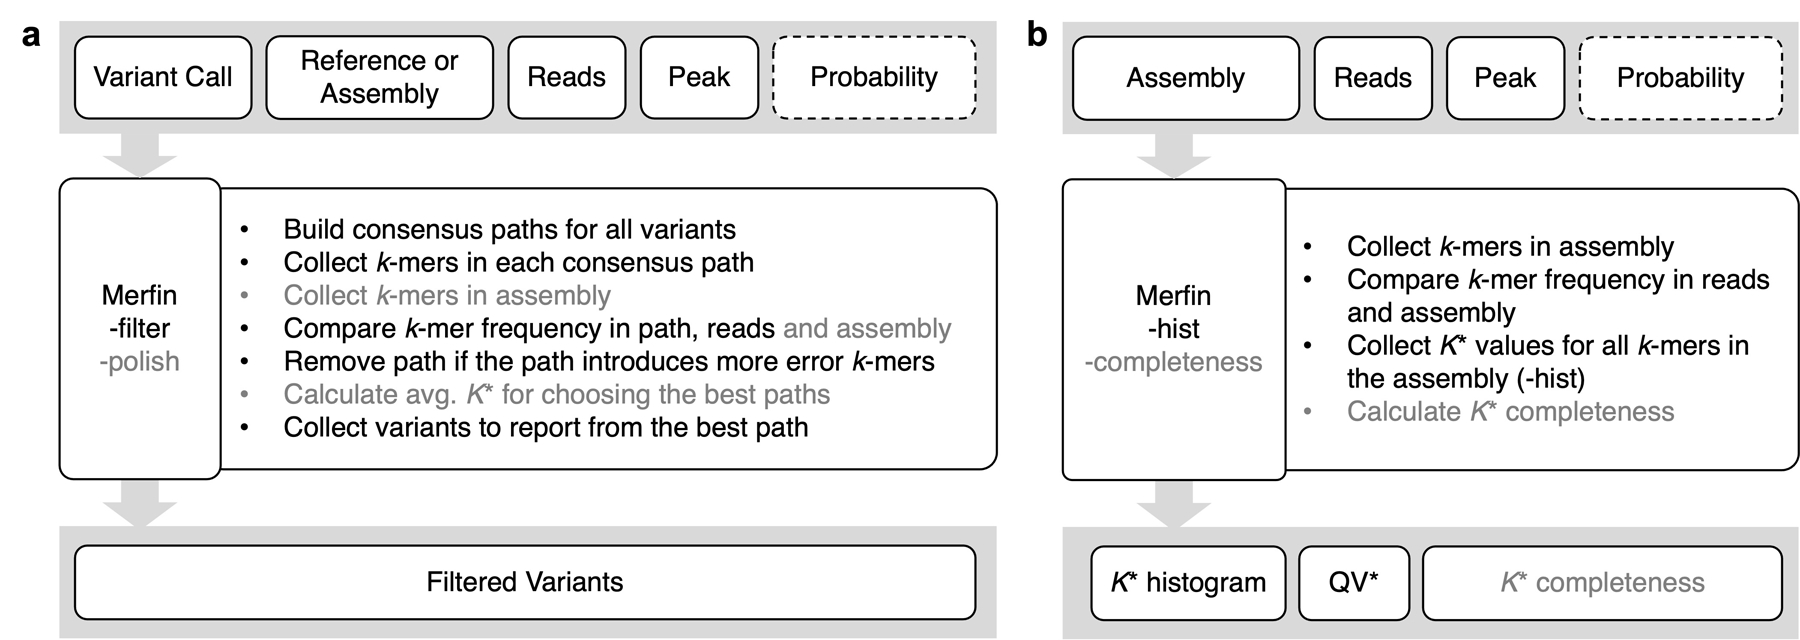
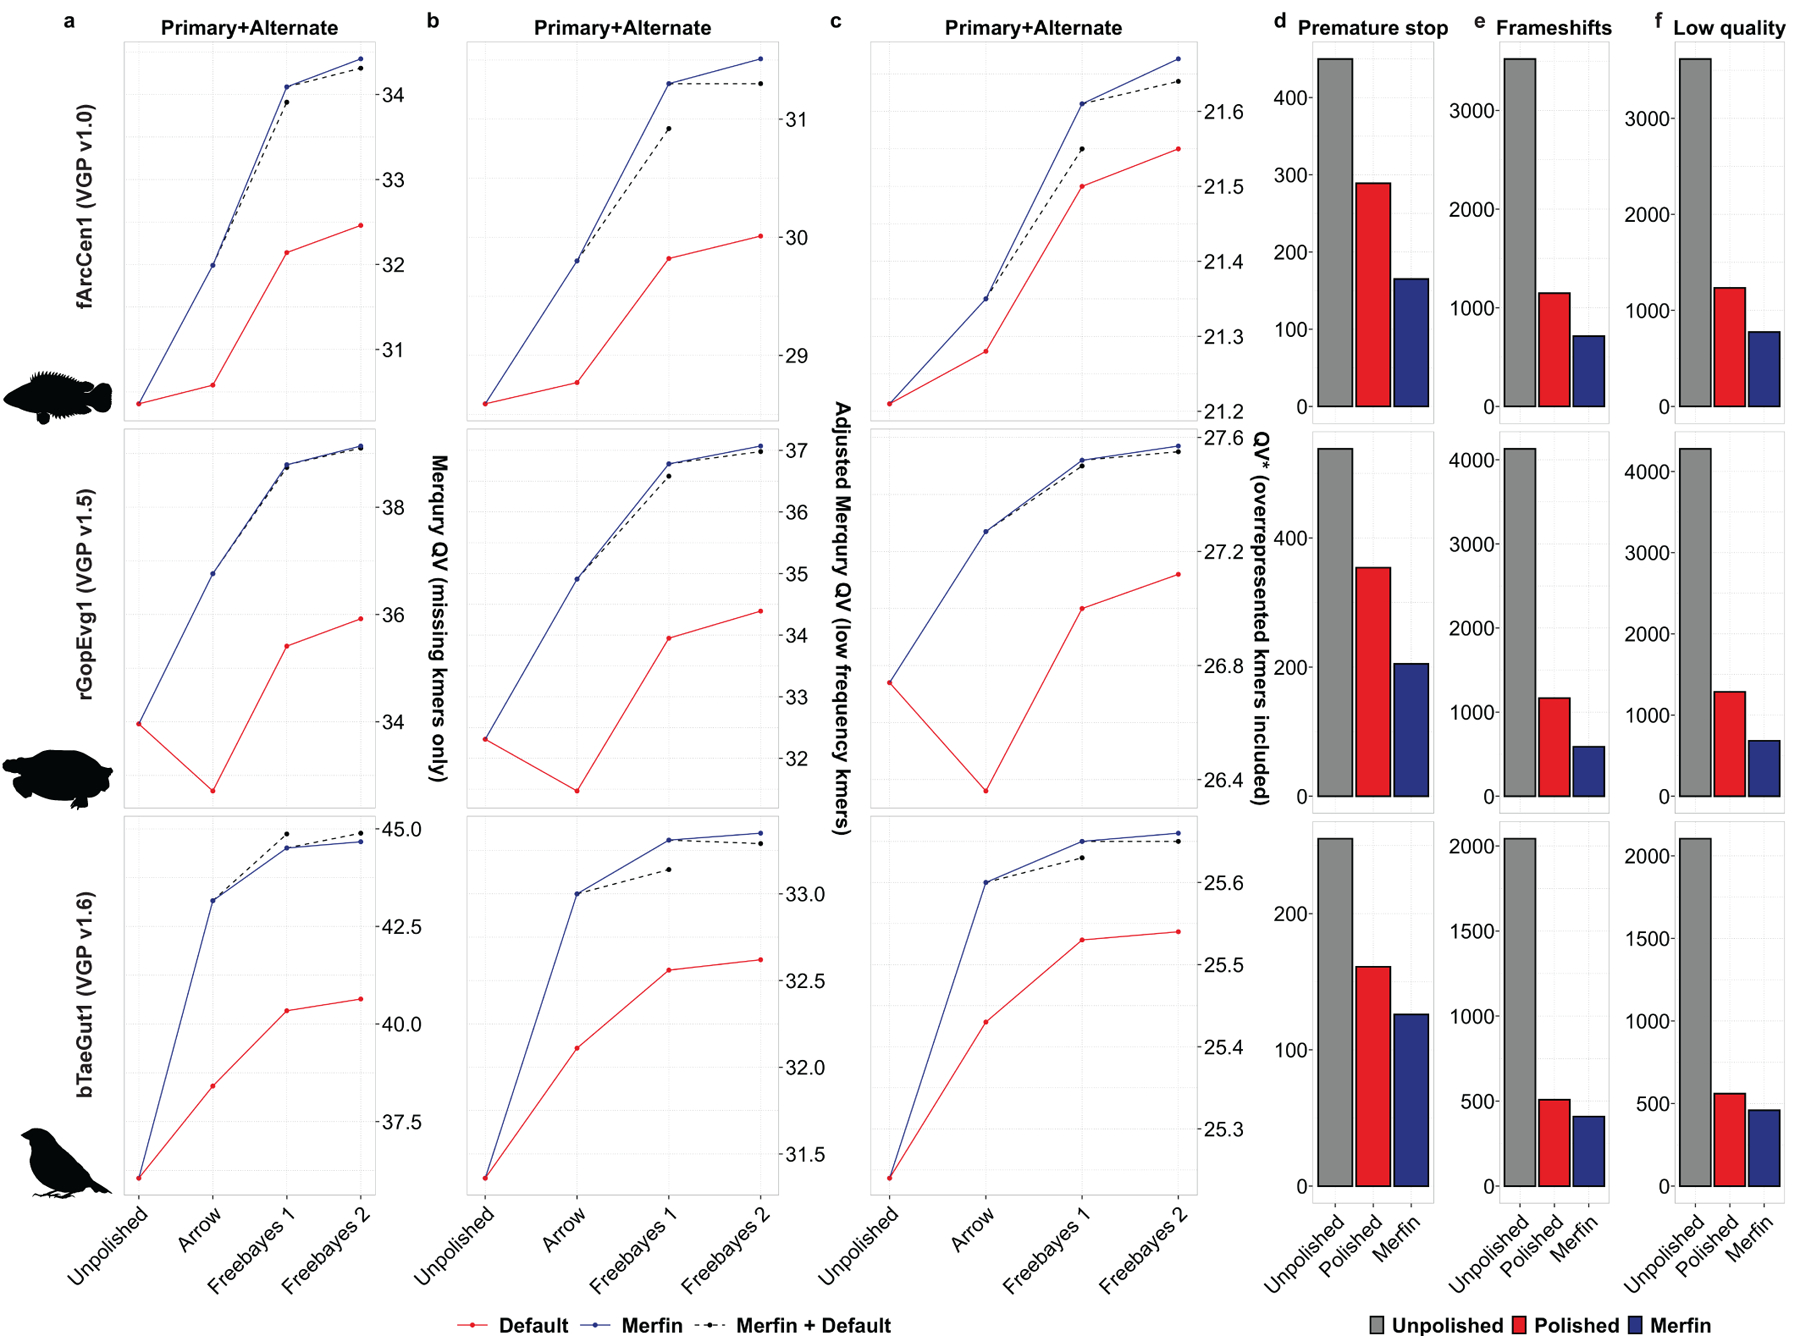
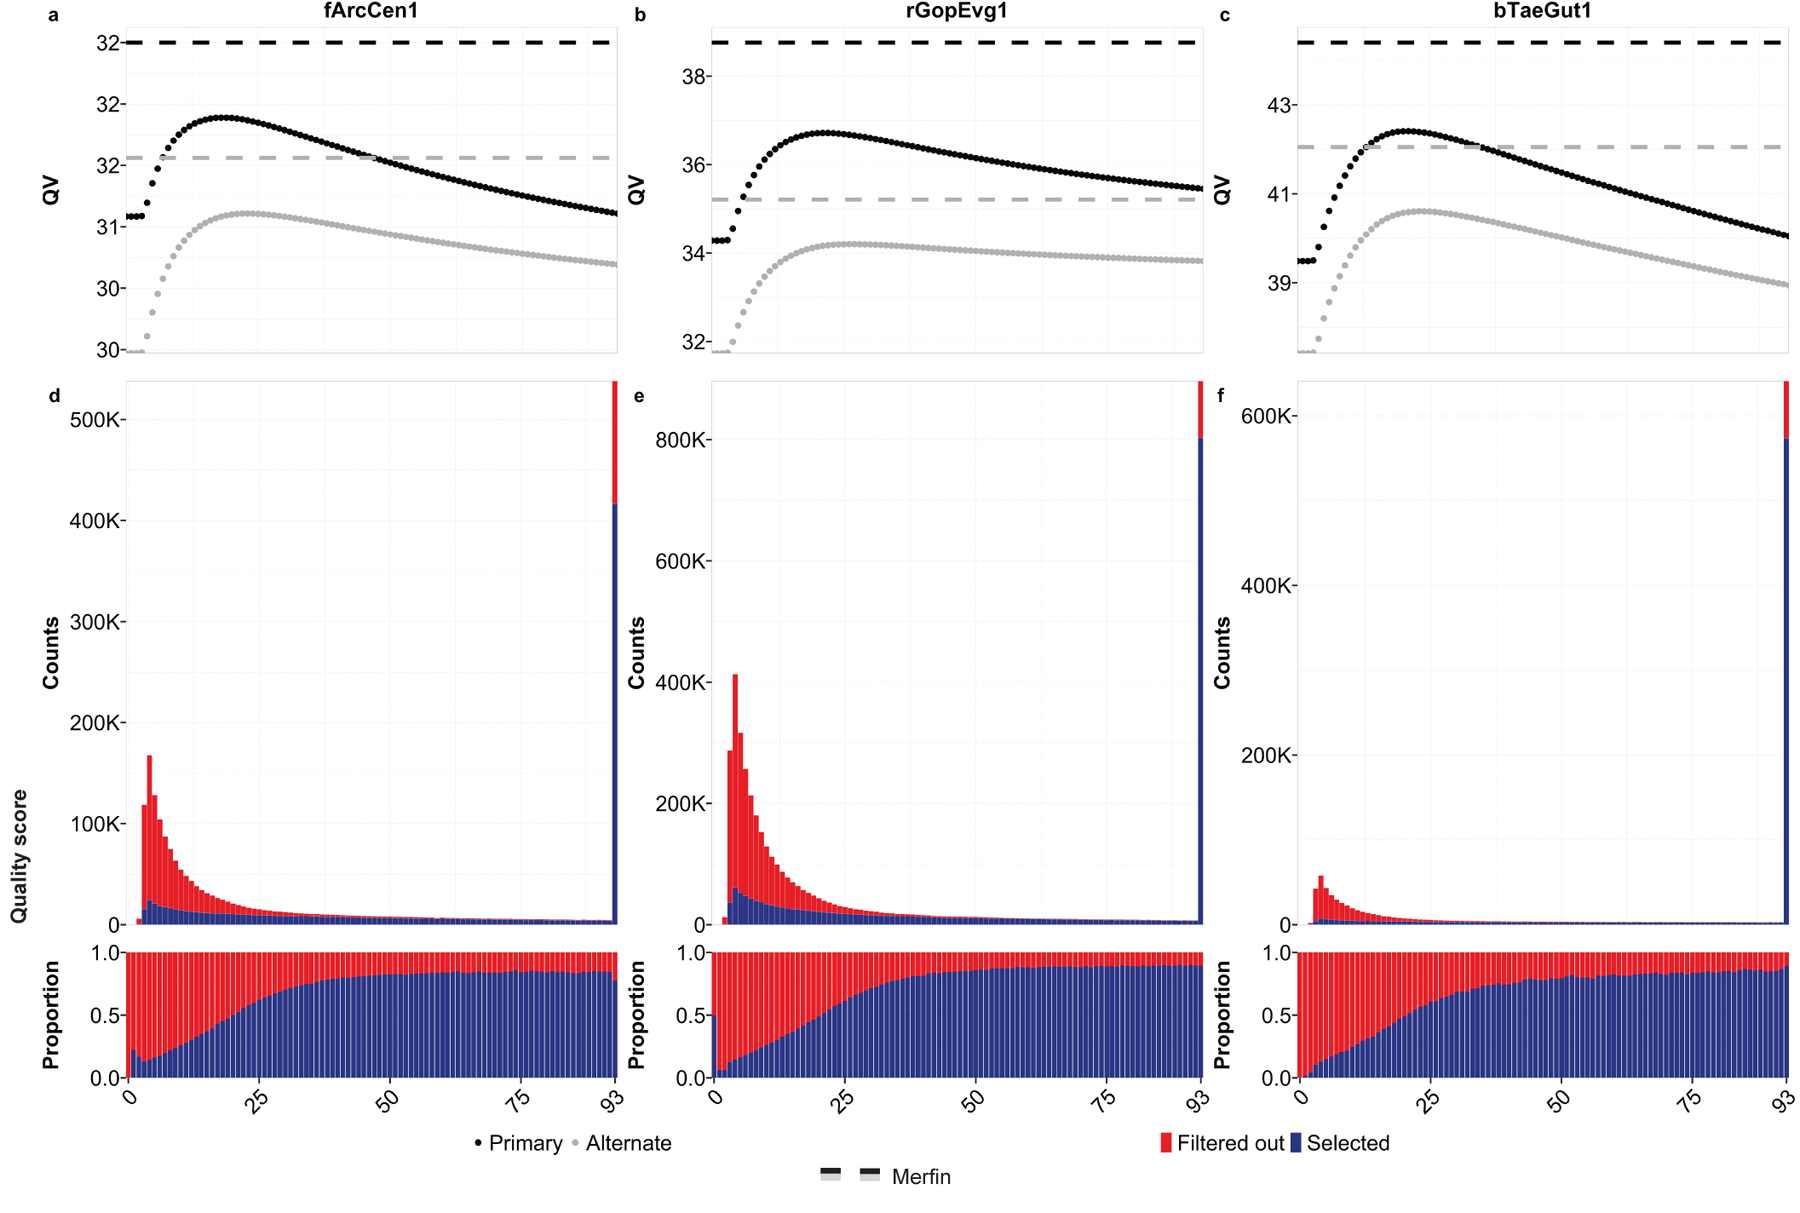
Variant calling has been widely used for genotyping and for improving the consensus accuracy of long-read assemblies. Variant calls are commonly hard-filtered with user-defined cutoffs. However, it is impossible to define a single set of optimal cutoffs, as the calls heavily depend on the quality of the reads, the variant caller of choice and the quality of the unpolished assembly. Here, we introduce Merfin, a k-mer based variant-filtering algorithm for improved accuracy in genotyping and genome assembly polishing. Merfin evaluates each variant based on the expected k-mer multiplicity in the reads, independently of the quality of the read alignment and variant caller's internal score. Merfin increased the precision of genotyped calls in several benchmarks, improved consensus accuracy and reduced frameshift errors when applied to human and nonhuman assemblies built from Pacific Biosciences HiFi and continuous long reads or Oxford Nanopore reads, including the first complete human genome. Moreover, we introduce assembly quality and completeness metrics that account for the expected genomic copy numbers.


Conflict of interest statement

Competing Interests Statement

S.K. has received travel funds to speak at symposia organized by Oxford Nanopore. The remaining authors declare no competing interests.

Figures

Extended Data Fig. 1 |
Extended Data Fig. 1 |. Flowchart diagram of each mode in Merfin.
Text inside gray boxes on the top represents input files required (solid) or optional (dashed) for Merfin. a, genotyping (-filter) and polishing (-polish) modes. b, K* histogram (-hist) and K* completeness (-completeness) modes. Steps listed in bullet points are marked in gray if it is only applicable in -polish (a) or -completeness (b) mode.
Extended Data Fig. 2 |
Extended Data Fig. 2 |. Genome-wide density distribution of the K* using Illumina k-mers.
When the assembly is in agreement with the raw data, the K* is normally distributed with mean 0, and the smaller the standard deviation the higher the agreement. CHM13v1.0 shows a less dispersed distribution of the K* compared to a regular HiCanu assembly.
Extended Data Fig. 3 |
Extended Data Fig. 3 |. A region of negative K* highlighting sequencing bias.
An example of low coverage in both HiFi and Illumina reads associated with high guanine content, and specifically a GA-rich repeat (heatmap). GA bias has been reported in PacBio HiFi data, and results in gaps in the assembly that in CHM13 were filled with Nanopore data. The K* both from HiFi and Illumina k-mers (top tracks) recapitulate the coverage drop. Nanopore coverage appears less affected. Position Chr. 12:~129,862,000 bp.
Extended Data Fig. 4 |
Extended Data Fig. 4 |. The K* can identify issues in the assembly at the base level.
a, 40 bp window with K* close to 0, highlighting perfect agreement of the assembly with the raw reads. Position Chr18:~7,000,000 bp. b, A region of negative K* in coincidence with two heterozygous indels. Position Chr1:~105,008,350 bp.
Extended Data Fig. 5 |
Extended Data Fig. 5 |. Coverage titration experiment and impact on QV*.
The QV* is only marginally influenced by the coverage of the dataset being considered.
Extended Data Fig. 6 |
Extended Data Fig. 6 |. Haplotype phasing before and after polishing with Merfin.
In both parental assemblies, the haplotypes remained fully phased, and the size of the blocks significantly increased compared to the unpolished version (a,b) after polishing with Merfin (c,d). A theoretical human genome size of 3.1 Gbp was used to normalize NG* values.
Extended Data Fig. 7 |
Extended Data Fig. 7 |. VGP assembly pipeline.
Compared to the previous v1.6, the introduction of Merfin in v1.7 (green) resulted in a minimal change of the workflow, but in a generalized improvement in QV scores and gene annotations. Pipeline available at https://github.com/VGP/vgp-assembly.
Extended Data Fig. 8 |
Extended Data Fig. 8 |. Phase block analysis of zebra finch pseudo-haploid assembly.
a, Phase blocks in the primary assembly after mapping the reads to both the primary and alternate assemblies. b, Phase blocks in the primary assembly after mapping the reads to both the primary only. c, Phase blocks in the alternate assembly after mapping the reads to both the primary and alternate assemblies. d, Phase blocks in the alternate assembly. In all cases, the application of Merfin filtering minor heterozygous variants (green) leads to block sizes better or comparable to prior polishing methods alone (blue). Unpolished assembly in gray. Results of Merfin without filtering in red. A genome size of ~1.03 Gbp derived from Genomescope2 was used to normalize NG* values.
Extended Data Fig. 9 |
Extended Data Fig. 9 |. Effect of merfin correction on the kinetochore scaffold 1 (KNL1) annotation.
a, Deleterious presence of an extra A around position 1,321,620 of scaffold_7 (red box) in the polished, non-merfin-corrected sequence is indicated by a 1-base gap in the alignments of zebra finch PacBio IsoSeq SRR8695295.20794.1 and KNL1 transcripts from three other Passeriformes songbirds. This insertion causes a disruption in the frame and a premature stop codon in the translated sequence (see amino acid sequence in red). b, Corresponding span in the merfin-corrected assembly, with gapless alignments of the IsoSeq read and Passeriformes transcripts, and uninterrupted translation.
Fig. 1 |
Fig. 1 |. Algorithms and results used in Merfin.
a, Two variant calls and its potential consensus paths. The bases and k-mers in red are errors not found in the reads. The path with A>C has no error k-mers and gets chosen for genotyping (*). For polishing, the average K* is computed in addition to the missing k-mers using the predicted absent k-mers. b, Precision, recall, and F1 from a benchmark on HG002 genotyping. Merfin always achieves higher precision and F1 scores compared to the hard-filtered approach with almost no loss in recall. Default, no filtering; Red, hard-filtering on default. c, K-mer frequency found in the consensus sequence (KC), reads (KR) with average coverage at 4 (c), expected copy number based on the corrected k-mer frequency (Kr = KR / c), and K*. Positive and negative K* values are colored in green and red. The highlighted region (gray) shows the same k-mers and values used to compute K* as affected by the A base in the reference. If two alternatives bear the same number of missing k-mers the alternative with the K* closest to zero is chosen. d. K* distribution. K* values deviated from 0 indicate collapsed (+) or expanded (−) k-mers in the assembly. e, Genomescope 2.0 k-mer frequency histogram with theoretical k-multiplicity curves (top) and probabilities (bottom) for 0, 1, 2, 3, and 4-copy k-mers, generated using the --fitted_hist option. Note that the 3-copy peak is fully contained in the 2 and 4-copy peaks. f, Diagram for estimating QV* and completeness from k-mers. Each k-mer is a block colored by its state of presence. In the block tower, each column represents the identical k-mer with its state colored by its presence in the assembly, reads, or in both. Note the QV* and K* completeness is using all k-mers including their frequency.
Fig. 2 |
Fig. 2 |. CHM13 evaluation and polishing.
a, Genome-wide K* for the CHM13 assembly v1.0. Satellites are associated with repeat- and technology-specific biases. Yet to be resolved rDNA arrays (red) are highlighted by positive K*. b, Highlight of the centromeric satellite repeats (manuscript in preparation) and segmental duplications (orange most similar, yellow less, gray least) on chromosome 9. c, Genome-wide density distribution of the K* using HiFi k-mers. When the assembly is in agreement with the raw data, the K* is normally distributed with mean 0, and the smaller the standard deviation the higher the agreement. CHM13 v1.0 shows a less dispersed distribution of the K* compared to a less complete v0.7 assembly. d, Genome-wide comparison of the K* computed using HiFi vs Illumina k-mers on the CHM13 v1.0 assembly. Agreement between the assembly and the raw reads supported by the two technologies is found around (0, 0). The upper right quadrant highlights where both HiFi vs Illumina technologies suggest the presence of underrepresented k-mers that were largely contributed from the un-assembled rDNAs later resolved in v1.1; the lower left quadrant highlights where both technologies suggest the presence of overrepresented k-mers (with perfect agreement found on the diagonals). The axes correspond to regions of substantial disagreement between the two technologies. Diamonds indicate k-mers missing from one (x or y axis) or both (0, 0) technologies.
Fig. 3. |
Fig. 3. |. HG002 human trio polishing and evaluation.
a, Distribution of QV scores as measured by Merqury for maternal and paternal contigs polished with Medaka only, or with variants generated by Medaka filtered with Merfin, from the experiment (test 4, Supplementary Table 3) using latest basecaller (Guppy 4.2.2) and highest coverage (~50x). The first panel represents the unpolished contigs, the mid panel the first round of Medaka polishing and filtering, and the last panel the second round applied to the Merfin results from the previous round. The number of contigs without evidence of errors as judged by Merqury QV are reported on the right side. b, Size of the haplotype blocks before and after polishing with or without Merfin for both the maternal and paternal assemblies. First round of polishing is represented by the dotted lines. c, Number of variants generated by Medaka for polishing and remaining variants after Merfin filtering for both the maternal and paternal assemblies. d, Assembly-based HG002 small variant calling performance of Merfin vs regular Medaka against GIAB truth set. Variants from the assembly are derived against GRCh38 using dipcall.
Fig. 4. |
Fig. 4. |. Polishing and evaluation of VGP pseudo-haploid assemblies.
a-c, Polishing results of primary and alternate assemblies for the flier cichlid (fArcCen1), the Goode’s desert tortoise (rGopEvg1), and the zebra finch (bTaeGut1) using the VGP pipeline. Graphed are the unpolished QV values, and the Merqury QV that accounts only for missing k-mers (a), the Merqury QV corrected using Merfin models for 0-copy k-mers (b), and QV* that also accounts for overrepresented k-mers (c). d-f, the general QV increase was reflected in the quality of the gene annotation, with consistent reduction in the number of genes affected by premature stop codons (d), frameshifts errors (e), and low quality protein-coding gene predictions (f).
Fig. 5. |
Fig. 5. |. Merfin results against quality scores.
a-c, QV after polishing as a function of hard-filtered quality score cutoff in primary (black) and alternate (gray) assembly. Results achieved with Merfin are represented by the horizontal lines for comparison. d-f, Number and proportion of variants by quality score selected by Merfin.

References

    1. Olson ND et al. precisionFDA Truth Challenge V2: Calling variants from short- and long-reads in difficult-to-map regions. bioRxiv 2020.11.13.380741 (2021) doi:10.1101/2020.11.13.380741. - DOI - PMC - PubMed
    1. Koboldt DC Best practices for variant calling in clinical sequencing. Genome Med 12, 91 (2020). - PMC - PubMed
    1. Guo Y, Ye F, Sheng Q, Clark T & Samuels DC Three-stage quality control strategies for DNA re-sequencing data. Brief. Bioinform 15, 879–889 (2014). - PMC - PubMed
    1. Giani AM, Gallo GR, Gianfranceschi L & Formenti G Long walk to genomics: History and current approaches to genome sequencing and assembly. Comput. Struct. Biotechnol. J 18, 9–19 (2020). - PMC - PubMed
    1. Rhie A et al. Towards complete and error-free genome assemblies of all vertebrate species. Nature 592, 737–746 (2021). - PMC - PubMed

Methods References

    1. Robinson JT et al. Integrative genomics viewer. Nat. Biotechnol 29, 24–26 (2011). - PMC - PubMed
    1. Morgulis A, Gertz EM, Schäffer AA & Agarwala R WindowMasker: window-based masker for sequenced genomes. Bioinforma. Oxf. Engl 22, 134–141 (2006). - PubMed
    1. Altschul SF, Gish W, Miller W, Myers EW & Lipman DJ Basic local alignment search tool. J. Mol. Biol 215, 403–410 (1990). - PubMed
    1. Kapustin Y, Souvorov A, Tatusova T & Lipman D Splign: algorithms for computing spliced alignments with identification of paralogs. Biol. Direct 3, 20 (2008). - PMC - PubMed
    1. Lowe TM & Eddy SR tRNAscan-SE: a program for improved detection of transfer RNA genes in genomic sequence. Nucleic Acids Res 25, 955–964 (1997). - PMC - PubMed

Publication types