. 2022 Apr;4(4):435-443.
doi: 10.1038/s42255-022-00553-5. Epub 2022 Mar 31.

Altered propionate metabolism contributes to tumour progression and aggressiveness

Affiliations

Altered propionate metabolism contributes to tumour progression and aggressiveness

Ana P Gomes et al. Nat Metab. 2022 Apr.

Abstract

The alteration of metabolic pathways is a critical strategy for cancer cells to attain the traits necessary for metastasis in disease progression. Here, we find that dysregulation of propionate metabolism produces a pro-aggressive signature in breast and lung cancer cells, increasing their metastatic potential. This occurs through the downregulation of methylmalonyl coenzyme A epimerase (MCEE), mediated by an extracellular signal-regulated kinase 2-driven transcription factor Sp1/early growth response protein 1 transcriptional switch driven by metastatic signalling at its promoter level. The loss of MCEE results in reduced propionate-driven anaplerotic flux and intracellular and intratumoral accumulation of methylmalonic acid, a by-product of propionate metabolism that promotes cancer cell invasiveness. Altogether, we present a previously uncharacterized dysregulation of propionate metabolism as an important contributor to cancer and a valuable potential target in the therapeutic treatment of metastatic carcinomas.


Figures

Extended Data Fig. 1
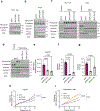
Extended Data Fig. 1. Methylmalonic acid and MCEE levels are altered by metastatic signaling in different cancer cell models.
(a) Propionate metabolism-related enzyme levels evaluated by immunoblots in 4T1-derived clones of cells with different metastatic potential; representative images (n=4). (b) MMA levels in A549 cells treated with TGFβ + TNFα for 3 days (n=4, two-tailed t-test). c, Propionate metabolism-related enzyme levels evaluated by immunoblots in A549 cells treated with TGFβ + TNFα for 3 days; representative images (n=4). d, MCEE-luciferase promoter activity in A549 cells treated with TGFβ + TNFα for 3 days (n=4, two-tailed t-test). e, MMA levels in non-metastatic and metastatic triple negative breast cancer human cell lines (n=4). f, Kaplan-Meyer survival curve of breast cancer patients as a function of MCEE expression. g, Kaplan-Meyer survival curve of lymph node positive triple negative breast cancer patients as a function of MCEE expression. All values are expressed as mean ± SEM.
Extended Data Fig. 2
Extended Data Fig. 2. Knockdown of MCEE induces a pro-aggressive reprogramming.
a, b, MMA levels in HCC1806 (a) and MCF-10A (b) cells with MCEE knockdown for 2 days (n=4, one-way ANOVA with Tukey’s multiple comparison test). c, Immunoblots for EMT and aggressiveness markers in HCC1806, MCF-10A and A549 cells with MCEE knockdown for 10 days; representative images (n=4). All values are expressed as mean ± SEM.
Extended Data Fig. 3
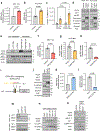
Extended Data Fig. 3. Suppression of MUT induces a pro-aggressive reprogramming.
a, MMA levels in MCF-10A cell with MUT knockdown for 3 days (n=3, one-way ANOVA with Tukey’s multiple comparison test). b, c, Immunoblots for EMT and aggressiveness markers in MCF-10A (b) and A549 (c) cells with MUT knockdown for 10 days; representative images (n=4). d, e, f, g, mRNA levels of SOX4 (d), TGFB1 (e), TGFBR1 (f), and TGFBR3 (g) evaluated by RNA sequencing in A549 cells with MUT knockdown for 3 days (n=3, one-way ANOVA with Tukey’s multiple comparison test). h, MMA levels in MDA-MB-231-LM2 versus MDA-MB-231-luciferase parental cells (n=8, two-tailed t-test). All values are expressed as mean ± SEM.
Extended Data Fig. 4
Extended Data Fig. 4. Vitamin B12 deficiency induces a pro-aggressive reprogramming.
a, MMA levels in MCF-10A cells grown in complete or Vitamin B12-depleted media for 9 days (n=3, two-tailed t-test). b, Immunoblots for EMT and aggressiveness markers in HCC1806, MCF-10A and A549 cells grown in complete or Vitamin B12-depleted media for 10 days; representative images (n=4). c, d, MMA levels in HCC1806 (n=4) (c) and MCF-10A (n=4) (d) cells with MMAB knockdown for 3 days (one-way ANOVA with Tukey’s multiple comparison test). e, Immunoblots for EMT and aggressiveness markers in HCC1806, MCF-10A and A549 cells with MMAB knockdown for 10 days; representative images (n=4). All values are expressed as mean ± SEM.
Extended Data Fig. 5
Extended Data Fig. 5. Overexpression of PCC induces a pro-aggressive reprogramming.
a, b, Propionyl-CoA (a) and MMA (b) levels in MCF-10A cells overexpressing PCCA and PCCB for 5 days (n=3, two-tailed t-test). c-f, TCA cycle intermediates succinate (c), fumarate (d), malate (e), oxaloacetate (f) in MCF-10A cells overexpressing PCCA and PCCB for 5 days (n=3, two-tailed t-test). g, Immunoblots for EMT and aggressiveness markers in HCC1806, MCF-10A and A549 cells overexpressing PCCA and PCCB for 10 days; representative images (n=4). h, i, Transwell migration (h) and invasion (i) assays of MDA-MB-231-luciferase parental cells overexpressing PCCA and PCCB for 6 days (n=4, two-tailed t-test). j, k, Lung colonization assay of MDA-MB-231-luciferase parental cells injected after 6 days of PCCA and PCCB overexpression, imaged at 6 weeks; representative images (j) and quantification (k) (n=10, two-tailed t-test). All values are expressed as mean ± SEM.
Extended Data Fig. 6
Extended Data Fig. 6. Knockdown of PCCA does not induce EMT.
a, b, Immunoblots for EMT markers in MCF-10A (a), and A549 (b) cells with PCCA knockdown for 10 days; representative images (n=4). c, Immunoblots for EMT markers in MCF-10A and A549 cells with PCCA knockdown and treated with 5 mM MMA for 10 days; representative images (n=4). d, Immunoblots for EMT markers in A549 cells with PCCA knockdown and treated with TGFβ + TNFα for 5 days; representative images (n=4). e, MMA levels in Hs578T cells with PCCA knockdown for 5 days (n=4, one-way ANOVA with Tukey’s multiple comparison test). f, g, Transwell migration (f) and invasion (g) assays of Hs578T with PCCA knockdown for 5 days (n=4, one-way ANOVA with Tukey’s multiple comparison test). h, i, Proliferation of Hs578T (h) and MDA-MB-231-LM2 (i) with PCCA knockdown for 5 days (n=4, two-way repeated measures ANOVA test based on general linear model (GLM) with Tukey’s multiple comparison test, p values only shown for end point). All values are expressed as mean ± SEM.
Fig. 1:
Fig. 1:. Methylmalonic Acid is upregulated in breast cancer metastasis.
a, b, Heat map (a) and metabolic pathway enrichment analysis (b) of the statistically significantly altered metabolites (FDR≤0.05) in 4T1 primary tumors and pulmonary metastases (n=4 biologically independent samples). c, Schematic representation of propionate metabolism. d, Methylmalonic acid (MMA) levels in 4T1 primary tumors and pulmonary metastases (n=4, two-tailed t-test). e, MMA levels in 4T1 (broadly metastatic) and 4TO7 (locally invasive) clones with different metastatic potential derived from a single primary tumor (n=5 biologically independent samples, two-tailed t-test). f, MMA levels in breast epithelial and breast cancer cell lines (n=5 biologically independent samples). All values are expressed as mean ± SEM.
Fig. 2:
Fig. 2:. Metastatic signaling leads to MMA production through regulation of MCEE.
a, b, MMA levels in MCF-10A (a) and HCC1806 (b) cells treated with TGFβ + TNFα for 3 days (n=4 biologically independent samples, two-tailed t-test). c, Fractions of labeled intracellular MMA derived from glucose + glutamine (GG) or valine + isoleucine + threonine + methionine (AA) in HCC1806 cells treated with TGFβ + TNFα for 3 days (n=6 biologically independent samples, two-way ANOVA with Sidak’s multiple comparison test). d, e, Propionate metabolism-related enzyme levels evaluated by immunoblots in MCF-10A and HCC1806 cells treated with TGFβ + TNFα for 3 days (d), and in non-metastatic and metastatic triple negative breast cancer human cell lines (e); representative images (n=4 biologically independent samples). f, g, MCEE mRNA levels evaluated by qPCR in MCF-10A (f) and HCC1806 (g) cells treated with TGFβ + TNFα for 3 days (n=4 biologically independent samples, two-tailed t-test). h, MCEE-luciferase promoter activity in MCF-10A cells treated with TGFβ + TNFα for 3 days (n=4 biologically independent samples, two-tailed t-test). i, Schematic representation of SP1 and EGR1 binding sites in MCEE promoter. j, Propionate metabolism-related enzyme levels evaluated by immunoblots in MCF-10A cells expressing the metastatic-inducer ERK2 D319N mutant for 3 days; representative images (n=4 biologically independent samples). k, MMA levels in MCF-10A cells expressing the metastatic-inducer ERK2 D319N mutant for 3 days (n=4 biologically independent samples, two-tailed t-test). l, MCEE-luciferase promoter activity in MCF-10A cells expressing the metastatic-inducer ERK2 D319N mutant for 3 days (n=4 biologically independent samples, two-tailed t-test). m, n, MCEE protein levels evaluated by immunoblot in MCF-10A and HCC1806 cells with SP1 knockdown for 3 days (m) and in MCF-10A cells expressing the ERK2 D319N mutant and either SP1 wild-type or the SP1 T453/T739 phosphorylation site mutants (S to A phospho-defective mutant; S to E, phospho-mimetic mutant) for 3 days (n); representative images (n=4 biologically independent samples). o, MCEE, EGR1 and phospho SP1 protein levels evaluated by immunoblot in HCC1806 treated with TGFβ + TNFα or TGFβ + TNFα + MEK inhibitor for 3 days; representative images (n=4 biologically independent samples). All values are expressed as mean ± SEM.
Fig. 3:
Fig. 3:. Intracellular MMA production promotes EMT and aggressive properties.
a, b, MMA levels (one-way ANOVA with Tukey’s multiple comparison test) (a) and immunoblots for EMT and aggressiveness markers (b) in HCC1806 cells with MUT knockdown for 3 days; representative images (n=4 biologically independent samples). c, Functional annotation clustering analysis of mRNAs that changed >1.5-fold when evaluated by RNA sequencing in A549 cells with MUT knockdown for 3 days (n=3 biologically independent samples). d, MMA levels in MDA-MB-231-luciferase parental cells with MUT knockdown for 3 days (n=4 biologically independent samples, one-way ANOVA with Tukey’s multiple comparison test). e, f, Transwell migration (e) or invasion (f) assays of MDA-MB-231-luciferase parental cells with knockdown of MUT for 6 days (n=4 biologically independent samples, one-way ANOVA with Tukey’s multiple comparison test). g, h, Lung colonization assay of MDA-MB-231-luciferase parental cells injected after 6 days of MUT knockdown imaged at 6 weeks; representative images (g) and quantification (h) (n=8 biologically independent animals for shNT and shMUT#2 and n=7 for shMUT#1, one-way ANOVA with Tukey’s multiple comparison test). All values are expressed as mean ± SEM.
Fig. 4:
Fig. 4:. PCC regulates MMA levels and determines pro-aggressive properties.
a, MMA levels in MCF-10A cells with PCCA knockdown and treated with TGFβ + TNFα for 3 days (n=4 biologically independent samples, two-way ANOVA with Sidak’s multiple comparison test). b, EMT-related proteins evaluated by immunoblots in MCF-10A cells with PCCA knockdown and treated with TGFβ + TNFα for 5 days; representative images (n=4 biologically independent samples). c, MMA levels in MDA-MB-231-LM2 cells with PCCA knockdown for 5 days (n=4 biologically independent samples, one-way ANOVA with Tukey’s multiple comparison test). d, Mesenchymal protein levels evaluated by immunoblots in MDA-MB-231-LM2 cells with PCCA knockdown and treated with 5 mM MMA for 5 days; representative images (n=4 biologically independent samples). e, f, Transwell migration (e) or invasion (f) assays of MDA-MB-231-luciferase LM2 cells with knockdown of PCCA for 6 days (n=4 biologically independent samples, one-way ANOVA with Tukey’s multiple comparison test). g, h, Lung colonization assay of MDA-MB-231-luciferase LM2 cells with knockdown of PCCA for 6 days; representative images (g) and quantification (h) (n=10 biologically independent animals, one-way ANOVA with Tukey’s multiple comparison test). All values are expressed as mean ± SEM.

Comment in

Similar articles

Cited by

References

    1. Dillekas H, Rogers MS & Straume O Are 90% of deaths from cancer caused by metastases? Cancer Med 8, 5574–5576, doi:10.1002/cam4.2474 (2019). - DOI - PMC - PubMed
    1. Mortality GBD & Causes of Death C Global, regional, and national life expectancy, all-cause mortality, and cause-specific mortality for 249 causes of death, 1980–2015: a systematic analysis for the Global Burden of Disease Study 2015. Lancet 388, 1459–1544, doi:10.1016/S0140-6736(16)31012-1 (2016). - DOI - PMC - PubMed
    1. DeBerardinis RJ & Chandel NS Fundamentals of cancer metabolism. Sci Adv 2, e1600200, doi:10.1126/sciadv.1600200 (2016). - DOI - PMC - PubMed
    1. Corrado M, Scorrano L & Campello S Changing perspective on oncometabolites: from metabolic signature of cancer to tumorigenic and immunosuppressive agents. Oncotarget 7, 46692–46706, doi:10.18632/oncotarget.8727 (2016). - DOI - PMC - PubMed
    1. Gomes AP et al. Age-induced accumulation of methylmalonic acid promotes tumour progression. Nature, doi:10.1038/s41586-020-2630-0 (2020). - DOI - PMC - PubMed

Publication types