. 2022 Apr;4(4):444-457.
doi: 10.1038/s42255-022-00551-7. Epub 2022 Mar 31.

Macrophages use apoptotic cell-derived methionine and DNMT3A during efferocytosis to promote tissue resolution

Affiliations

Macrophages use apoptotic cell-derived methionine and DNMT3A during efferocytosis to promote tissue resolution

Patrick B Ampomah et al. Nat Metab. 2022 Apr.

Abstract

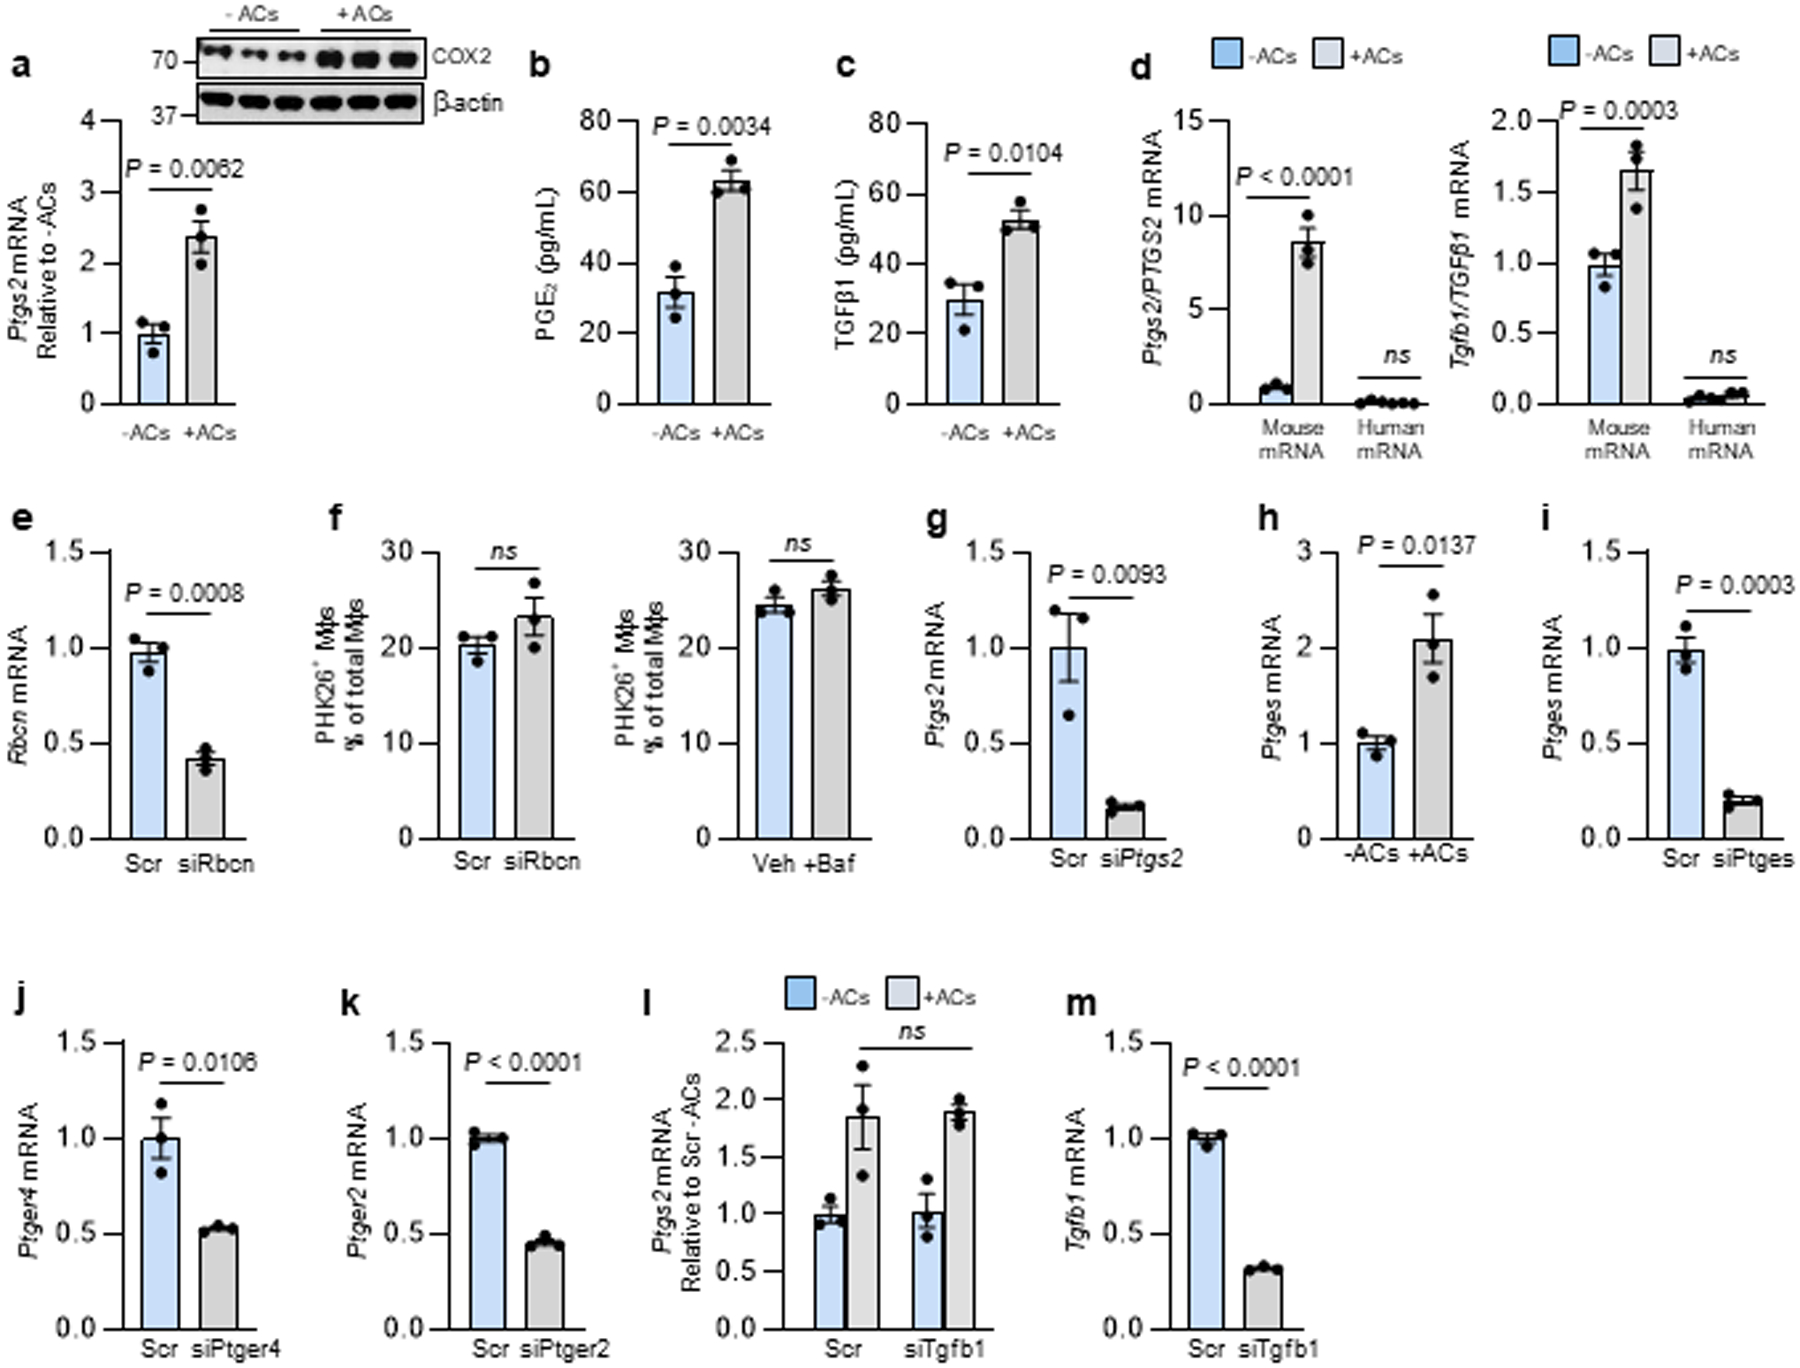
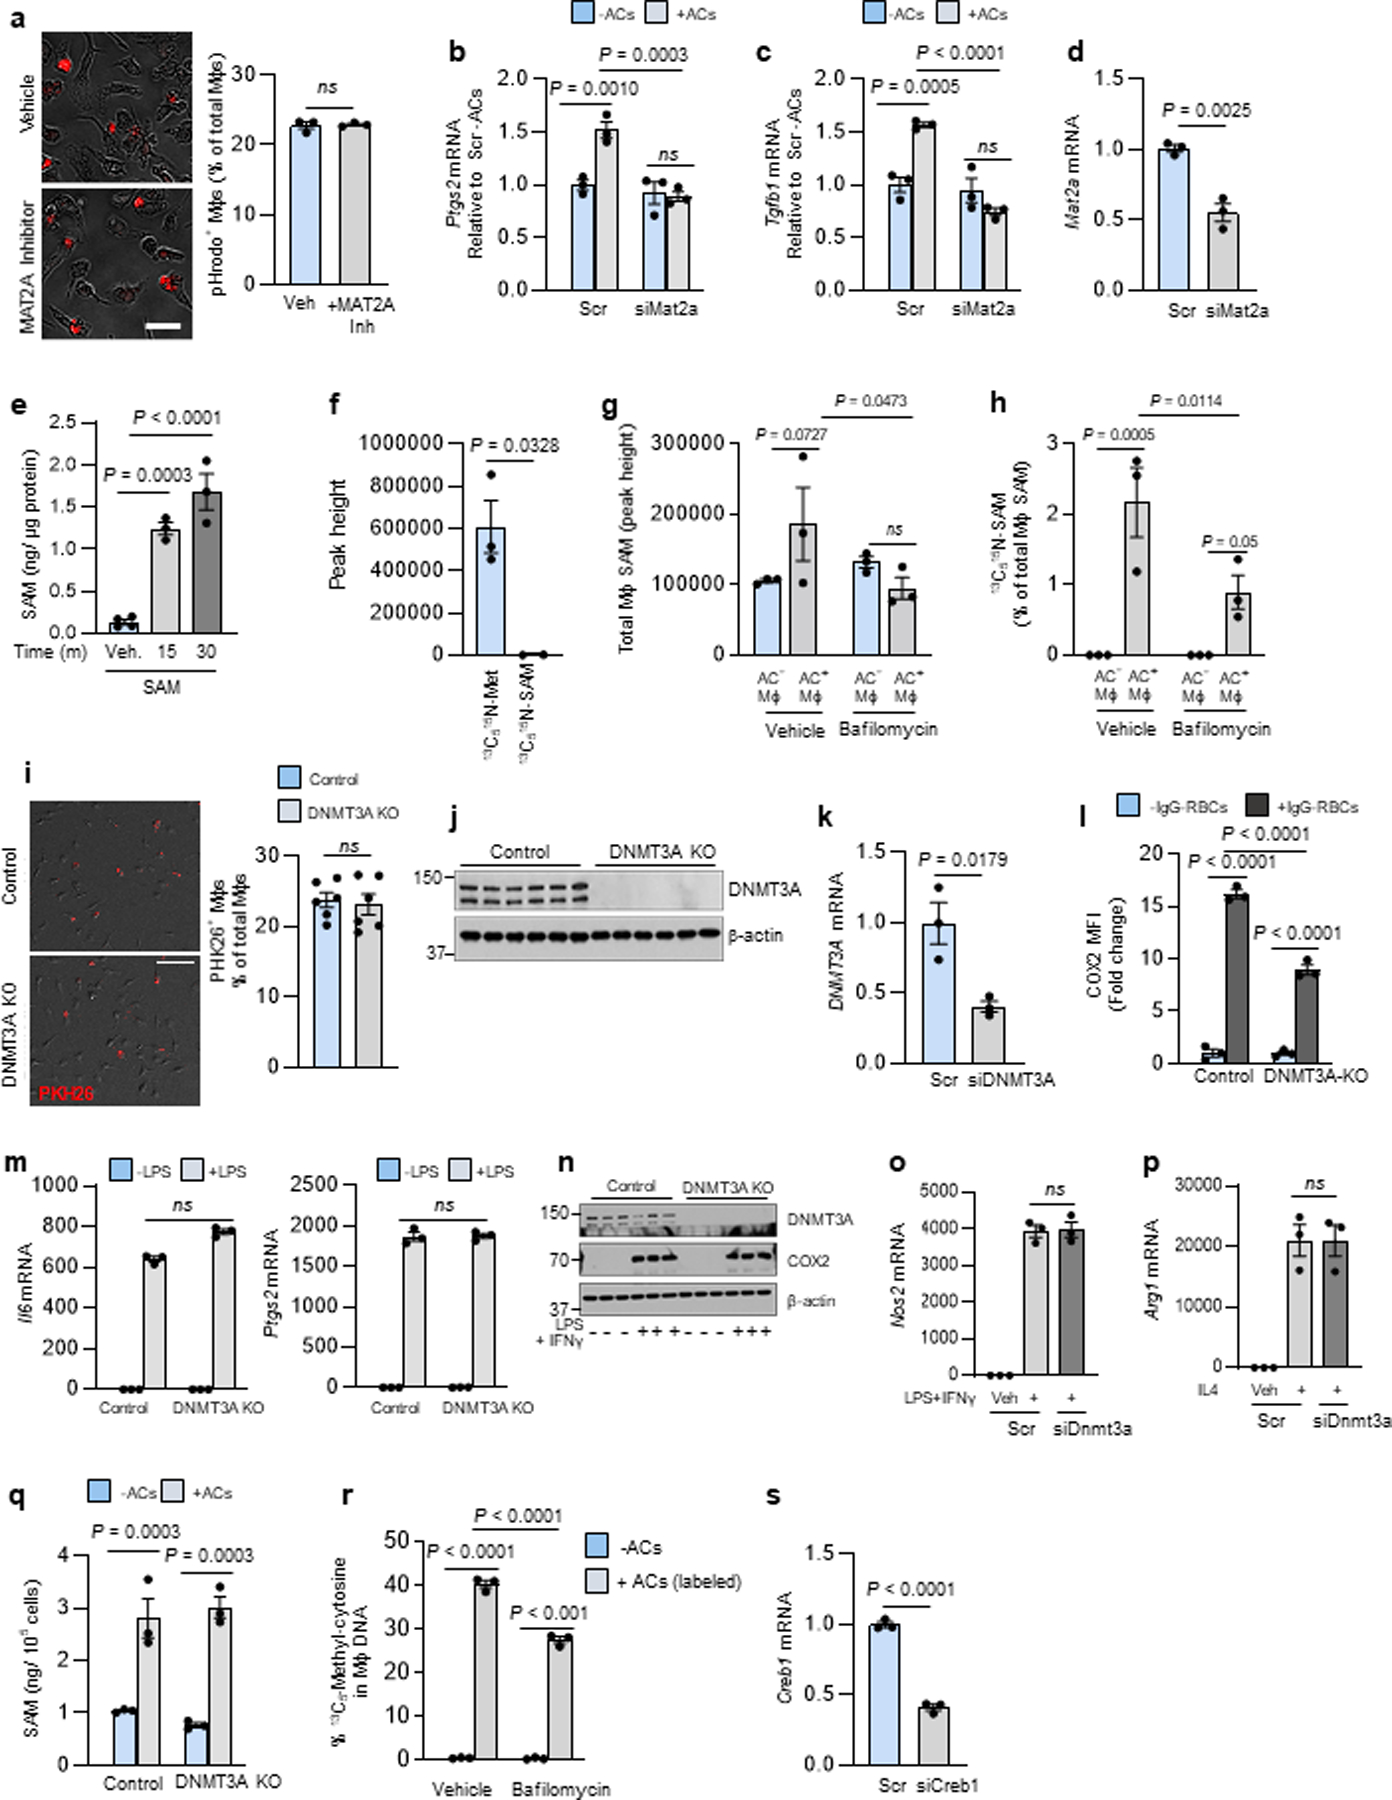
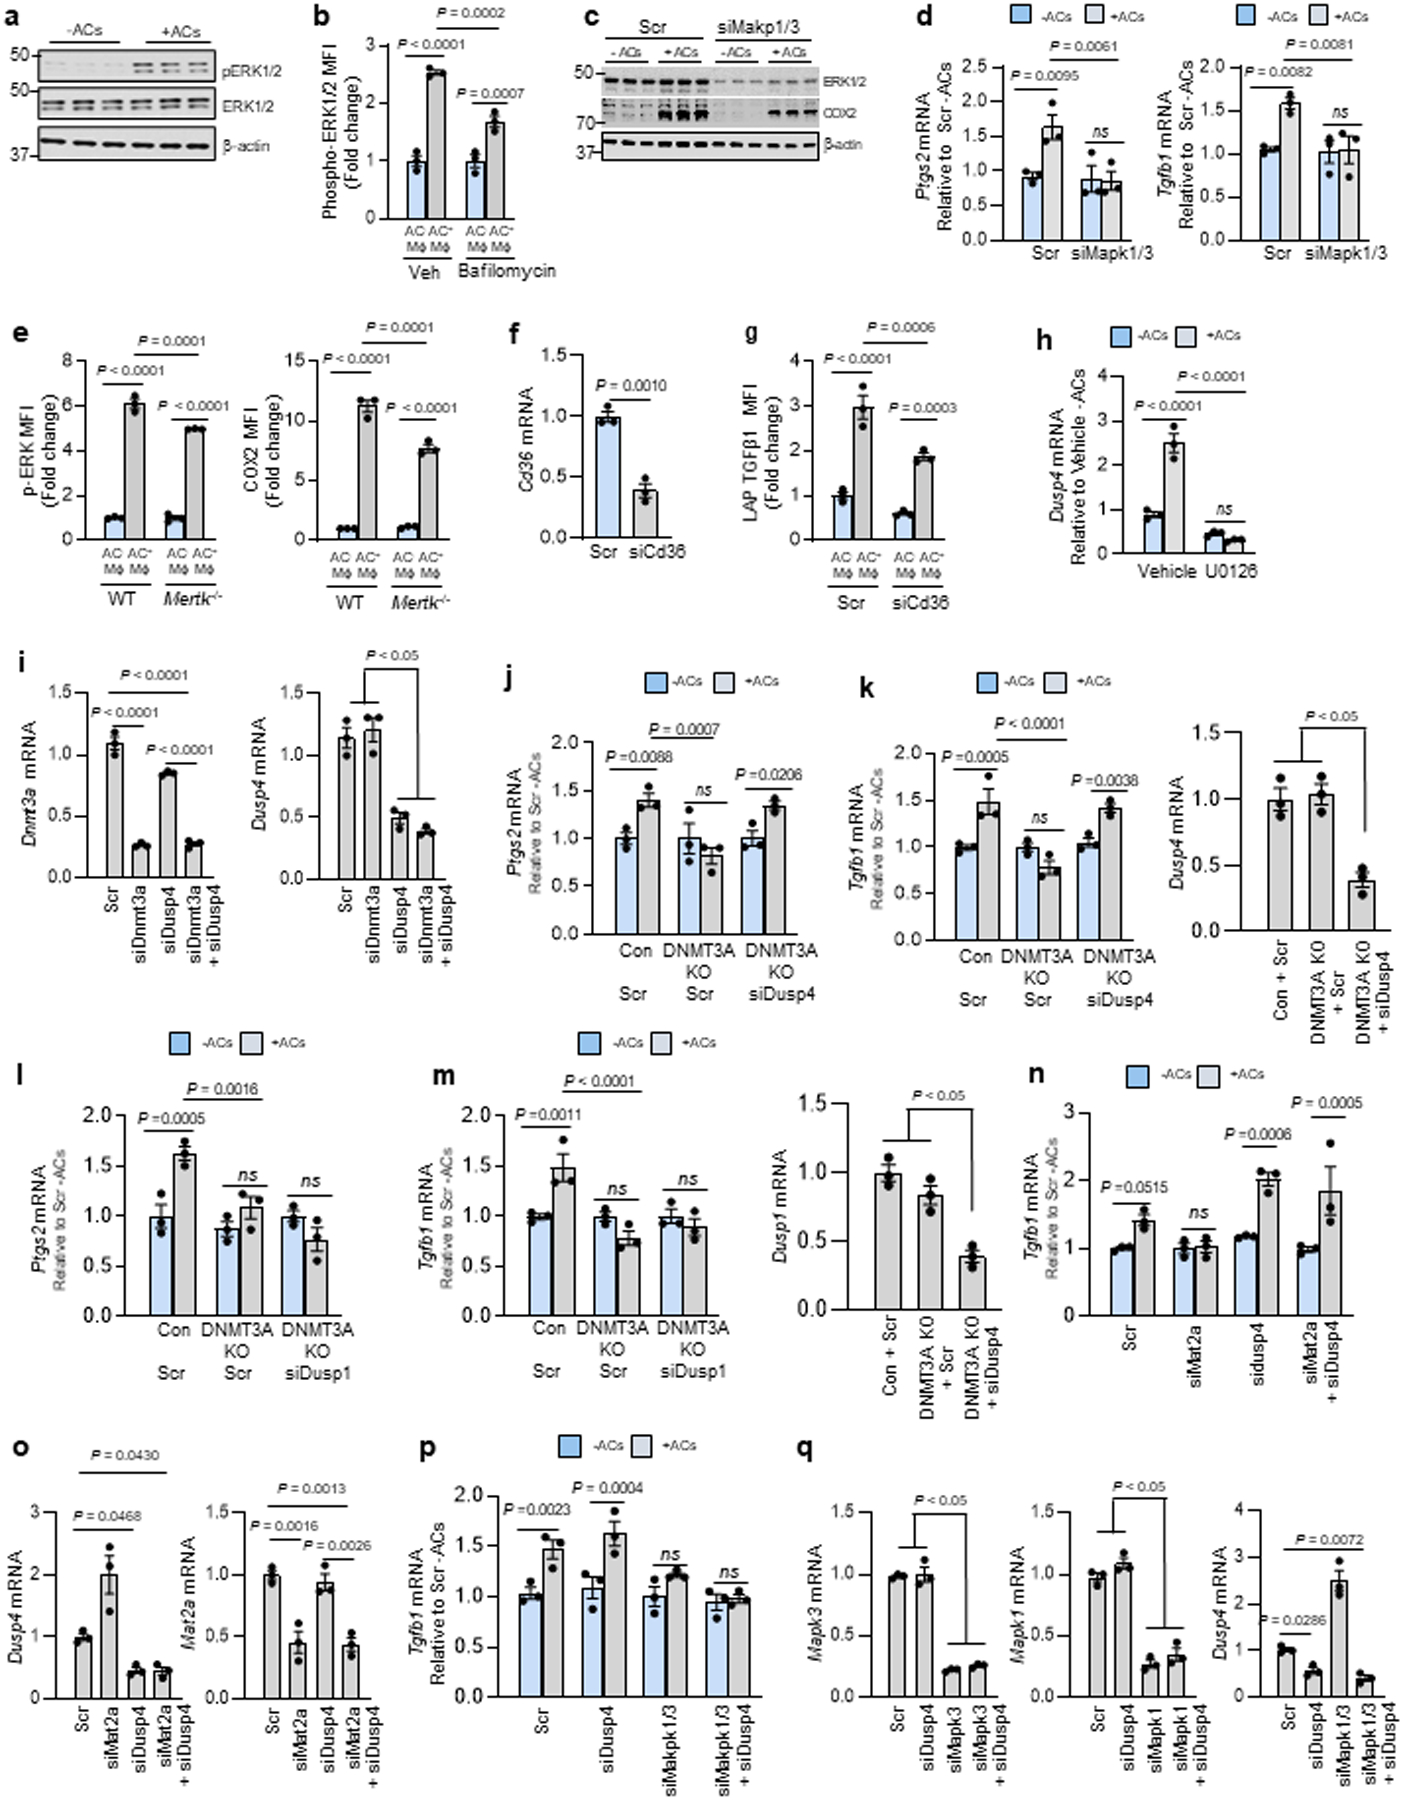
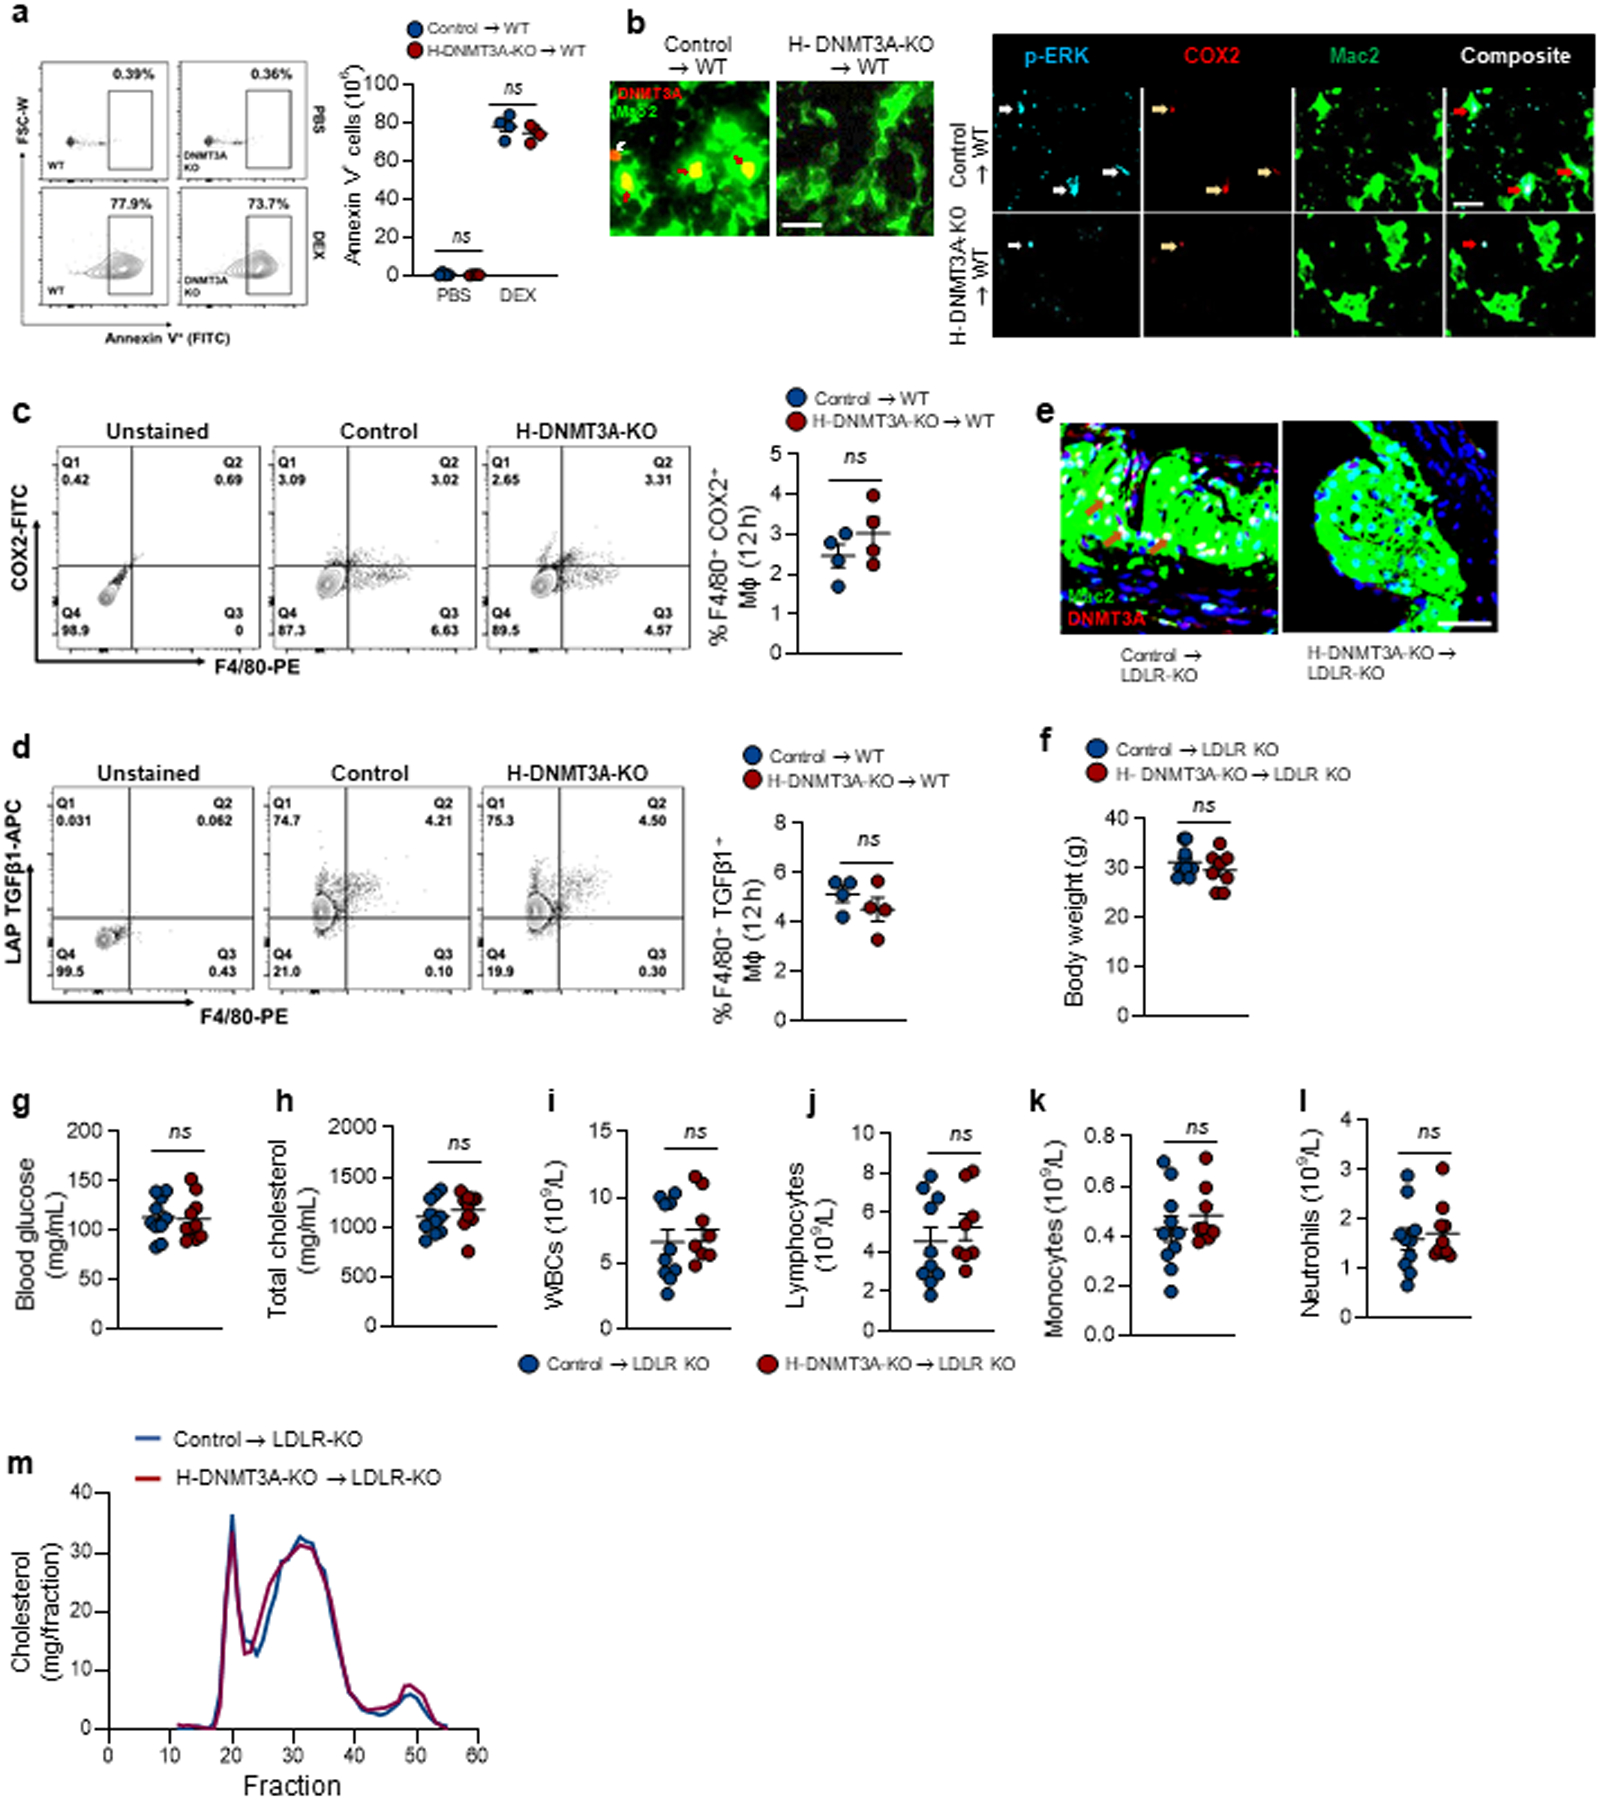
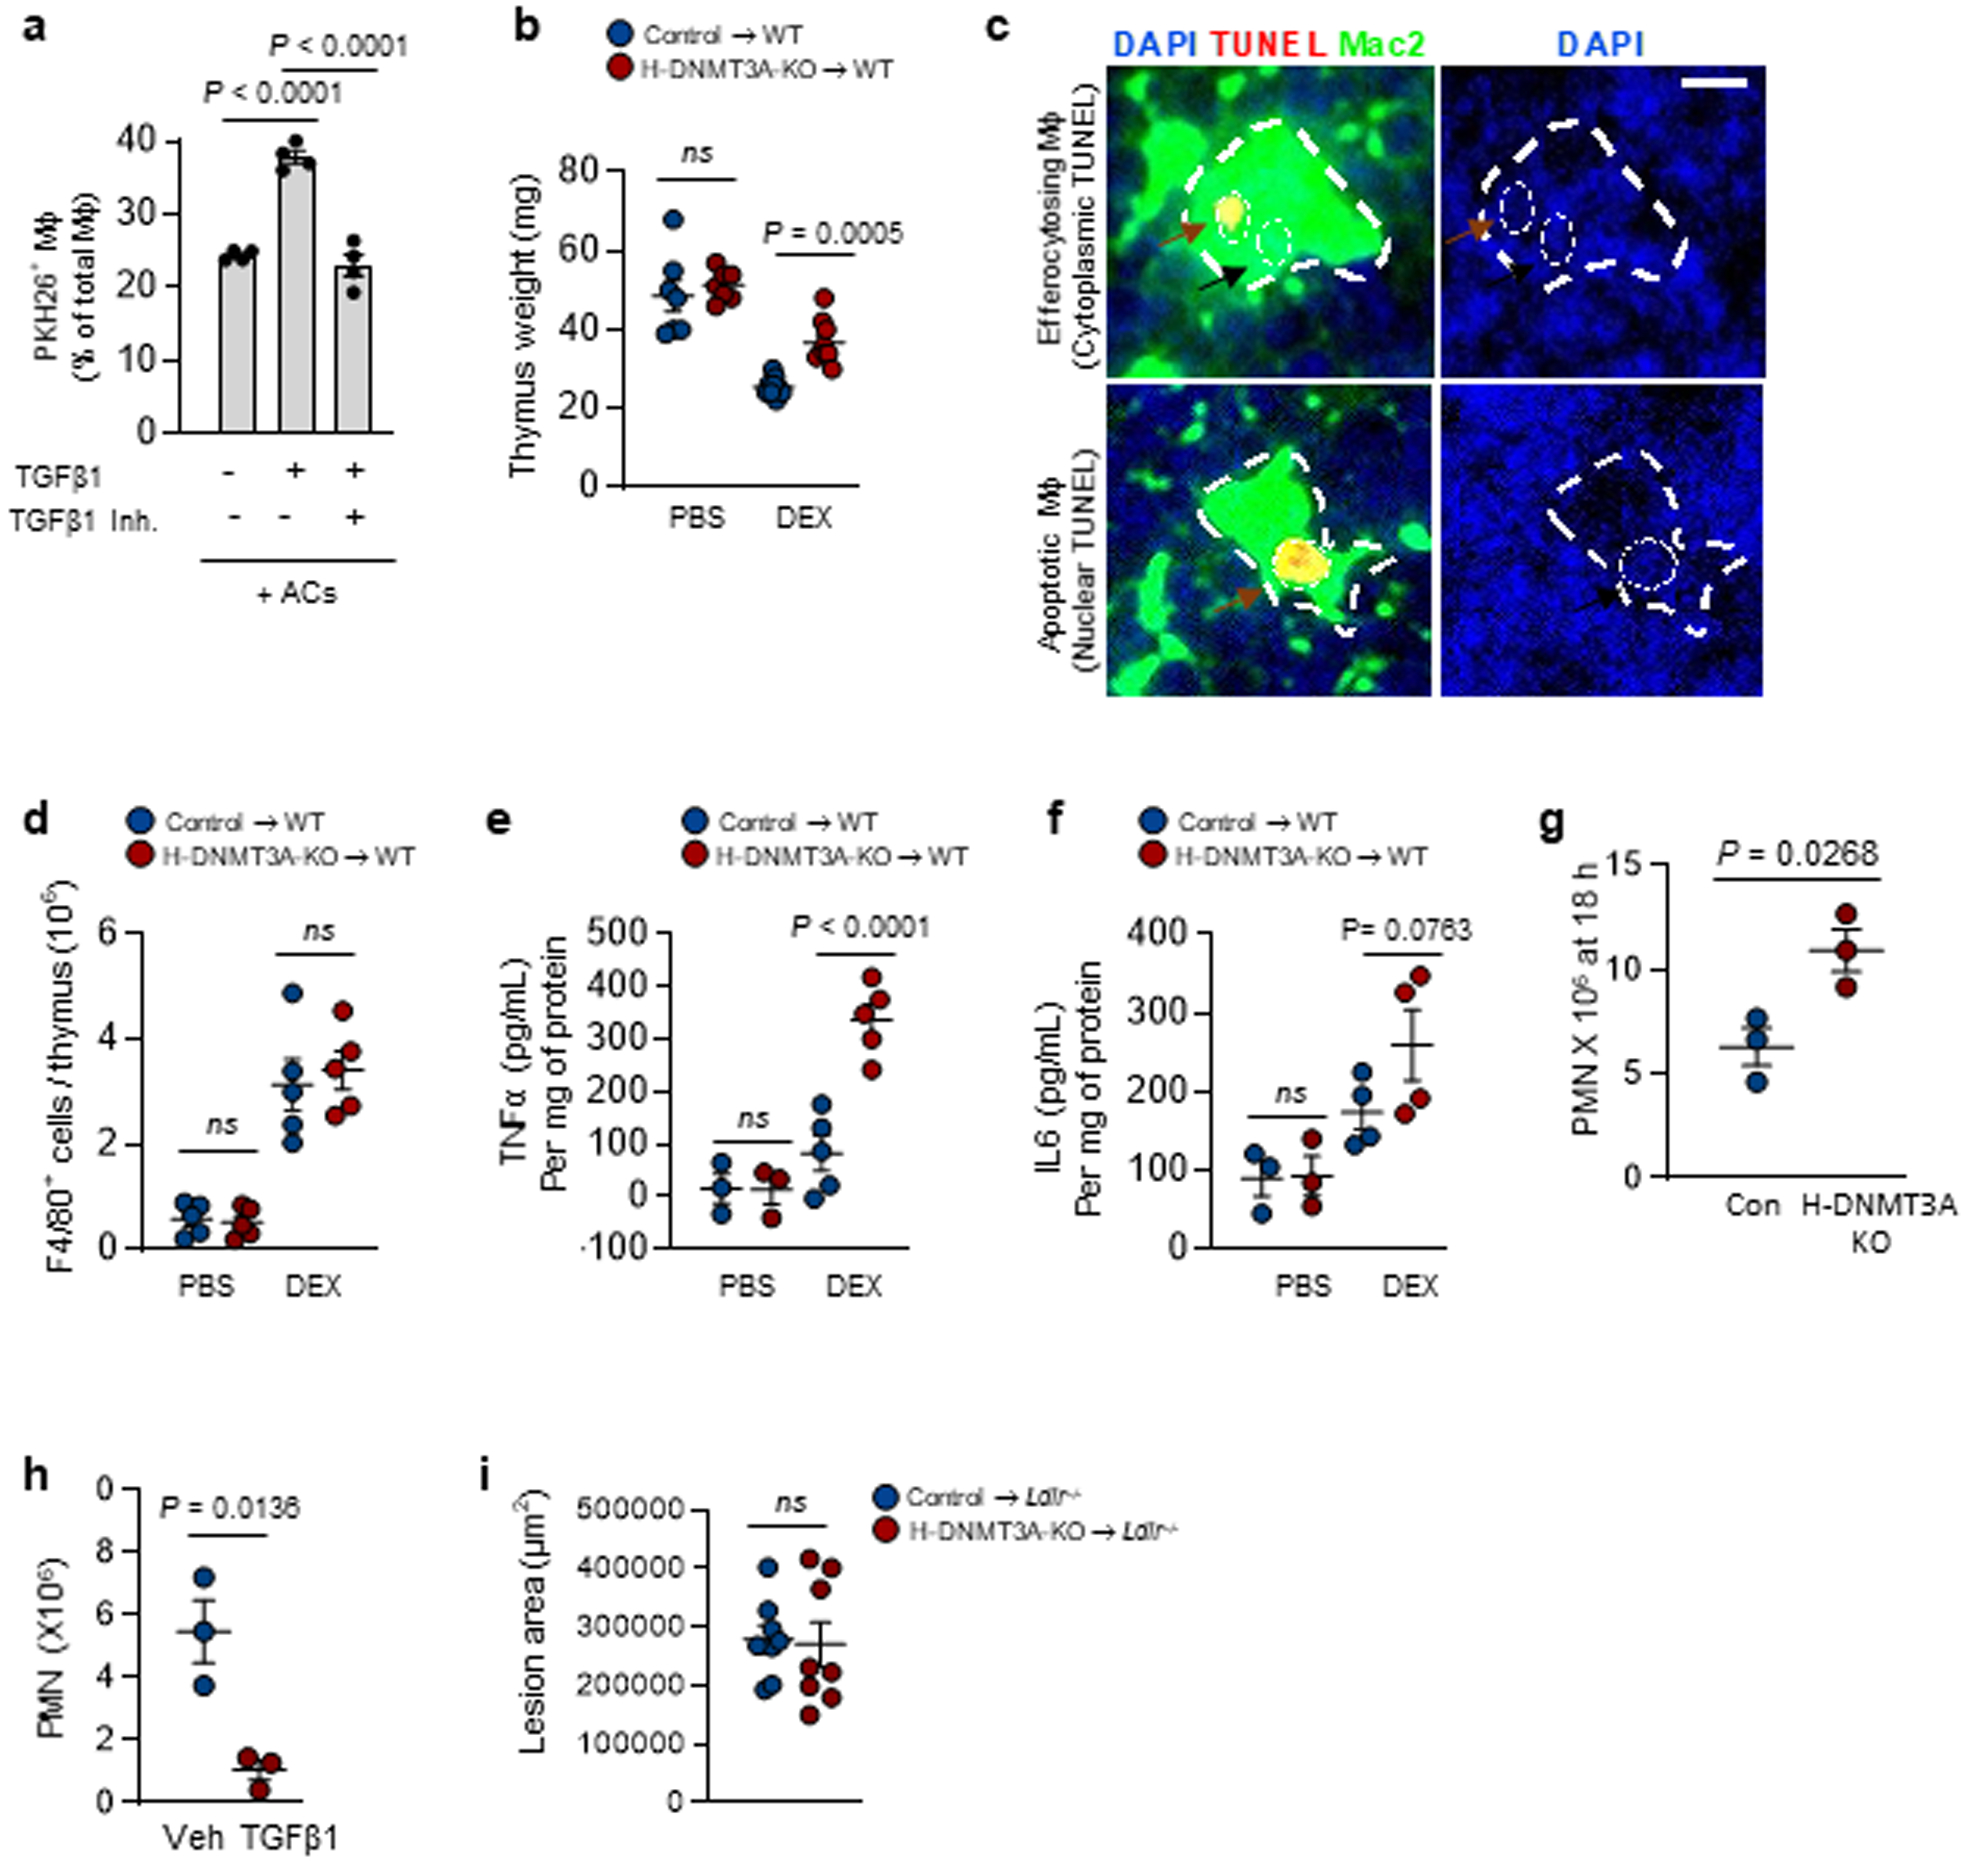
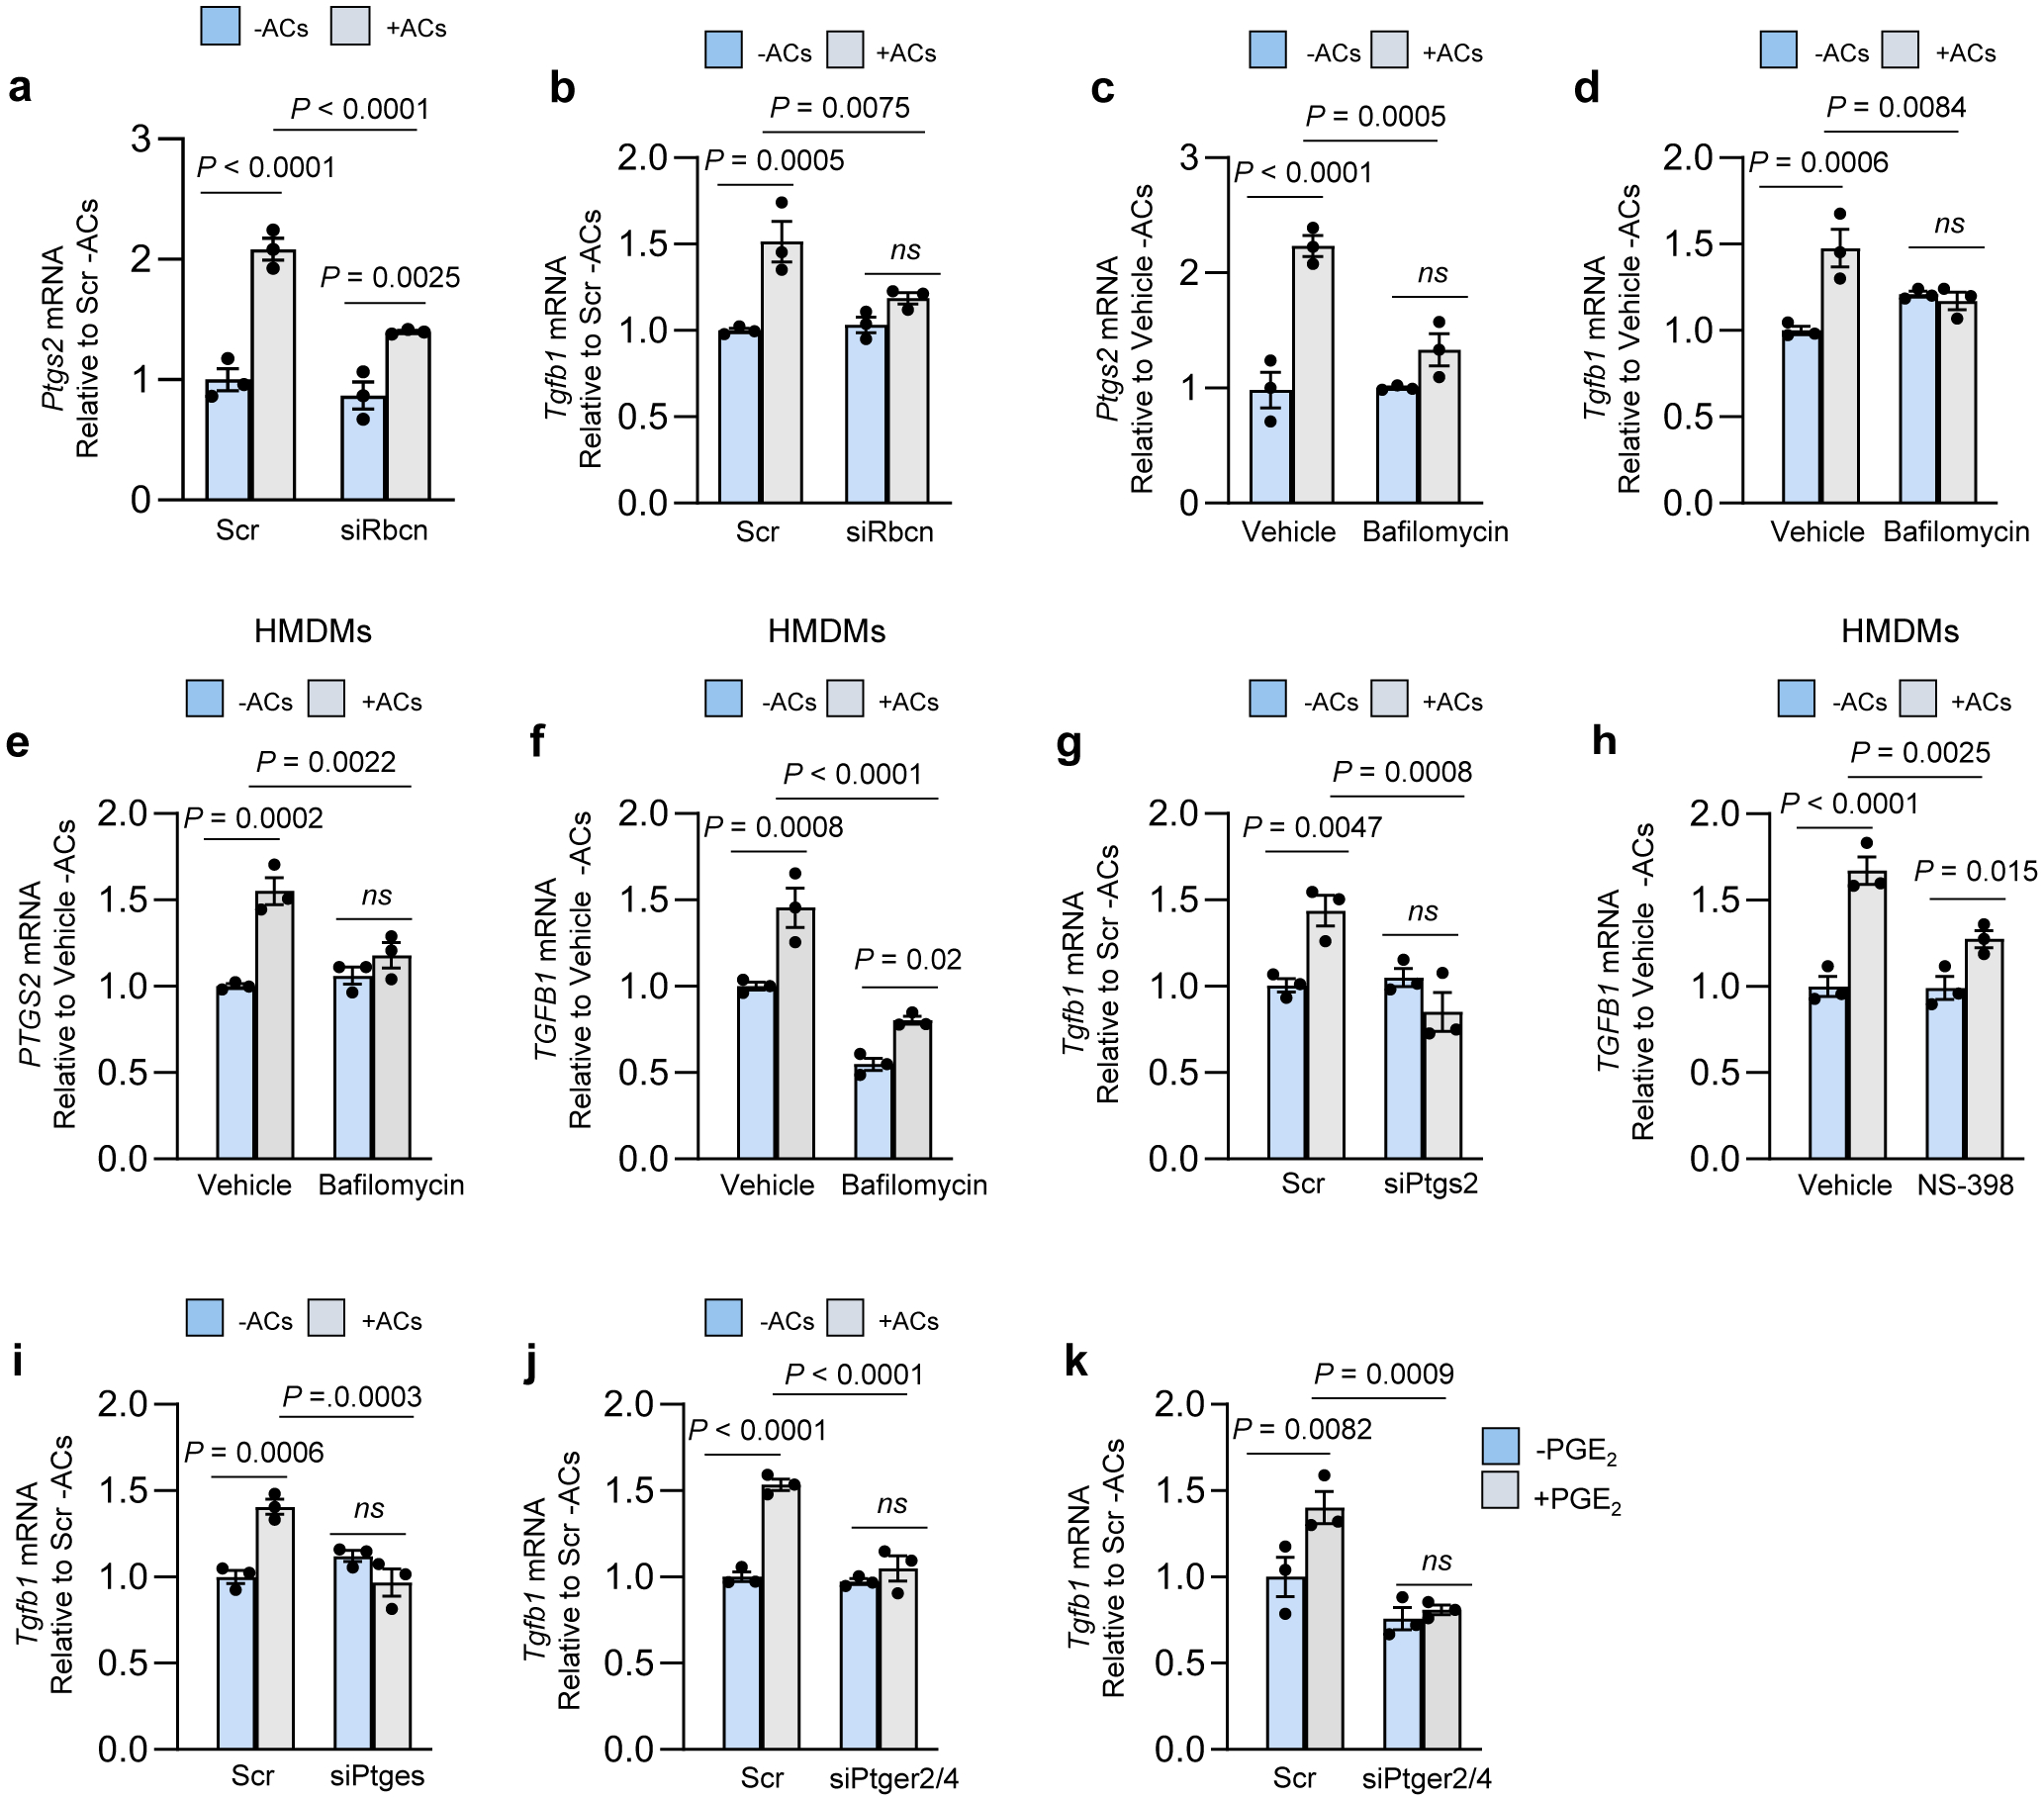
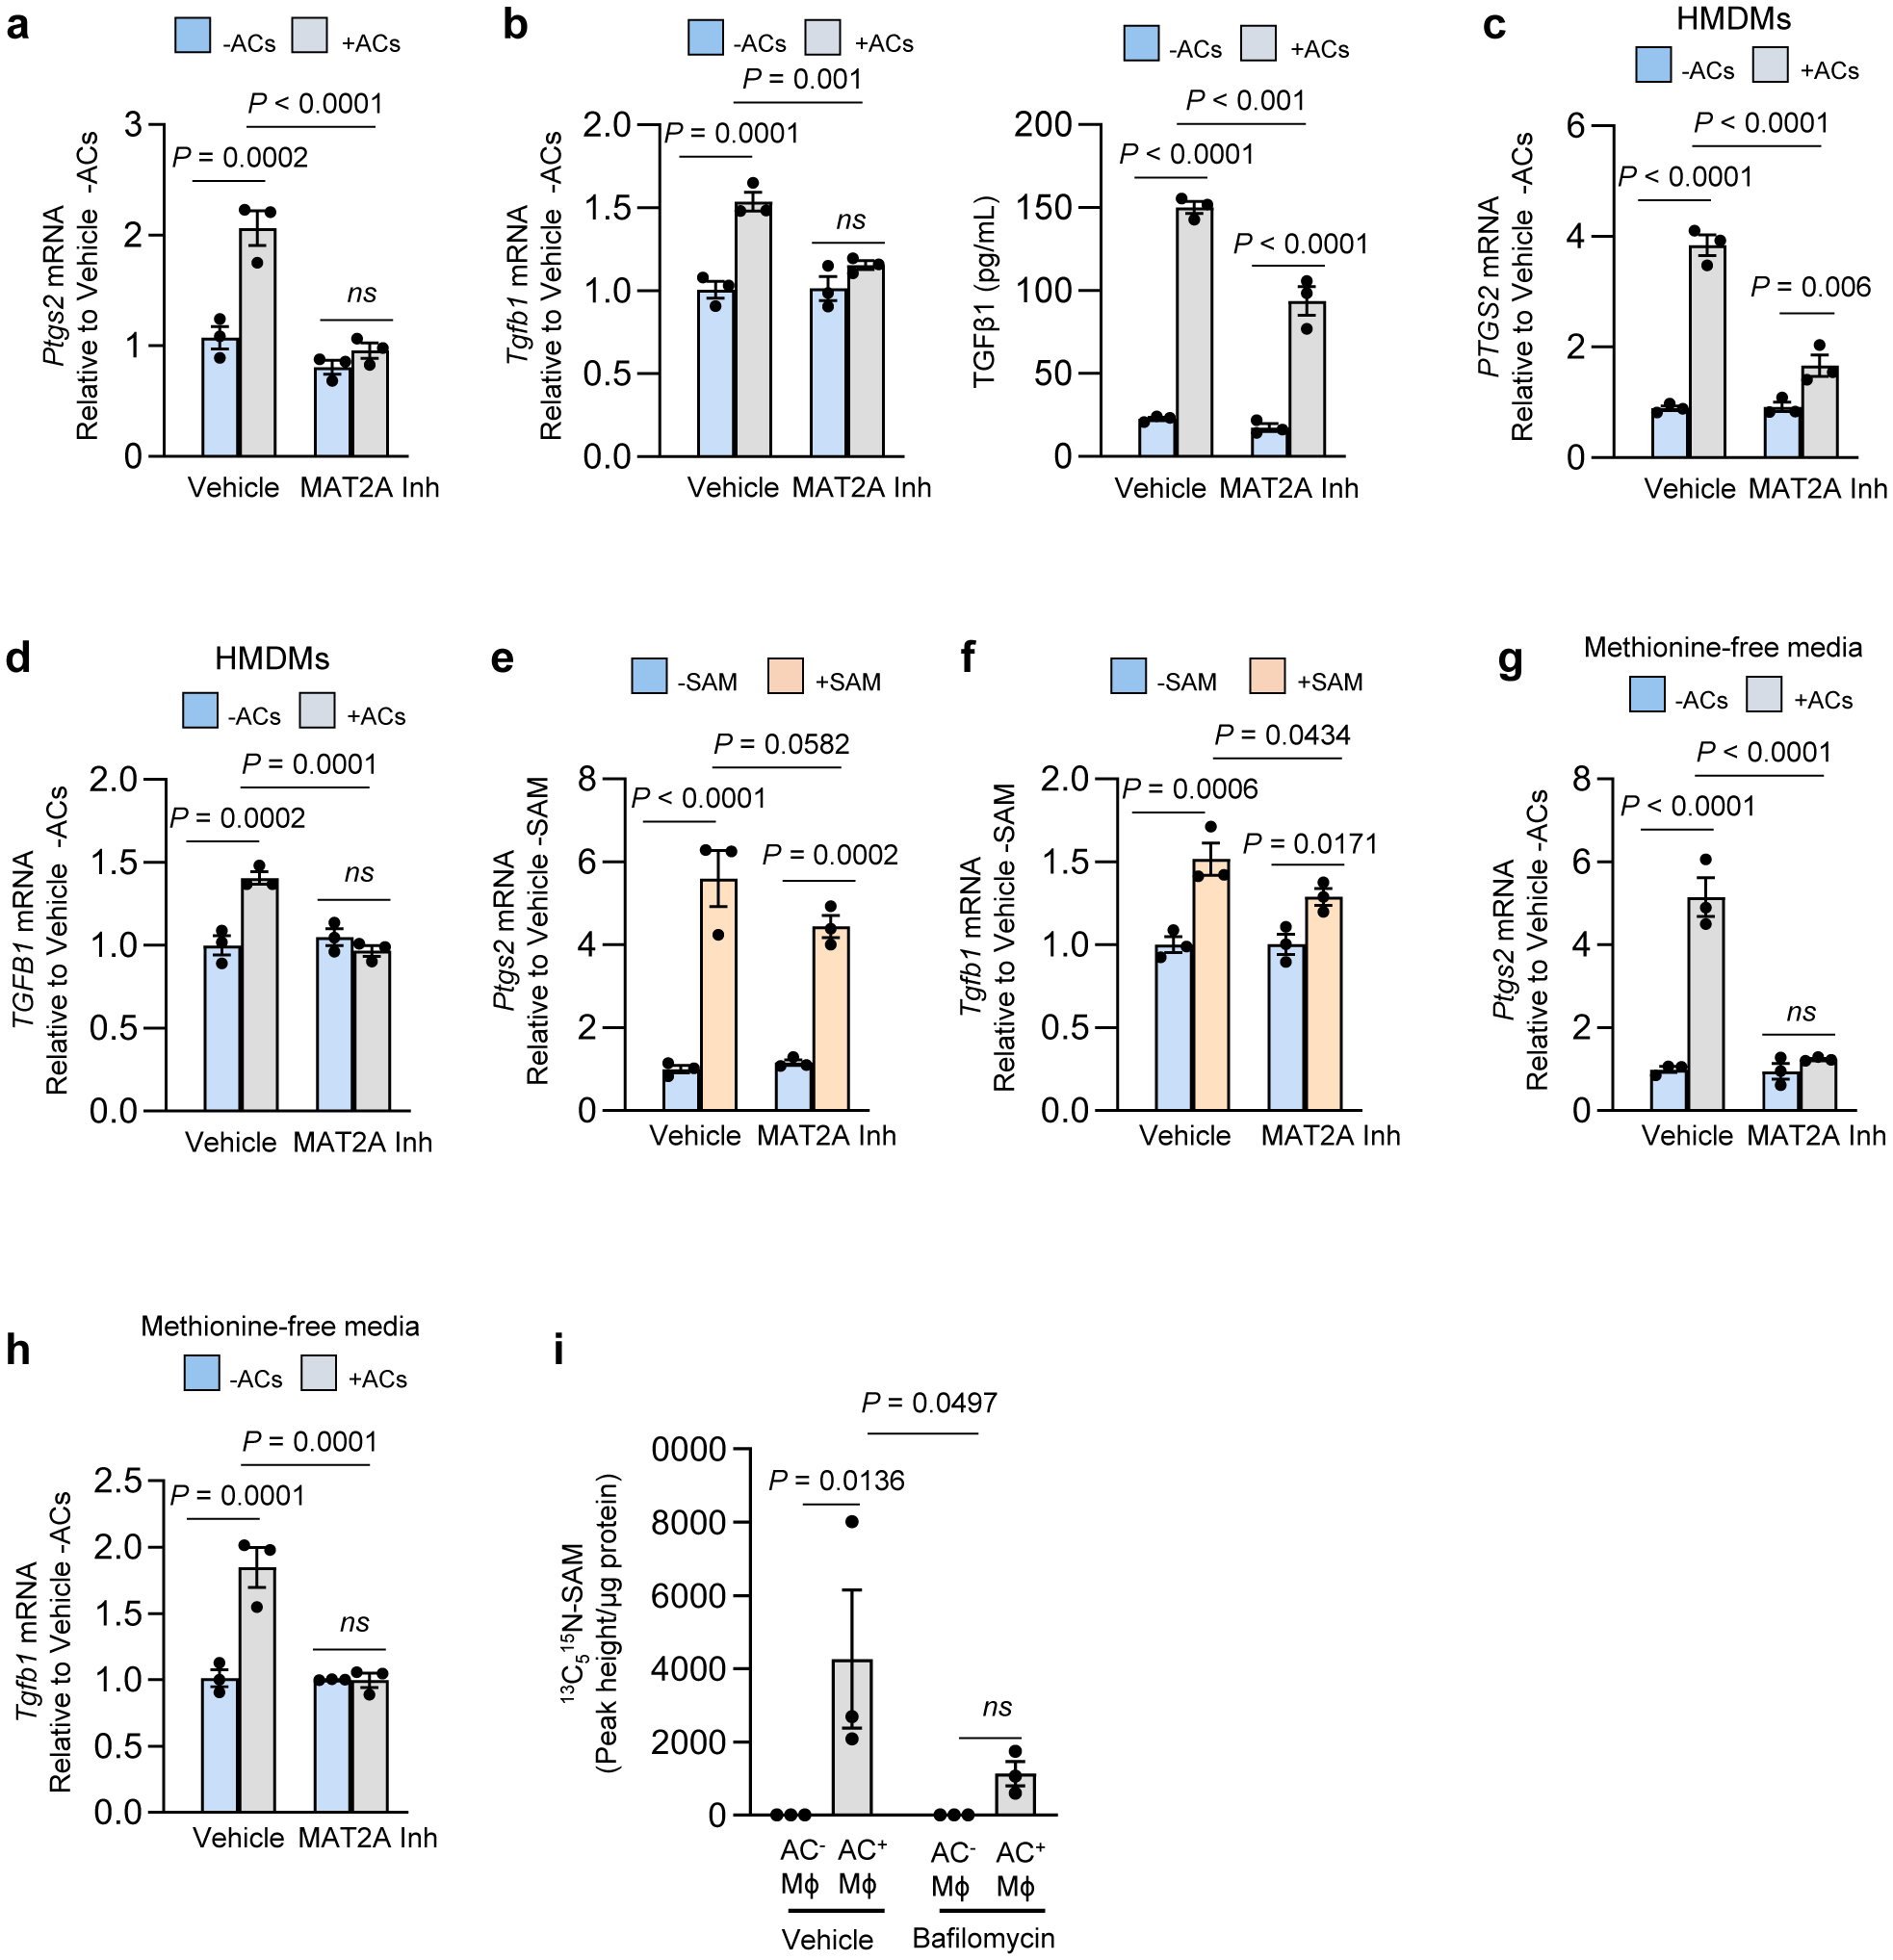
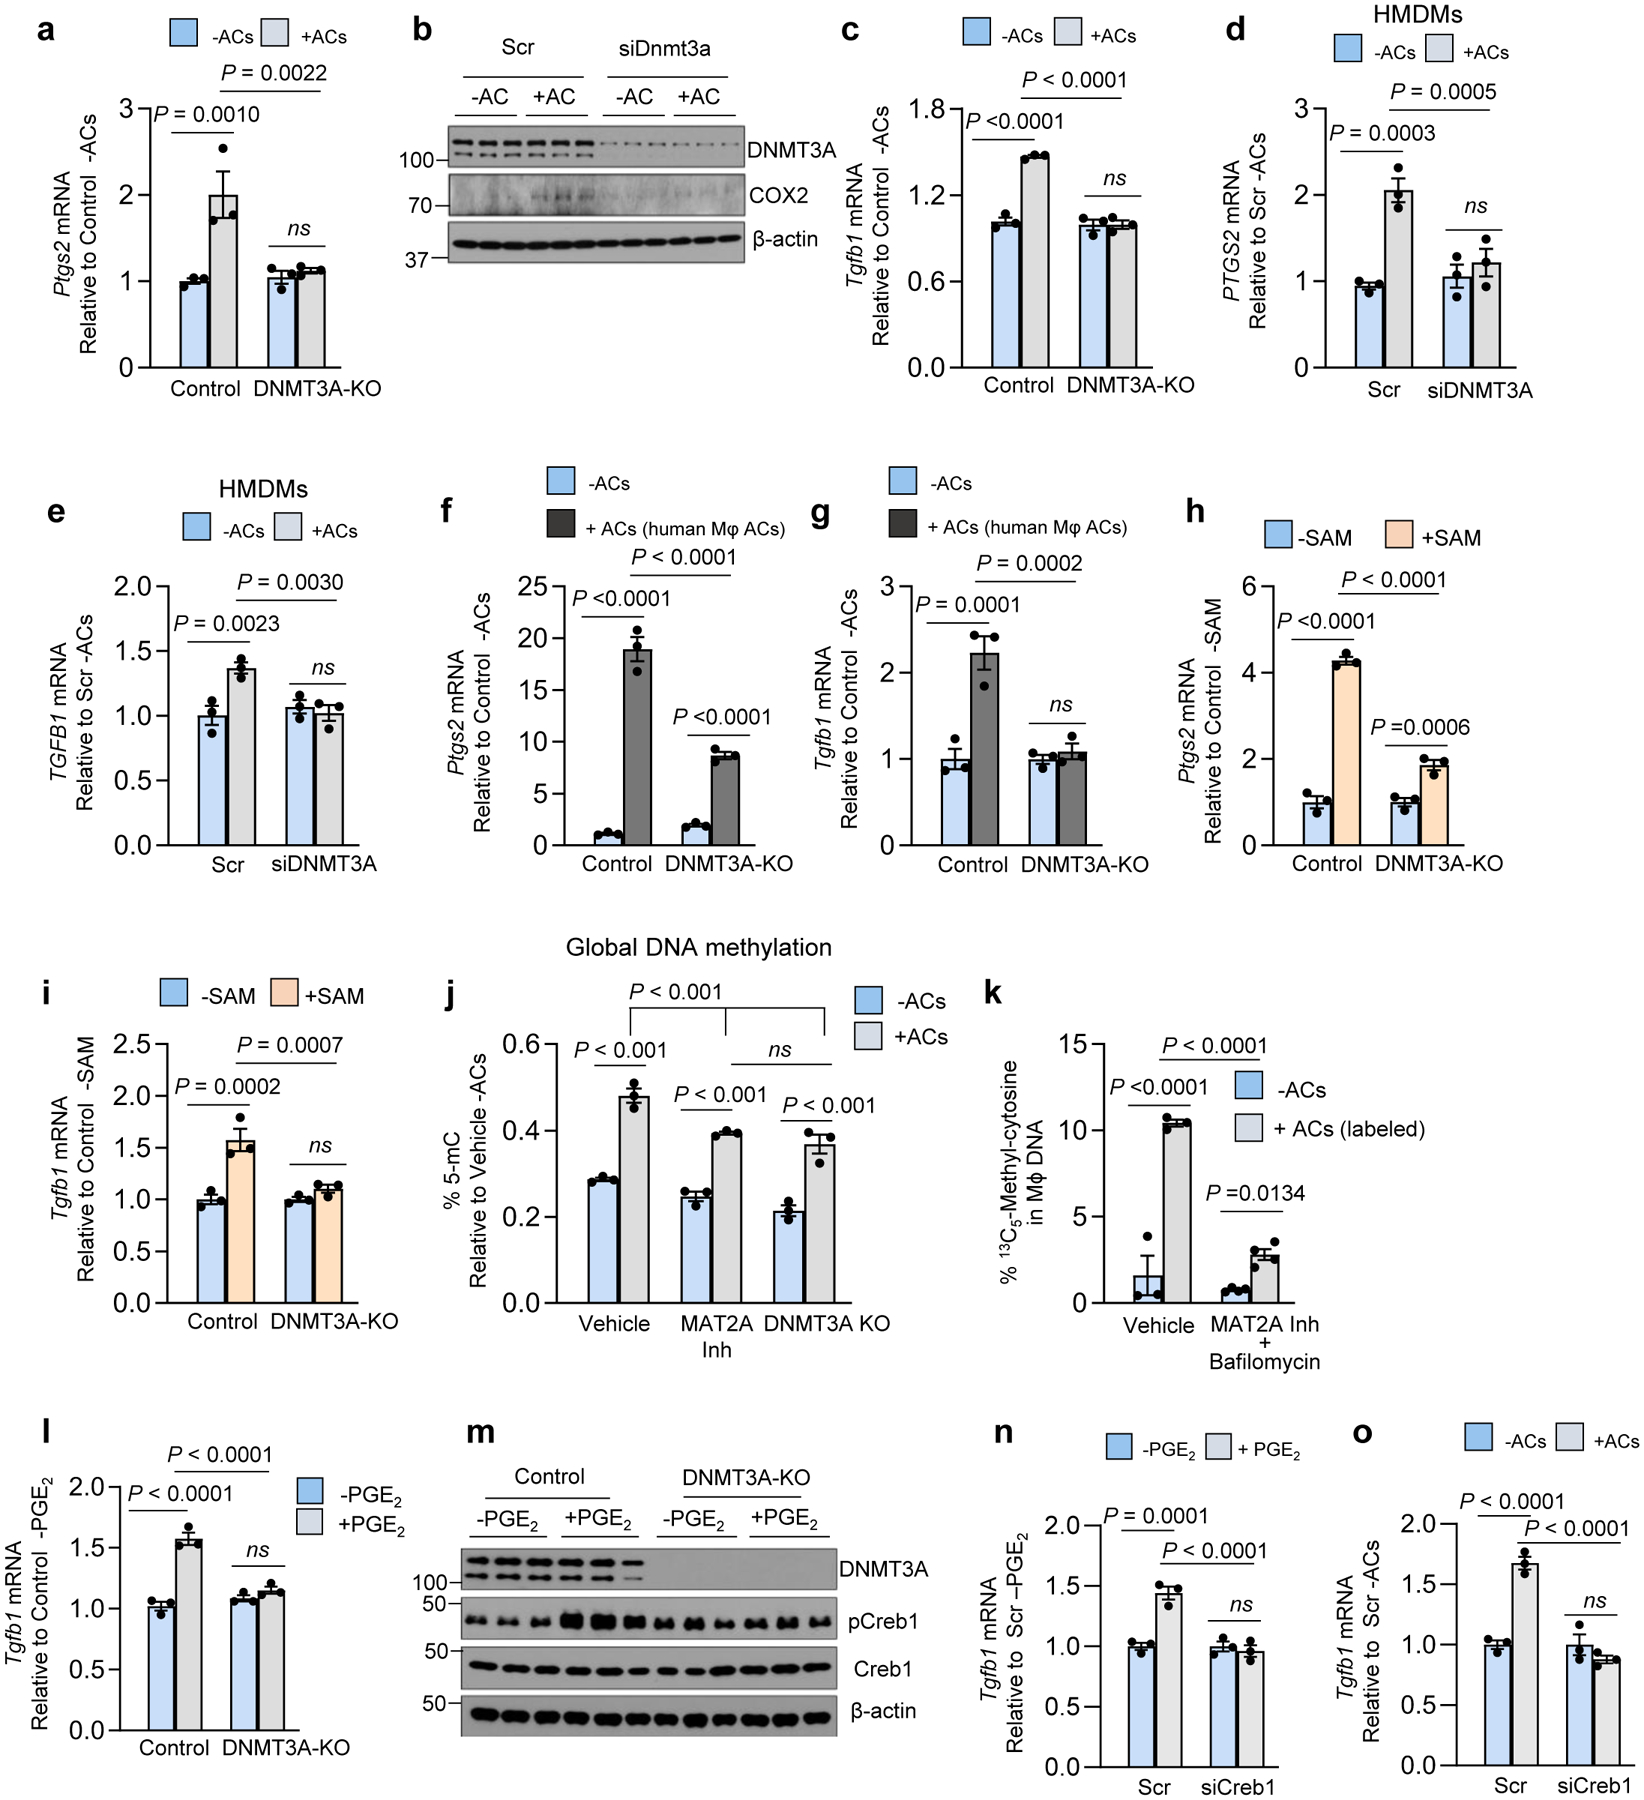
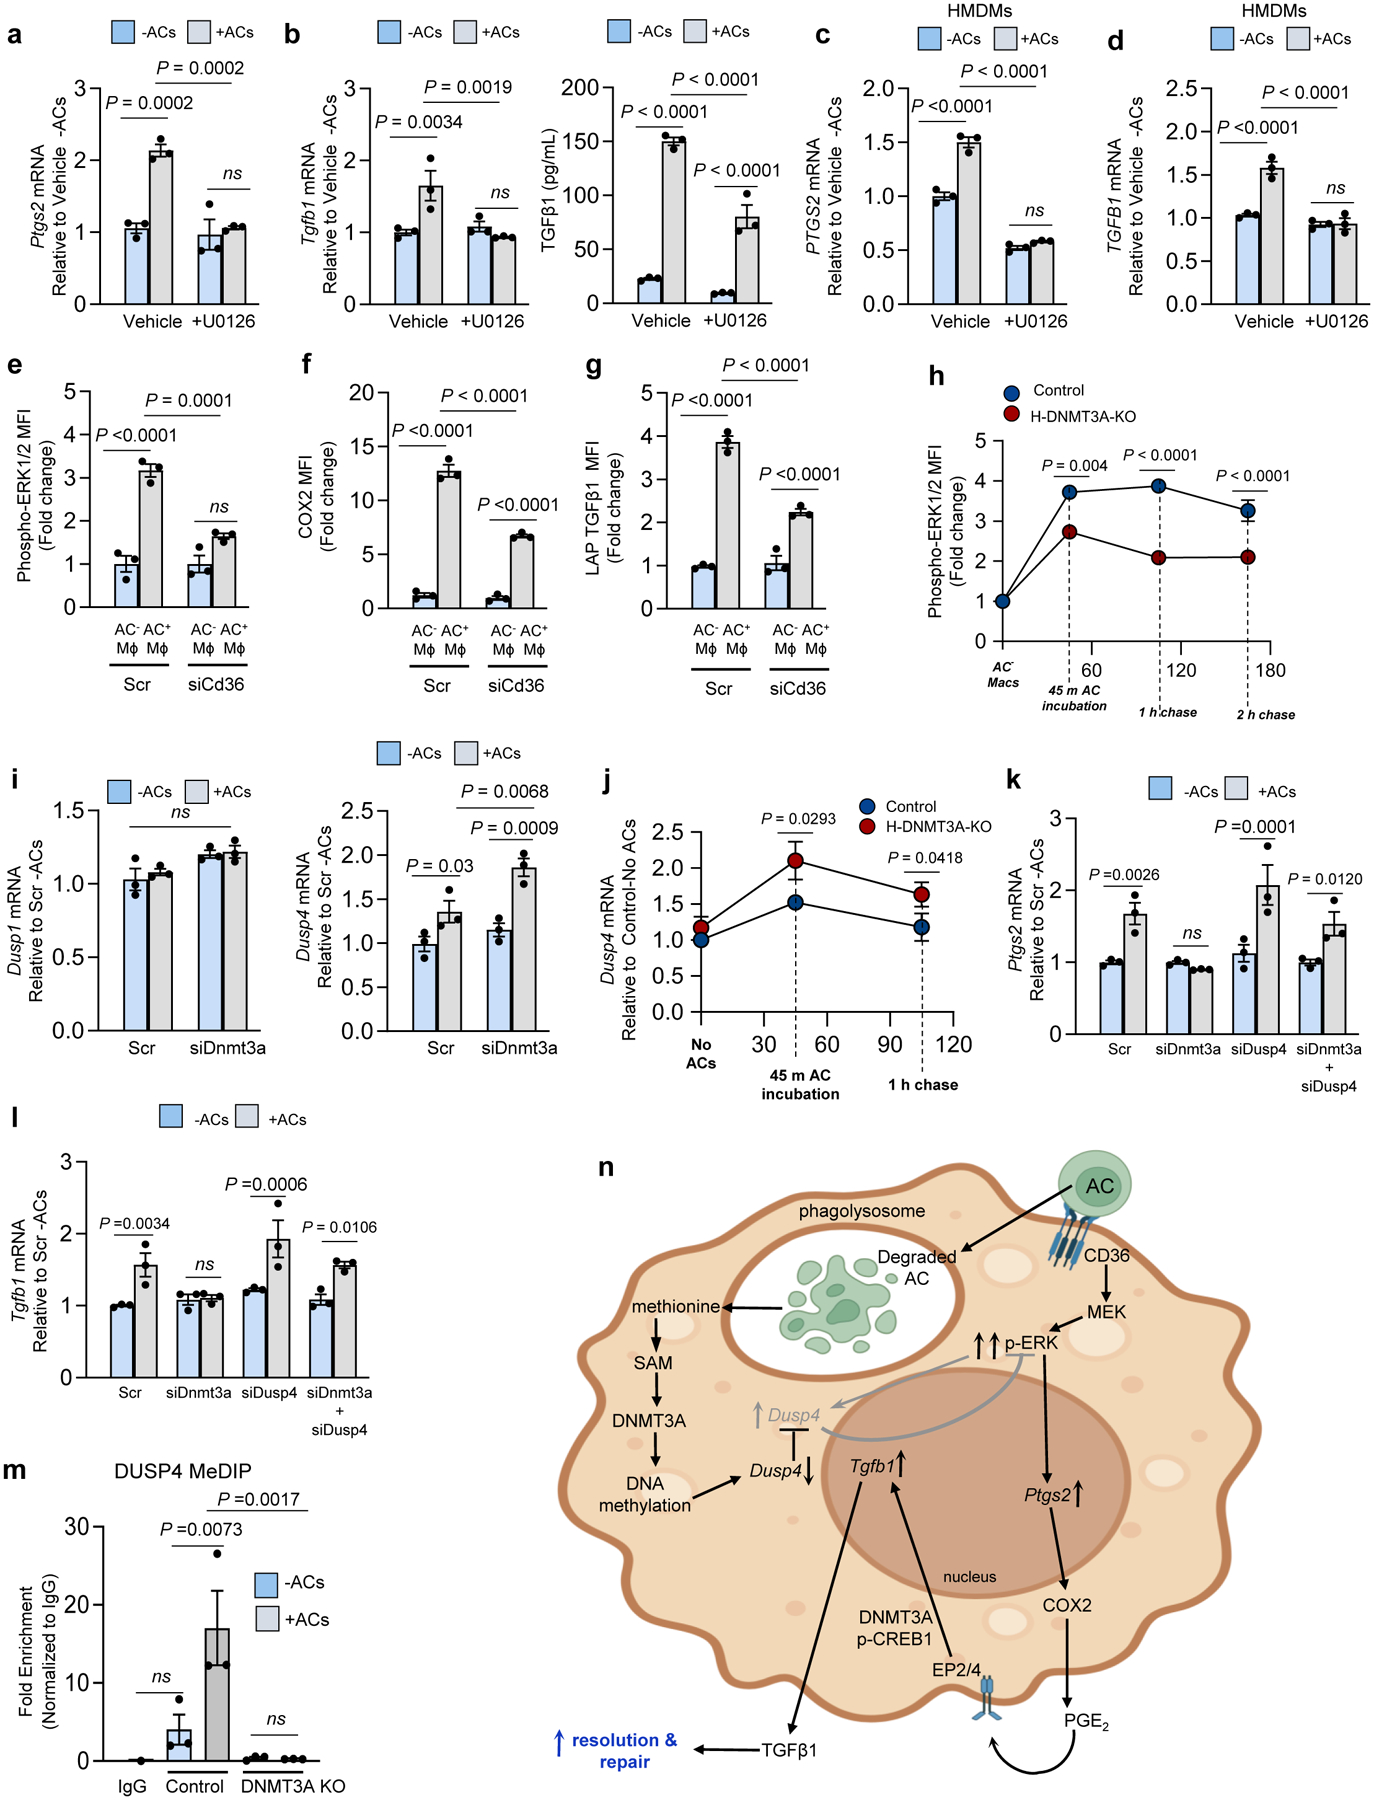
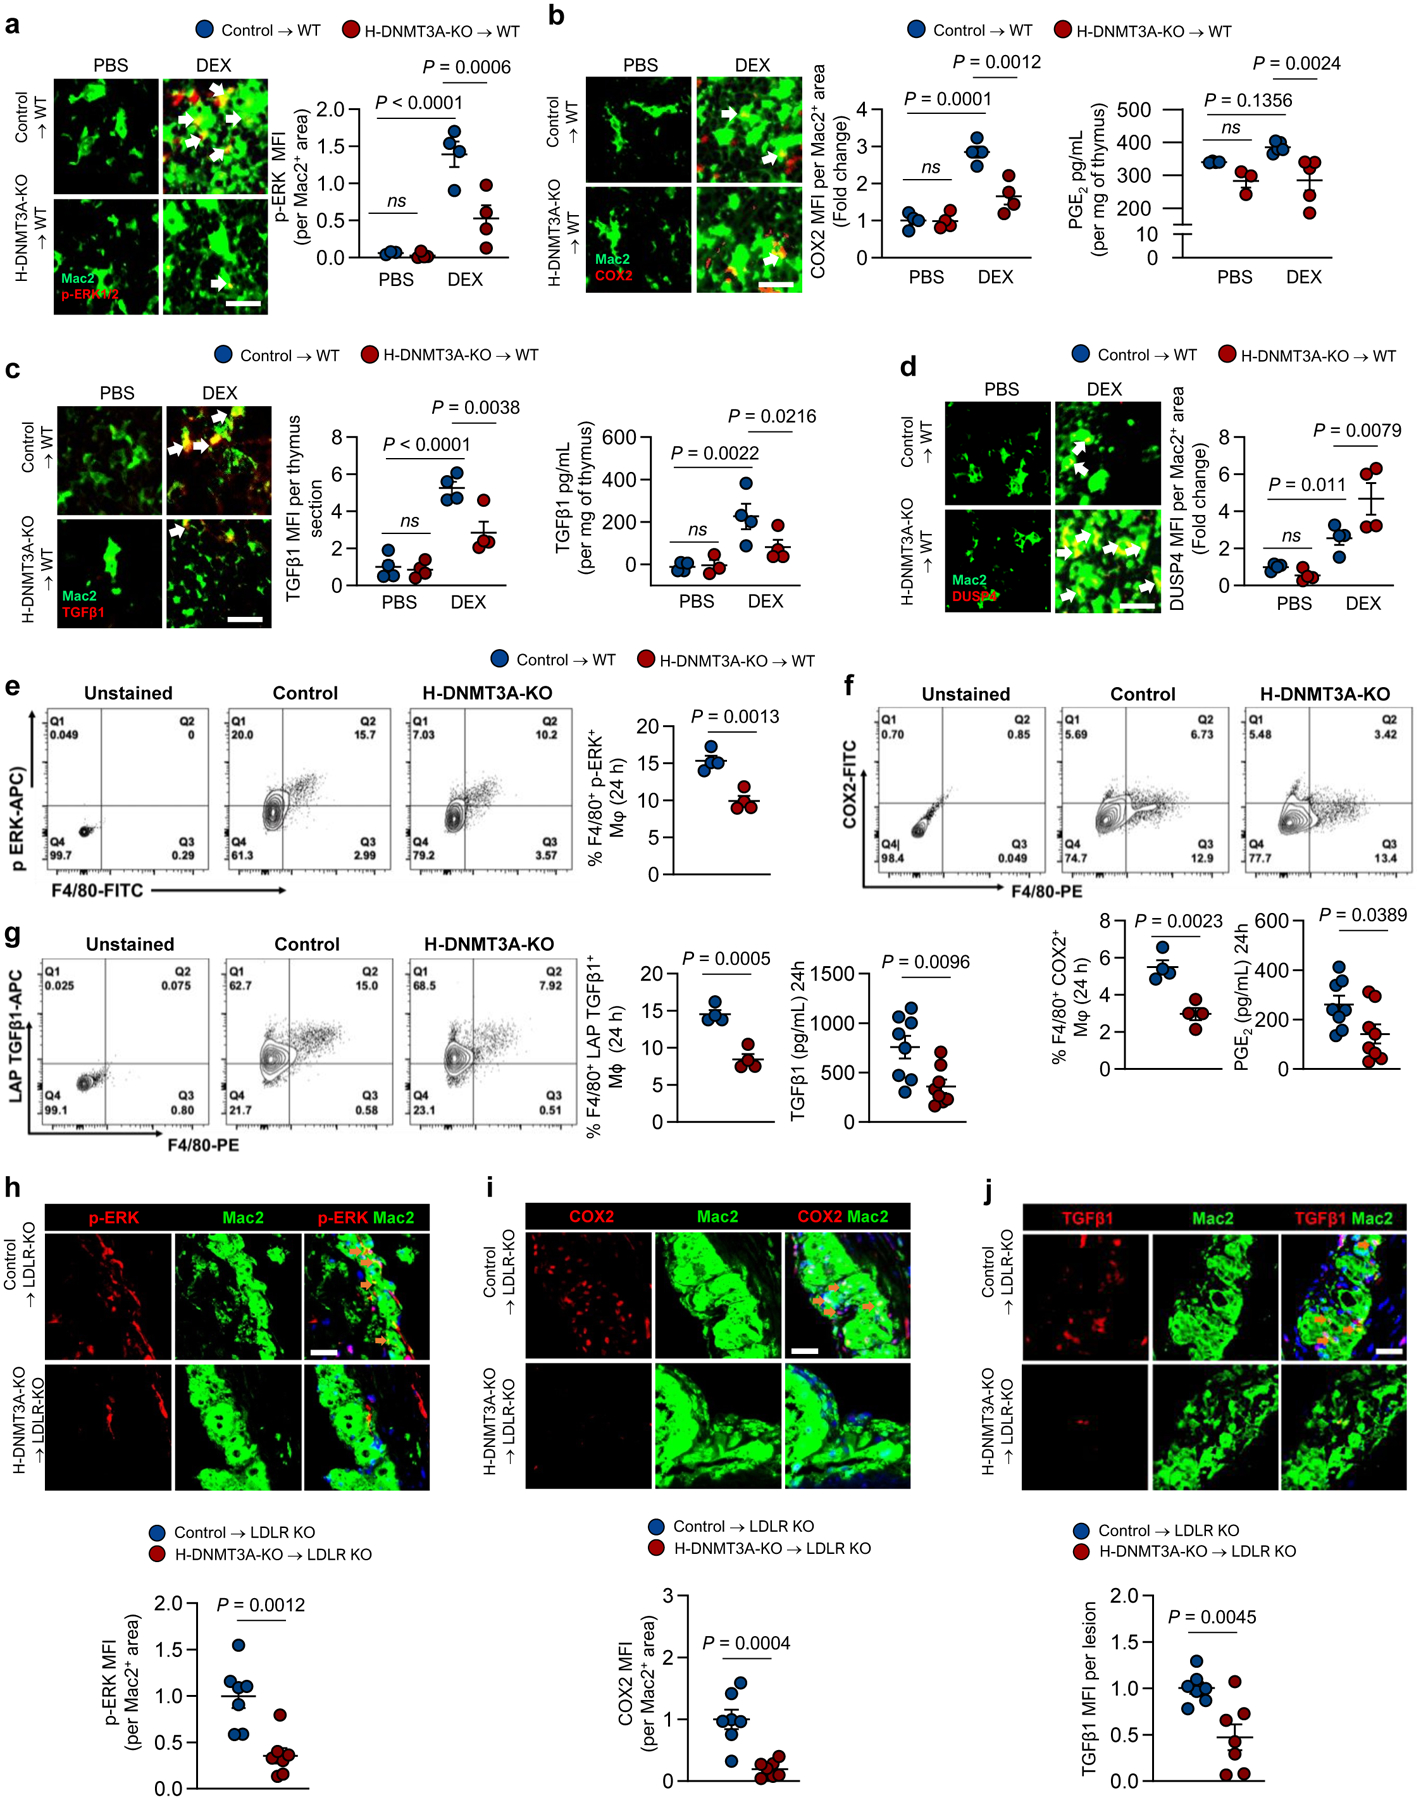
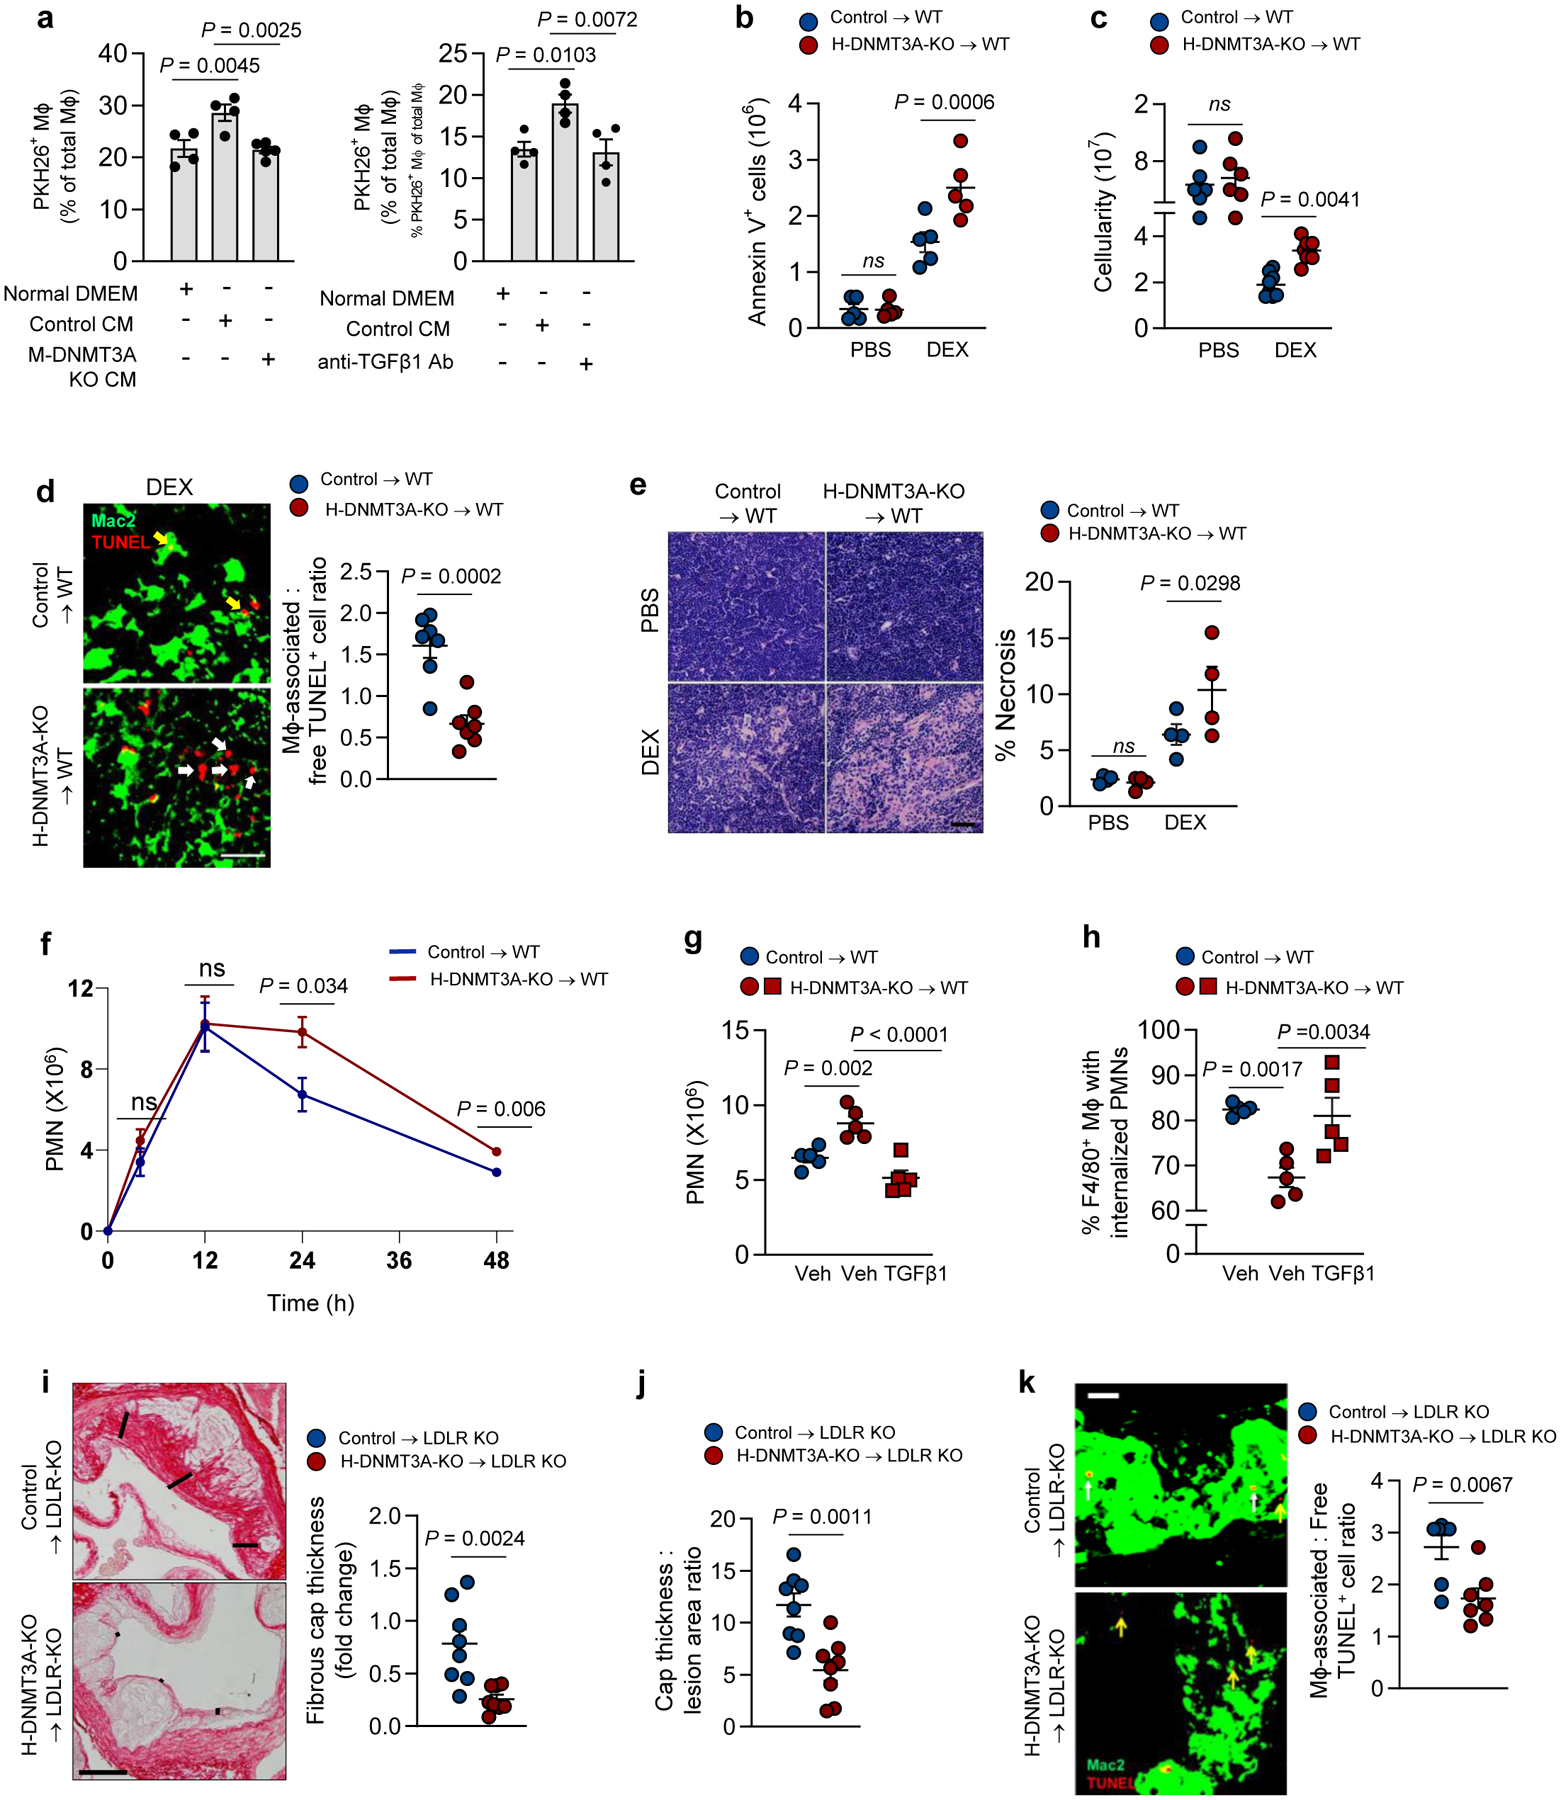
Efferocytosis, the clearance of apoptotic cells (ACs) by macrophages, is critical for tissue resolution, with defects driving many diseases. Mechanisms of efferocytosis-mediated resolution are incompletely understood. Here, we show that AC-derived methionine regulates resolution through epigenetic repression of the extracellular signal-regulated kinase 1/2 (ERK1/2) phosphatase Dusp4. We focus on two key efferocytosis-induced pro-resolving mediators, prostaglandin E2 (PGE2) and transforming growth factor beta 1 (TGF-β1), and show that efferocytosis induces prostaglandin-endoperoxide synthase 2/cyclooxygenase 2 (Ptgs2/COX2), leading to PGE2 synthesis and PGE2-mediated induction of TGF-β1. ERK1/2 phosphorylation/activation by AC-activated CD36 is necessary for Ptgs2 induction, but this is insufficient owing to an ERK-DUSP4 negative feedback pathway that lowers phospho-ERK. However, subsequent AC engulfment and phagolysosomal degradation lead to Dusp4 repression, enabling enhanced p-ERK and induction of the Ptgs2-PGE2-TGF-β1 pathway. Mechanistically, AC-derived methionine is converted to S-adenosylmethionine, which is used by DNA methyltransferase-3A (DNMT3A) to methylate Dusp4. Bone-marrow DNMT3A deletion in mice blocks COX2/PGE2, TGF-β1, and resolution in sterile peritonitis, apoptosis-induced thymus injury and atherosclerosis. Knowledge of how macrophages use AC-cargo and epigenetics to induce resolution provides mechanistic insight and therapeutic options for diseases driven by impaired resolution.


Conflict of interest statement

Competing interests

The authors declare no competing interests.

Figures

Extended Data Fig. 1
Extended Data Fig. 1. Additional experiments documenting the efferocytosis-Ptgs2/COX2-TGFβ1 pathway in macrophages. Related to Fig. 1.a–d
BMDMs were incubated ± ACs, after which noninternalized ACs were removed by rinsing. The cells were assayed for Ptgs2 mRNA after an additional 1 h incubation and COX2 protein after 3 h (a); PGE2 in the media after 3 h (b); and TGFβ1 in the media after 18 h (c). For (d), experiments similar to those in panel a were analyzed for mouse and human Ptgs2/PTGS2 or Tgfb1/TGFβ1 mRNA to prove that mRNA being measured is not residual human mRNA derived from human apoptotic Jurkat cells. e, BMDMs were transfected with scrambled RNA (Scr) or siRbcn and then, after 72 h, assayed for Rbcn mRNA. f, BMDMs were transfected with Scr or siRbcn or treated with vehicle or bafilomycin A1 and then incubated with PKH26-labeled ACs for 45 min, followed by rinsing and quantification of percent PKH26+ macrophages of total macrophages. g, BMDMs were transfected with Scr or siPtgs2 and then, after 72 h, assayed for Ptgs2 mRNA. h, BMDMs were incubated ± ACs for 45 min, after which noninternalized ACs were removed by rinsing. The cells were assayed for Ptges mRNA after an additional 1 h incubation (left). i, BMDMs were transfected with scrambled RNA (Scr) or siPtges and then, after 72 h, assayed for Ptges mRNA. j-k, BMDMs were transfected with Scr, siPtger4, or siPtger2 and then, after 72 h, assayed for Ptger4 or Ptger2 mRNA, respectively. l, BMDMs were transfected with Scr or siTgfb1. After 72 h, the cells were incubated ± ACs for 45 min, after which noninternalized ACs were removed by rinsing. After an additional 1 h of incubation, the cells were assayed for Ptgs2 mRNA. m, BMDMs were transfected with Scr or siTgfb1 and then, after 72 h, assayed for Tgfb1 mRNA. All mRNA data are expressed relative to the first control group. Values are means ± SEM. ns, not significant (P > 0.05); n = 3 biological replicates. Two-sided P values were determined by a Student’s t-test for two groups or one-way ANOVA with Fisher’s LSD posthoc analysis for three or more groups.
Extended Data Fig. 2
Extended Data Fig. 2. Additional experiments documenting the role of SAM in the efferocytosis-Ptgs2/COX2-TGFβ1 pathway. Related to Fig. 2
All AC incubations were 45 min, and Ptgs2 or Tgfb1 were assayed 1 or 6 h after AC removal, respectively. a, BMDMs pretreated 2 h with vehicle or the MAT2A inhibitor PF9366 were incubated with pHrodo-labeled ACs and quantified for the percent pHrodo-AC+ macrophages. Scale bar, 50 μm. b-c, BMDMs treated with scrambled RNA (Scr) or siMat2a were incubated ± ACs and then assayed for Ptgs2 orTgfb1. d, BMDMs treated with Scr or siMat2a were assayed for Mat2a. e, BMDMs treated with vehicle or SAM were assayed for SAM content. f, BMDMs cultured in methionine-free media with D-FBS and pretreated for 2 h with vehicle or bafilomycin A1 (Baf) were incubated 1 h with PKH26-labeled ACs whose proteins were labeled with 13C515N-methionine. AC+ and AC macrophages were sorted and assayed for SAM content (g) and percent 13C515N-SAM of total SAM (h). i, Control or DNMT3A-KO BMDMs were incubated with PKH26-labeled ACs and then quantification for the percent PKH26-AC+ macrophages. Scale bar, 50 μm. j, Control and DNMT3A-KO BMDMs were immunoblotted for DNMT3A and β-actin. k, HMDMs treated with Scr or siDNMT3A were assayed for DNMT3A. l, BMDMs were incubated with IgG-coated RBCs for 45 min and then assayed 3 h later for COX2 MFI by flow cytometry. m-n, Control and DNMT3A-KO BMDMs treated with LPS or LPS + IFNγ for 4 h were assayed for Il6, Ptgs2, or COX2 (n). o-p, BMDMs treated with Scr or siDnmt3a were incubated for 4 h with vehicle and LPS + IFNγ or IL4 and assayed for Nos2 or Arg1. q, Control and DNMT3A-KO BMDMs were incubated ± ACs for 45 min and then assayed for SAM. r, BMDMs pretreated for 2 h with vehicle or bafilomycin A1 were incubated ± ACs whose proteins were labeled with 13C515N-methionine and then assayed 1 h after AC removal for 13C5-methylcytosine in DNA. s, BMDMs treated with Scr or siCreb1 were assayed for Creb1. All mRNA data are expressed relative to the first control group. Values are means ± SEM. n.s., not significant (P > 0.05); n = 3 biological replicates for all bar graphs except i (n = 6). Two-sided P values were determined by the Student’s t-test for two groups or one-way ANOVA with Fisher’s LSD posthoc analysis for three or more groups.
Extended Data Fig. 3
Extended Data Fig. 3. Experiments documenting the role of ERK, CD36, and DUSP4 in the efferocytosis-Ptgs2/COX2-TGFβ1 pathway. Related to Fig. 4
AC incubations were 45 min, and Ptgs2 or Tgfb1 were assayed 1 or 6 h after AC removal, respectively. a, BMDMs incubated ± ACs were immunoblotted for p-ERK1/2, ERK1/2, and β-actin. b, BMDMs pretreated with vehicle or bafilomycin A1 were incubated ± PKH26-labeled ACs for 45 min and assayed by flow cytometry for p-ERK1/2 in PKH26+ (AC+) and PKH26 (AC) macrophages. c-d, BMDMs transfected with scrambled RNA (Scr) or siMapk1 and siMapk3 were incubated ± ACs for 45 min and immunoblotted for ERK1/2, COX2, and β-actin or assayed for Ptgs2 or Tgfb1. e, WT or MerTK-KO BMDMs were incubated with PKH26-labeled ACs and assayed by flow cytometry for p-ERK1/2 or, after a 3-h chase, COX2. (f) BMDMs treated with Scr or siCd36 were assayed for Cd36. (g) BMDMs treated with Scr or siCd36 were incubated with pHrodo-labeled ACs and, after an 18-h chase, assayed by flow cytometry for TGFβ1 in pHrodo+ (AC+) and pHrodo (AC) macrophages. h, BMDMs pretreated for 2 h with vehicle or U0126 (MEK inhibitor) were incubated ± ACs and assayed for Dusp4. i, BMDMs treated with Scr, siDnmt3a, siDusp4, or siDnmt3a + siDusp4 were assayed for Dnmt3a or Dusp4. j-k, Control or DNMT3A-KO BMDMs transfected with Scr or siDusp4 as indicated were incubated ± ACs and assayed for Ptgs2 or Tgfb1. l-m, Control or DNMT3A-KO BMDMs treated with Scr or siDusp1 as indicated were incubated ± ACs and assayed for Ptgs2 or Tgfb. n-o, BMDMs treated with Scr, siMat2a, siDusp4, or siMat2a + siDusp4 were incubated ± ACs and assayed for Tgfb1. p-q, BMDMs treated with Scr, siMapk1/3, siDusp4, or siMapk1/3 + siDusp4 were incubated ± ACs and assayed for Tgfb1, Mapk3, Mapk1, and Dusp4 after a 6-h chase. Data are expressed relative to the first control group. Values are means ± SEM. n.s., not significant (P > 0.05); n = 3 biological replicates. Two-sided P values were determined by the Student’s t-test for two groups or one-way ANOVA with Fisher’s LSD posthoc analysis for three or more groups.
Extended Data Fig. 4
Extended Data Fig. 4. In vivo evidence of AC-induced COX2-TGFβ1 pathway. Related to Fig. 5. a–b
Wild-type (WT) C57BL/6J mice were transplanted with bone marrow from Vav1Cre+/− (Control) or Dnmt3afl/fl Vav1Cre+/− (H-DNMT3A-KO) mice and, after 4 weeks, injected with PBS or dexamethasone (DEX). After 4h, the thymus was harvested and immunostained with anti-annexin V to document the initial increase in apoptosis after PBS or DEX injection, n=4 mice per group (a). For b (left), thymi were immunostained with Mac2 (green) and DNMT3A (Red). White arrows indicate non-macrophage DNMT3A, and brown arrows indicate macrophage DNMT3A. For b (right), documentation of co-localized p-ERK1/2, COX2, and Mac2. Representative image from n=4 mice per group. Scale bar, 50 μm. c-d, Wildtype (WT) C57BL/6J mice transplanted with bone marrow from control or H-DNMT3A-KO mice were injected i.p. with 1 mg/mL Zymosan A1. After 12 h, peritoneal exudate cells were analyzed by flow cytometry for F4/80+ and COX2+ cells (n=4 mice/group) LAP-TGFβ1+ cells (n= 4 mice/group). e-m, Ldlr−/− (LDLR-KO) mice were transplanted with bone marrow from control or H-DNMT3A-KO mice and, after 4 weeks, fed a western-type diet (WD) for 12 weeks. Aortic root sections were immunostained for Mac2 and DNMT3A. Brown arrows indicate macrophage DNMT3A. Representative image from n=8 mice per group (e); body weight, n=10 mice/group (f); and the plasma or blood was assayed for the indicated metabolic and immune cell parameters, n=10 mice/group (g-l) and the lipoprotein-cholesterol profile by FPLC (m). Scale bar, 50 μm. Values are means ± SEM; n.s., not significant (P > 0.05). Two-sided P values were determined by the Student’s t-test for two groups or one-way ANOVA with Fisher’s LSD posthoc analysis for three or more groups.
Extended Data Fig. 5
Extended Data Fig. 5. DNMT3A mediates efferocytosis and resolution in vivo. Related to Fig. 6. a
BMDMs were pretreated with vehicle or a TGFβ1R inhibitor for 2 h and with vehicle or recombinant TGFβ1 for 1 h, as indicated. The macrophages were then incubated with PKH26-labeled ACs for 45 mins, followed by rinsing and quantification of percent PKH26-AC+ macrophages of total macrophages, n=4 biological replicates. b-f, Wildtype (WT) C57BL/6J mice were transplanted with bone marrow from control or H-DNMT3A-KO mice and, after 4 weeks, injected with PBS or dexamethasone (DEX). After 18 h, the thymi were weighed, n= 7 and 9 mice for PBS and DEX groups respectively (b); immunostained for DAPI, TUNEL, and Mac2 (c); assayed for F4/80+ cells, n=5 mice per group (d); and assayed for TNF-a, n=3 and 5 mice for PBS and DEX groups respectively and IL-6 by ELISA, n=3 and 4 mice for PBS and DEX groups respectively (e-f). The image in b illustrates thymic macrophages with cytoplasmic TUNEL as an example of efferocytosing thymic macrophages. Scale bar, 100 μm. g, The peritoneal exudates were assayed for Ly6G+ polymorphonuclear cells (PMN) 18 hours after Zymosan A1 injection, n=3 mice per group. h, Wild-type mice received 200 ng/mL recombinant TGFβ1 i.p. or vehicle control 15 and 20 hours after Zymosan injection and then assayed for the number of PMNs 4 hours later, n=3 mice/group. i, Ldlr−/− (LDLR-KO) mice were transplanted with bone marrow from control or H-DNMT3A-KO mice and, after 4 weeks, fed a western-type diet (WD) for 12 weeks. Aortic root sections were quantified for lesional area, n=8 mice/group. Values are means ± SEM; n.s., not significant (P > 0.05). Two-sided P values were determined by the Student’s t-test for two groups or one-way ANOVA with Fisher’s LSD posthoc analysis for three or more groups.
Fig. 1.
Fig. 1.. Efferocytosis-induced TGFβ1 production requires phagolysosomal AC degradation and Ptgs2/COX2 induction.
a-h, Bone marrow-derived macrophages (BMDMs) or human monocyte-derived macrophages (HMDMs) were pretreated with siRNAs for 72 h or inhibitors for 2 h, as indicated below. The cells were then incubated ± ACs for 45 min, after which noninternalized ACs were removed by rinsing. After an additional 1 or 6 h of incubation, the cells were assayed for Ptgs2 or Tgfb1 mRNA, respectively. a-b, BMDMs were transfected with scrambled RNA (Scr) or siRbcn. c-f, BMDMs or HMDMs were pretreated with vehicle or bafilomycin A1. g, BMDMs were transfected with Scr or siPtgs2. h, HMDMs were pretreated with vehicle or the COX2-specific inhibitor (NS-398). i, BMDMs were transfected with Scr or siPtges. j, BMDMs were transfected with Scr or siPtger2 and siPtger4. k, BMDMs were transfected with Scr or siPtger2 and siPtger4. After 72 h, the cells were incubated with vehicle or 10 uM PGE2 for 2 h and then assayed for Tgfb1 mRNA. The mRNA data are expressed relative to the first control group. Values are means ± SEM; ns, not significant (P > 0.05); n = 3 biological replicates. Two-sided P values were determined by one-way ANOVA with Fisher’s LSD posthoc analysis.
Fig. 2.
Fig. 2.. The AC-induced Ptgs2-TGFβ1 pathway requires SAM formation from AC-derived methionine.
a-d, BMDMs (a-b) or human monocyte-derived macrophages (HMDMs) (c-d) were pretreated with vehicle or the 10 μM MAT2A inhibitor PF-9366 for 2 h. The cells were then incubated ± ACs for 45 min, after which noninternalized ACs were removed by rinsing. After an additional 1 or 6 h of incubation, the cells were assayed for Ptgs2/PTGS2 orTgfb1/TGFB1 mRNA, respectively. For media TGFβ1 in b, macrophages were pretreated for 45 min with vehicle or MAT2A inhibitor before the addition of ACs. The macrophages were rinsed to remove non-engulfed ACs and then incubated for an additional 24 h. The cell media were collected and assayed for TGFβ1. e-f, BMDMs were incubated with vehicle or 20 μM SAM and then assayed for Ptgs2 orTgfb1 mRNA after 1 h or 6 h, respectively. g-h, BMDMs were cultured in methionine-free DMEM supplemented with dialyzed FBS (D-FBS). Before the addition of ACs, cells were pretreated with vehicle or 10 μM MAT2A inhibitor. The cells were then incubated ± ACs for 45 min, after which noninternalized ACs were removed by rinsing. After an additional 1 or 6 h of incubation, the cells were assayed for Ptgs2 orTgfb1 mRNA, respectively. i, BMDMs were cultured in methionine-free media supplemented with D-FBS. The cells were then pretreated for 2 h with vehicle or bafilomycin A1 (Baf), followed by incubation for 45 mins with PKH26-labeled ACs whose proteins had been labeled with 13C515N-methionine before apoptosis induction. After non-engulfed ACs were removed by rinsing and then an additional 1 h of incubation, macrophage extracts were assayed for 13C515N-SAM by LC-MS/MS, with the data expressed as peak height per μg of cell protein. The mRNA data are expressed relative to the first control group. Values are means ± SEM; n.s., not significant (P > 0.05); n = 3 biological replicates. Two-sided P values were determined by a one-way ANOVA with Fisher’s LSD posthoc analysis.
Fig. 3.
Fig. 3.. The AC-induced COX2-TGFβ1 pathway requires DNMT3A.
All incubations ± ACs were 45 min, followed by rinsing and then a 1-h or 6-h chase period for Ptgs2 or Tgfb1, respectively. a, BMDMs from Vav1Cre+/− (Control) or Dnmt3afl/fl Vav1Cre+/− (H-DNMT3A-KO) mice were incubated ± ACs and then assayed for Ptgs2. b, BMDMs treated with scrambled RNA (Scr) or siDnmt3a were incubated ± ACs and then immunoblotted for DNMT3A, COX2, and β-actin after 3 h. c, Control or DNMT3A-KO BMDMs were incubated ± ACs and then assayed for Tgfb1. d-e, HMDMs treated with Scr or siDNMT3A were incubated ± ACs and then assayed for PTGS2 or TGFB1. f-g, Control or DNMT3A-KO BMDMs were incubated ± apoptotic human macrophages and then assayed for Ptsg2 or Tgfb1. h-i, Control or DNMT3A-KO BMDMs were incubated with vehicle or SAM and then assayed for Ptgs2 or Tgfb1 mRNA after 1 h or 6 h, respectively. j, Control macrophages pretreated with vehicle or MAT2A inhibitor (PF9366) and DNMT3A-KO macrophages were incubated ± ACs and then assayed for global DNA methylation levels (% 5-mC). k, BMDMs pretreated for 1 h with vehicle or bafilomycin A1 (Baf) and the MAT2A inhibitor were incubated for 45 min ± ACs whose proteins were labeled with 13C515N-methionine. After rinsing and an additional 1 h of incubation, macrophage DNA was assayed for 13C5-methylcytosine. l-m, Control or DNMT3A-KO BMDMs were incubated with vehicle or PGE2 for 2 h and then assayed for Tgfb1 or immunoblotted for DNMT3A, pCreb1, Creb1 and β-actin (1 h). n-o, BMDMs were pre-treated with Scr or siCreb1 and then incubated ± PGE2 for 2 h (n) or ± ACs for 45 mins followed by a 6-h chase (o). The cells were then assayed for Tgfb1. The mRNA data in this figure are expressed relative to the first control group. Values are means ± SEM. n.s., not significant; n = 3 biological replicates. Two-sided P values were determined by a one-way ANOVA with Fisher’s LSD posthoc analysis.
Fig. 4.
Fig. 4.. The role of ERK, CD36, and DUSP4 in the efferocytosis-Ptgs2/COX2-TGFβ1 pathway.
All incubations ± ACs were 45 min, followed by rinsing and then a 1-h or 6-h chase period for Ptgs2 or Tgfb1, respectively. a-d, BMDMs or HMDMs pretreated for 2 h with the MEK/ERK inhibitor U0126 were incubated ± ACs for 45 min and then assayed of Ptgs2/PTGS2 or Tgfb1/TGFB1. Media TGFβ1 was assayed 24 h after AC removal. e-g, BMDMs treated with scrambled RNA (Scr) or siCd36 were incubated with PKH26-labeled ACs for 45 min and then assayed by flow cytometry for p-ERK1/2 mean fluorescence intensity (MFI), or, after an additional 3 h or 18 h of incubation, for COX2 or TGFβ1 MFI, respectively, gating on PKH26+ (AC+) and PKH26 (AC) macrophages. h, Control and DNMT3A-KO BMDMs were incubated with PKH26-labeled ACs for 45 min and then assayed by flow cytometry for p-ERK1/2 at the indicated time points after AC-removal. i, BMDMs transfected with Scr or siDnmt3a were incubated ± ACs for 45 mins, chased for 1h, and then assayed of Dusp1 or Dusp4. j, Control or DNMT3A-KO BMDMs were incubated ± ACs and then assayed for Dusp4 mRNA after 0 or 1-h chase. k-l, BMDMs treated with Scr, siDnmt3a, siDusp4, or siDnmt3a + siDusp4 were incubated ± ACs and then assayed for Ptgs2 or Tgfb1 mRNA. m, Control or DNMT3A KO BMDMs were incubated ± ACs and then after 1 h subjected to MeDIP to immunoprecipitate fragments of methylated DNA. PCR targeting the CpG-rich region of the Dusp4 promoter was used to determine the fold-enrichment of methylated DNA relative to IgG control. n, Pathway scheme, showing AC-CD36-mediated ERK activation, which is limited by Dusp4, and the subsequent AC-degradation pathway, which represses Dusp4 via DNMT3A-mediated DNA methylation to sustain p-ERK. The pathway leads to PGE2, which acts via EP2/4 and p-CREB to induce Tgfb1. The p-CREB pathway also involves DNMT3A. The data in a-l are expressed relative to the first control group. Values are means ± SEM; n.s., not significant; n = 3 biological replicates. Two-sided P values were determined by one-way ANOVA with Fisher’s LSD posthoc analysis.
Fig. 5.
Fig. 5.. Evidence for the DNMT3A-COX2-TGFβ1 pathway in vivo.
a-d, Wildtype (WT) C57BL/6J mice were transplanted with bone marrow (BMT) from Vav1Cre+/− (Control) or Dnmt3afl/fl Vav1Cre+/− (H-DNMT3A-KO) mice and injected 4 weeks later with PBS or dexamethasone (DEX). After 18 h, the thymi were harvested and immunostained for Mac2 (macrophages) and the following proteins: (a) p-ERK1/2, n=4; (b) COX2, n=4; (c) TGFβ1, n=4; and (d) DUSP4, n=4. The data are quantified as MFI per Mac2+ area, expressed relative to the first control group. Scale bars, 50 μm. Panels b and c show the content of PGE2 and TGFβ1, respectively, in thymic extracts as assayed by ELISA (n=3 & 4 for PBS and DEX groups respectively). e-g, Control or H-DNMT3A-KO BMT mice were injected i.p. with 1 mg/mL Zymosan A1. After 24 h, peritoneal exudate cells were analyzed by flow cytometry for the following proteins, gating on F4/80+ cells (macrophages): (e) p-ERK, n=4; (f) COX2, n=4; (g) LAP-TGFβ1, n=4. Panels f and g also show the content of PGE2 (n=8) and TGFβ1 (n=8), respectively, in peritoneal exudates as assayed by ELISA. h-j, Ldlr−/− (LDLR-KO) mice were transplanted with bone marrow from Vav1Cre+/− (Control) or Dnmt3afl/fl Vav1Cre+/− (H-DNMT3A-KO) and, after 4 weeks, fed a western-type diet (WD) for 12 weeks. Aortic root sections were immunostained for Mac2 and the following proteins: (h) p-ERK1/2, (n=7); (i) COX2, (n=7); and (j) TGFβ1, (n=7). The data are quantified as MFI per Mac2+ area expressed relative to the control group. Scale bars, 50 μm. Values are means ± SEM, n.s., not significant (P > 0.05). Two-sided P values were determined by the Student’s t-test for 2 groups or one-way ANOVA with Fisher’s LSD posthoc analysis for 4 groups.
Fig. 6.
Fig. 6.. Loss of hematopoietic cell DNMT3A impairs efferocytosis in vitro and resolution in vivo.
a, 18-h conditioned media (CM) from control or DNMT3A-KO BMDMs incubated ± AC, or DMEM control, were added to recipient BMDMs (left). In a parallel experiment (right), CM from control BMDMs were treated ± anti-TGFβ1 antibody and then added to BMDMs. After 1 h, the BMDMs were incubated ± PKH26 labeled-ACs and then assayed for percent PKH26-AC+ of total macrophages (n=4 biological replicates). b-e, The thymi of PBS and DEX-treated control and H-DNMT3A-KO BMT mice similar to those in Fig. 5a–d were assayed for annexin V+ cells, n=5 mice/group (b); cellularity, n=6 (PBS) and 8 (DEX) mice (c); efferocytosis, n=7 mice/group; yellow and white arrows indicate macrophage-associated or free TUNEL+ cells, respectively (d); and percent necrosis, n=4 mice/group (e). Scale bars, 50 μm (d) & 200 μm (e). f, The peritoneal exudates of Zymosan A1-injected control and H-DNMT3A-KO BMT mice similar to those in Fig. 5 e–g were assayed for Ly6G+ polymorphonuclear cells (PMN) as a function of time after Zymosan A1 injection, n=5 mice/group. g-h, As in panel f, but a cohort of KO mice received 200 ng/mL TGFβ1 i.p., while cohorts of control and KO mice received vehicle (Veh). After 24 h, the exudates were assayed for the number of PMNs, n=5 mice/group, and for the percent of F4/80+ macrophages that were Gr1+ by flow cytometry (efferocytosis of PMNs), n=5 mice/group. i-k, Aortic root lesions of 12-week WD-fed control and H-DNMT3A-KO BMT Ldlr−/− mice similar to those in Fig. 5h–j were assayed for fibrous cap thickness, expressed relative to the control cohort, n= 8 mice/group (i); fibrous cap thickness as a ratio of the lesion area, n=8 mice/group (j); and efferocytosis, n=7 mice/group (k). Scale bar, 200 μm (i) and 50 μm (k). For k, yellow and white arrows indicate macrophage-associated (top) or free TUNEL+ (bottom) cells, respectively. Values are means ± SEM, n.s., not significant. Two-sided P values were determined by the Student’s t-test for 2 groups or one-way ANOVA with Fisher’s LSD posthoc analysis for 4 groups.

Comment in

References

    1. Dalli J & Serhan CN Pro-resolving mediators in regulating and conferring macrophage function. Front Immunol 8, 1400 (2017). - PMC - PubMed
    1. Doran AC, Yurdagul A Jr. & Tabas I Efferocytosis in health and disease. Nat Rev Immunol 20, 254–267 (2020). - PMC - PubMed
    1. Morioka S, Maueroder C & Ravichandran KS Living on the edge: Efferocytosis at the interface of homeostasis and pathology. Immunity 50, 1149–1162 (2019). - PMC - PubMed
    1. Linton MF et al. Macrophage apoptosis and efferocytosis in the pathogenesis of atherosclerosis. Circ J 80, 2259–2268 (2016). - PMC - PubMed
    1. Kojima Y, Weissman IL & Leeper NJ The role of efferocytosis in atherosclerosis. Circulation 135, 476–489 (2017). - PMC - PubMed

Publication types