. 2022 Apr;29(4):357-368.
doi: 10.1038/s41594-022-00750-6. Epub 2022 Mar 31.

Synergistic activation of the insulin receptor via two distinct sites

Affiliations

Synergistic activation of the insulin receptor via two distinct sites

Jie Li et al. Nat Struct Mol Biol. 2022 Apr.

Abstract

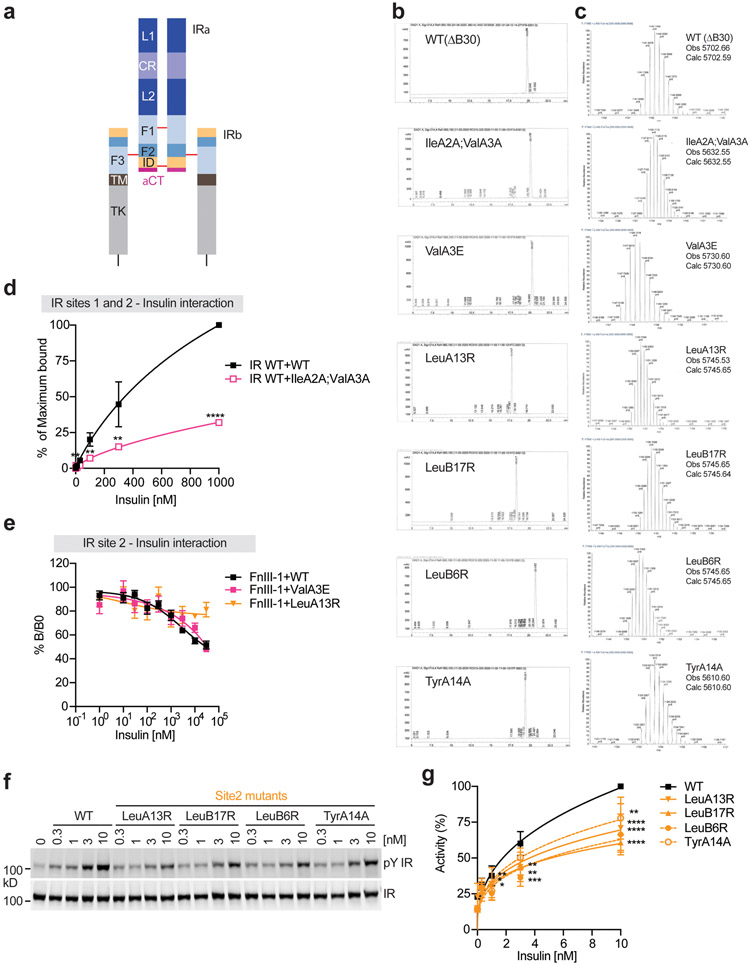
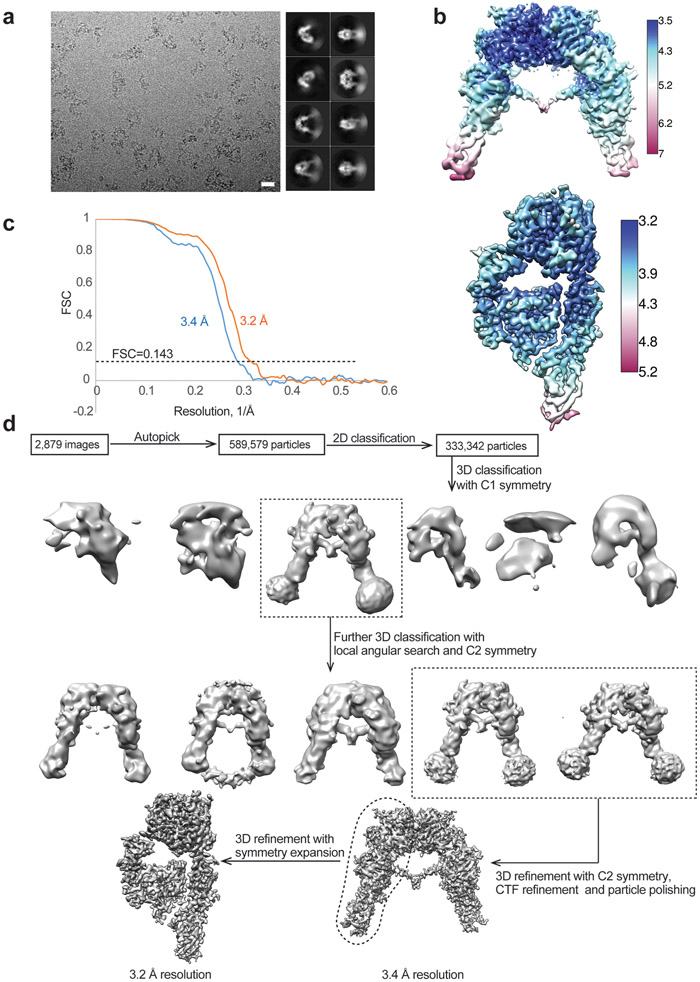
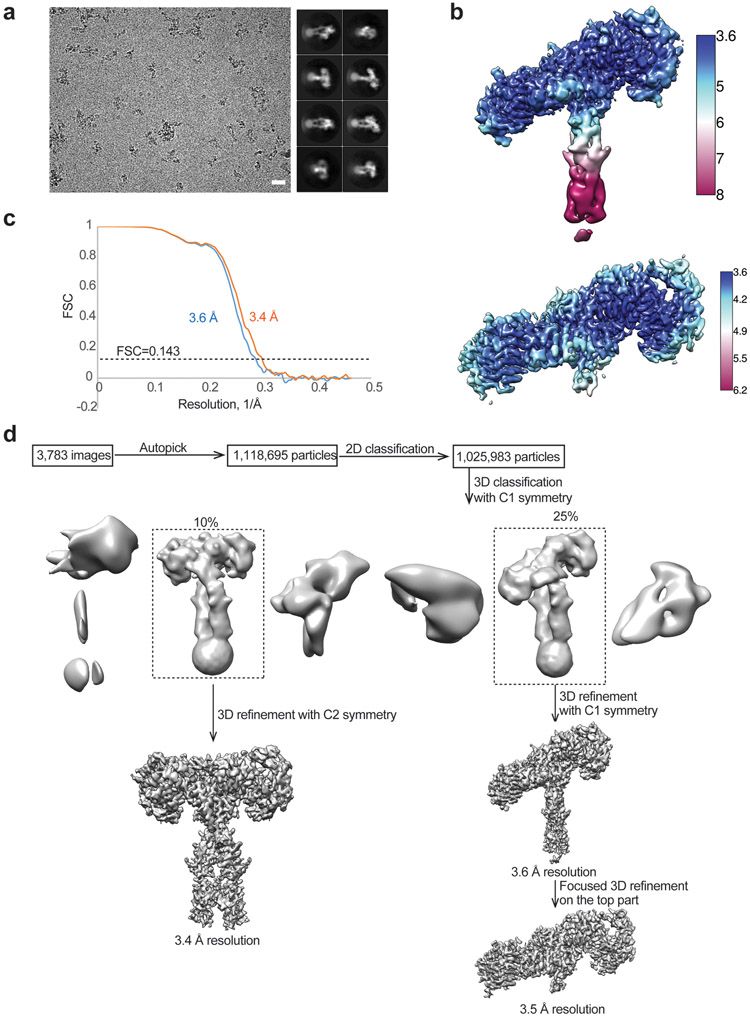
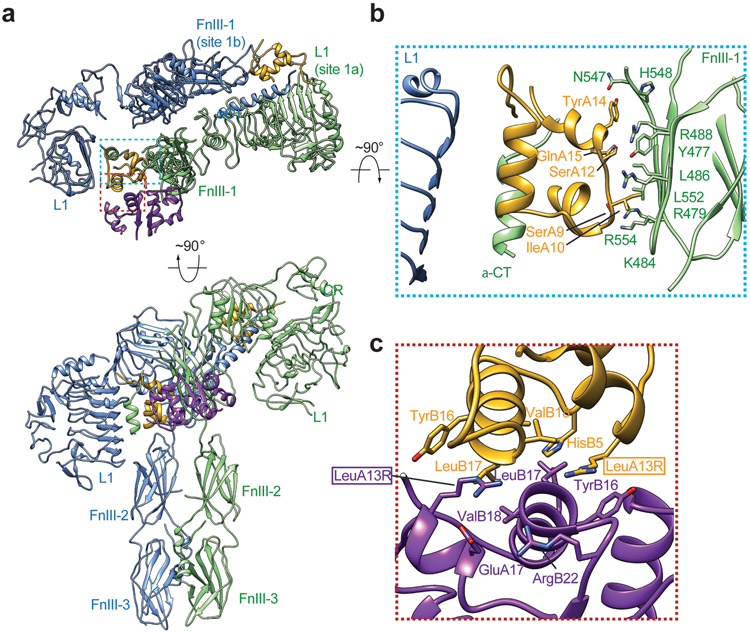
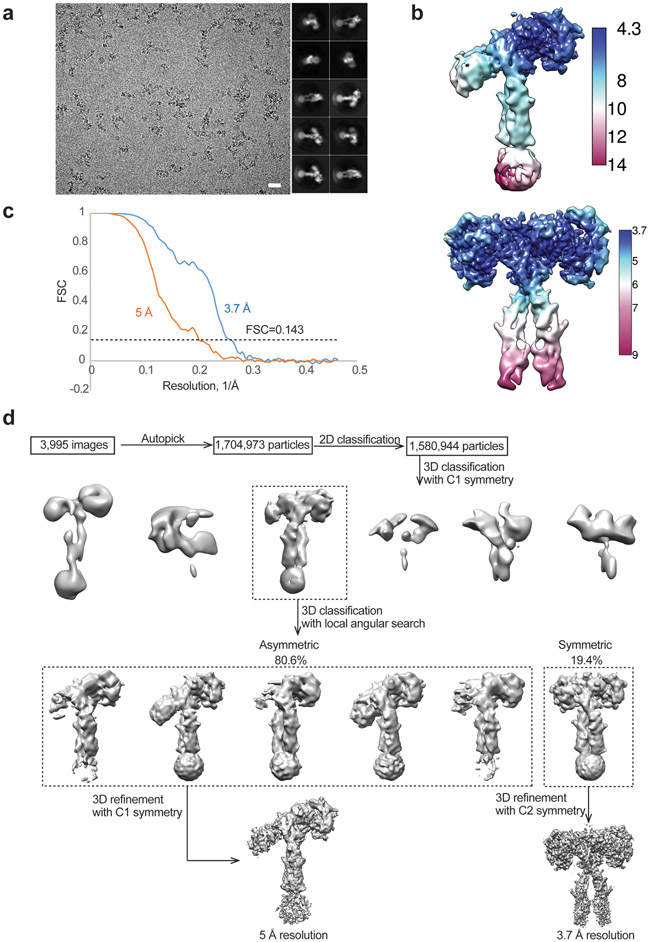
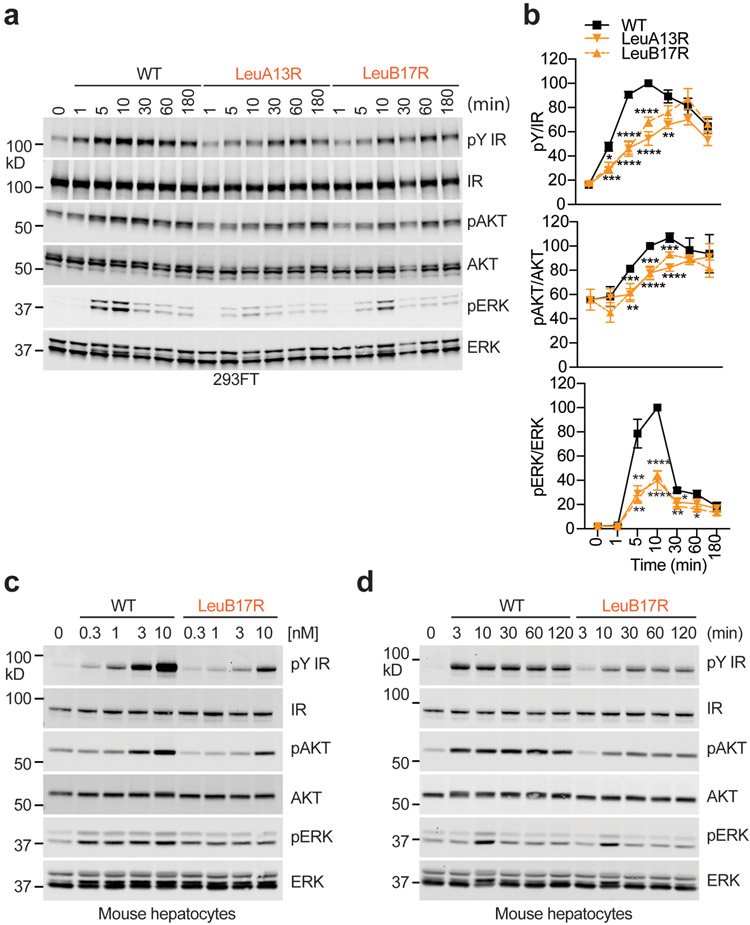
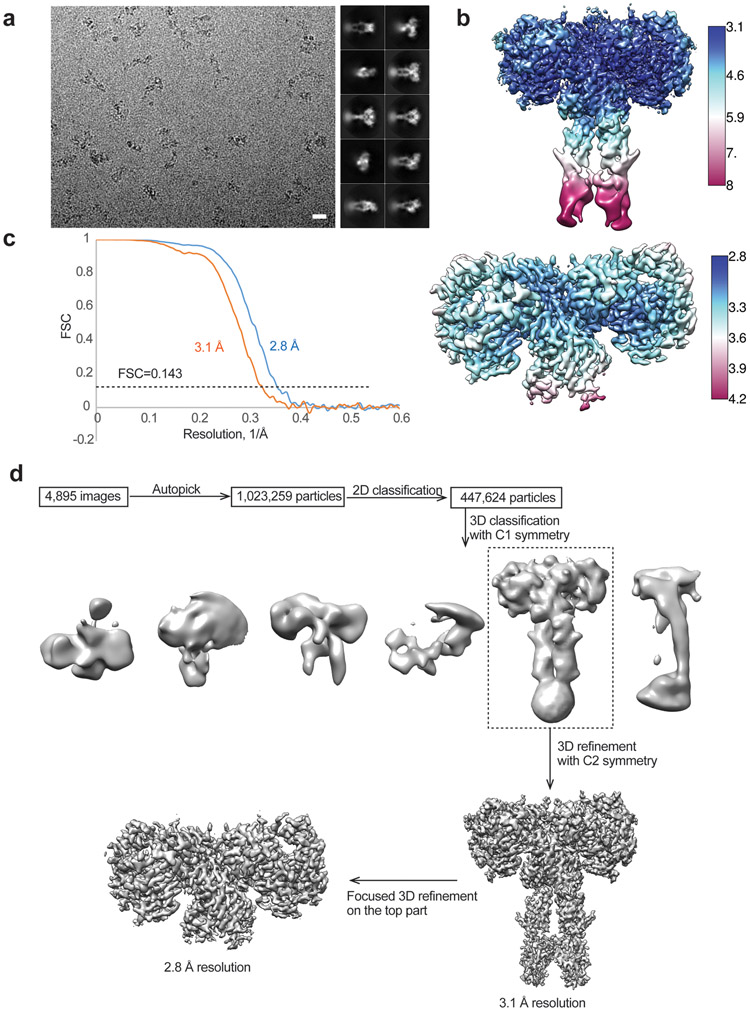
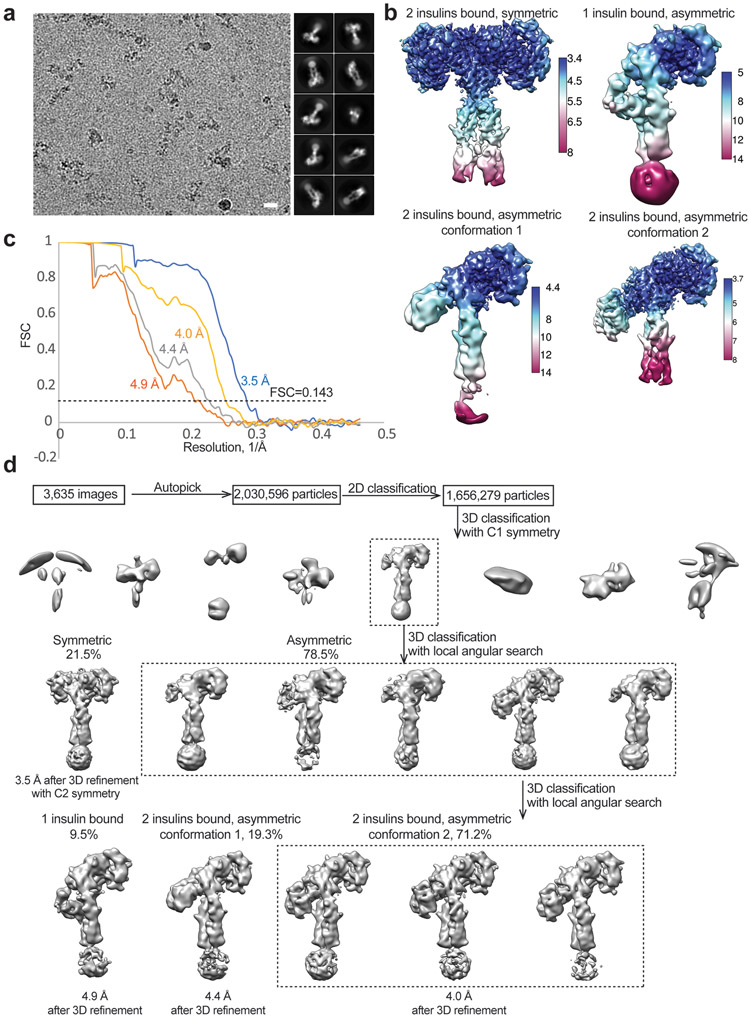
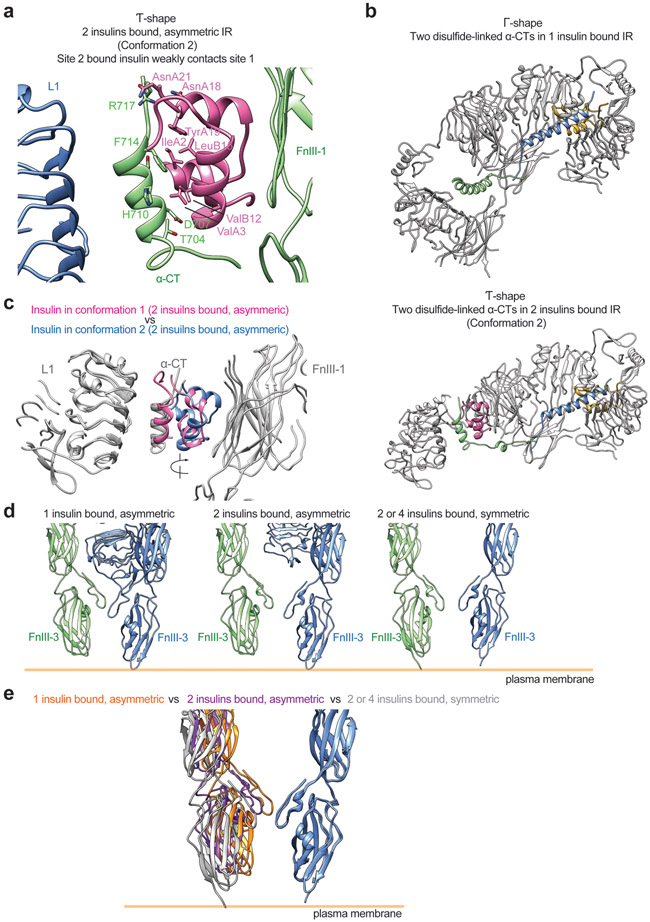
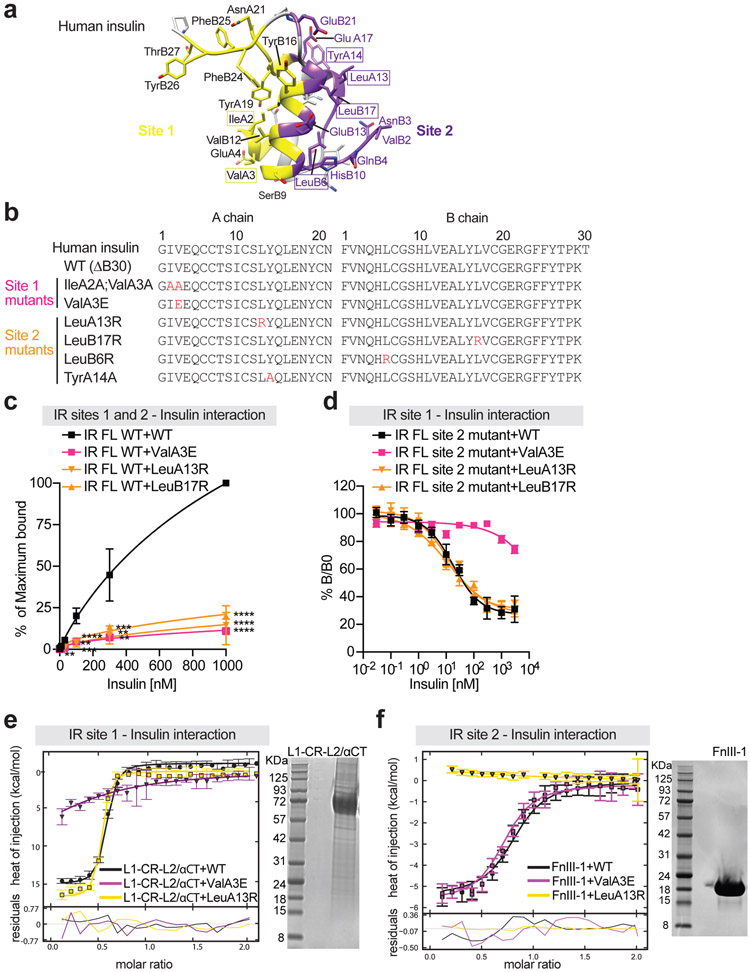
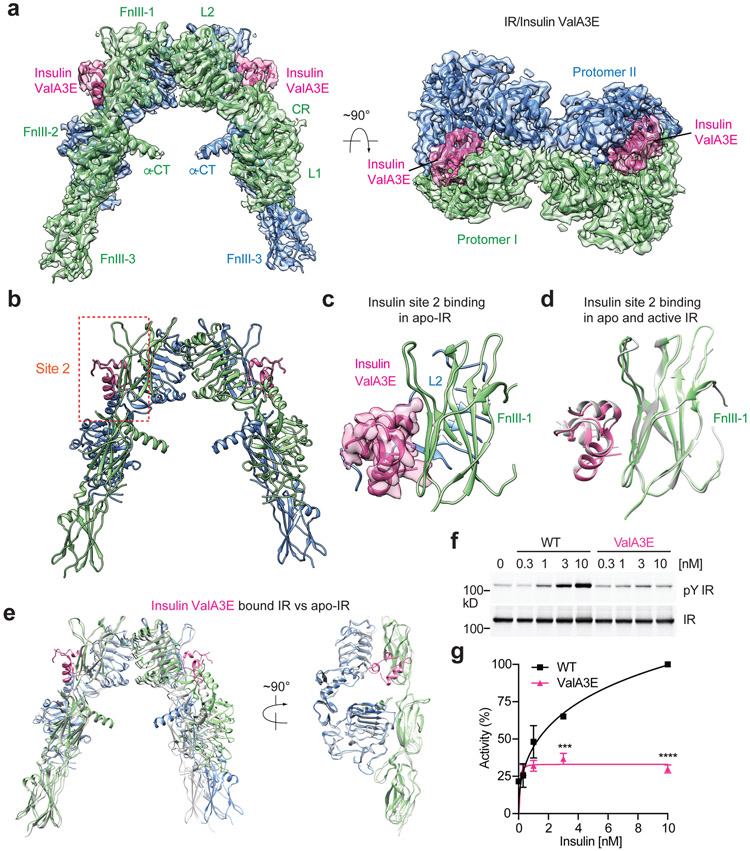
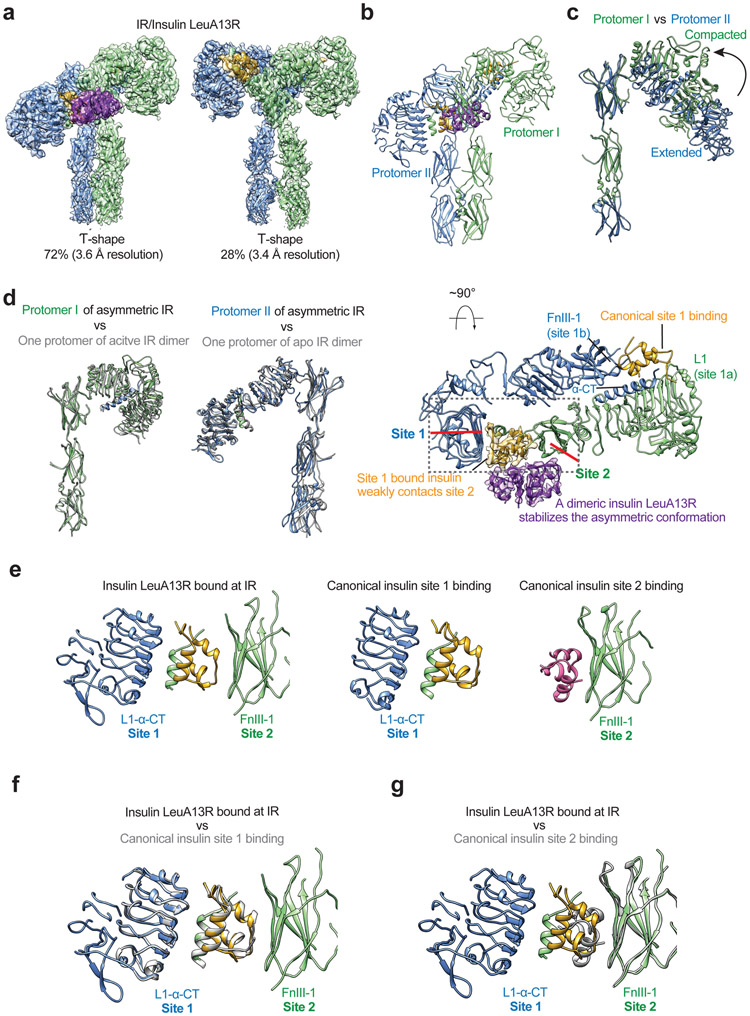
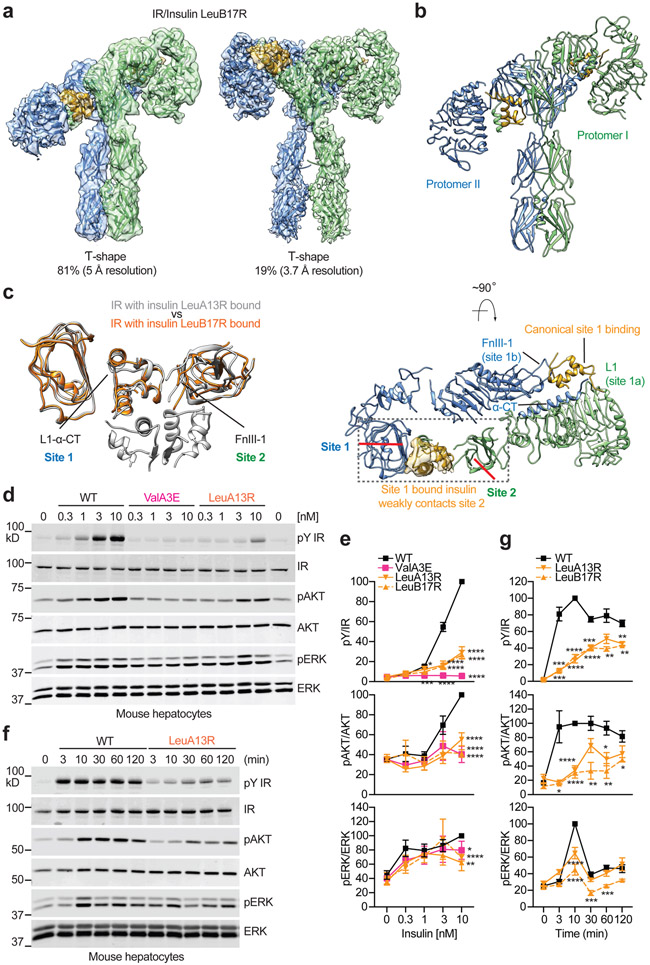
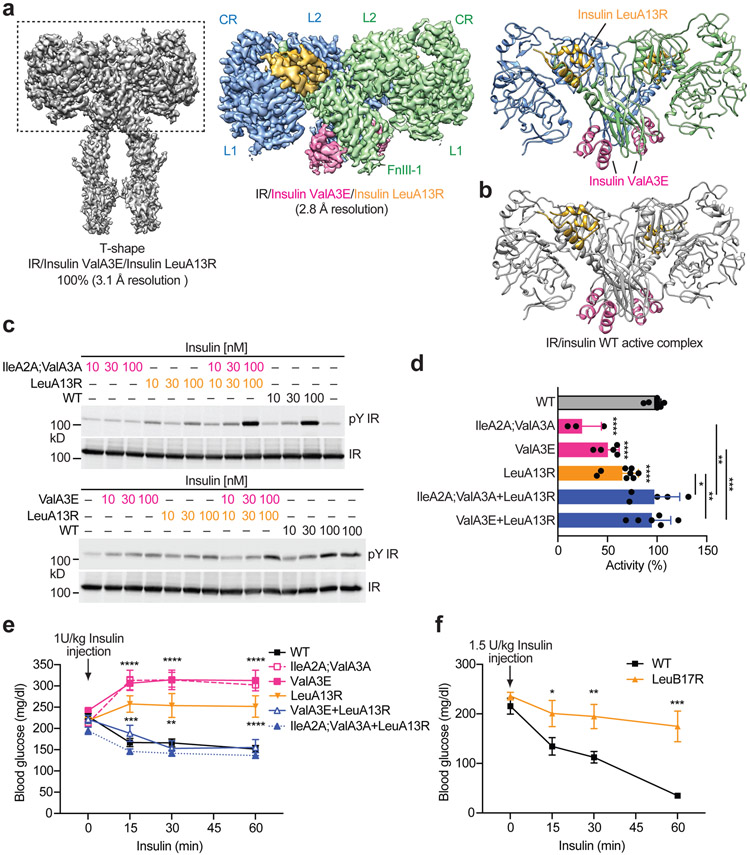
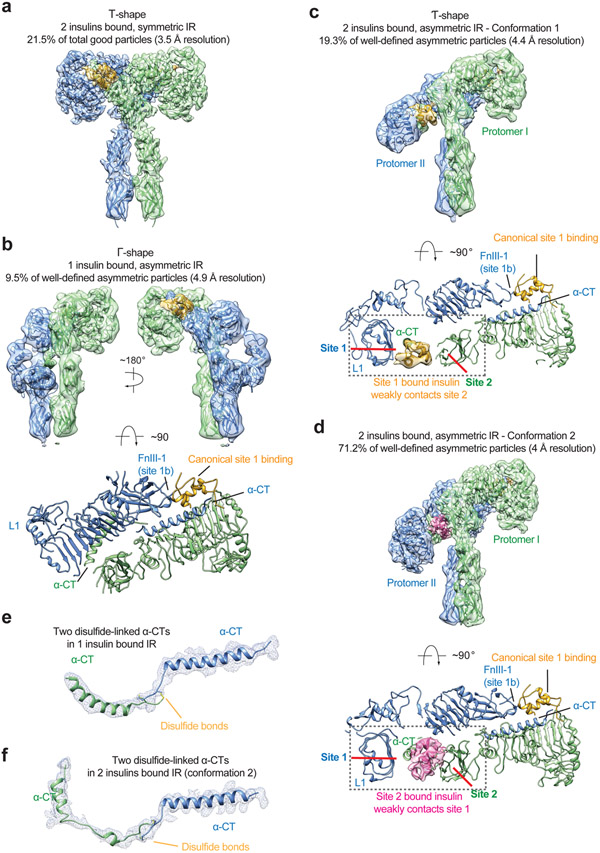
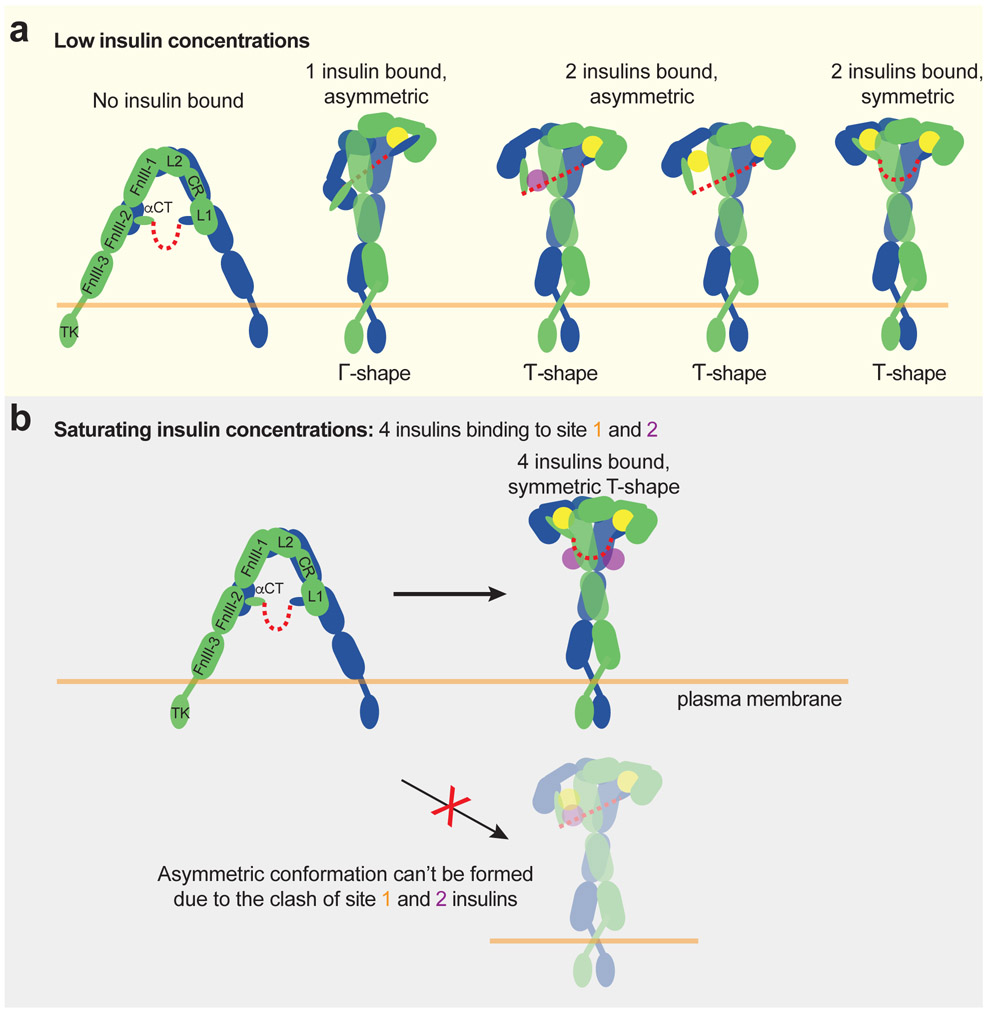
Insulin receptor (IR) signaling controls multiple facets of animal physiology. Maximally four insulins bind to IR at two distinct sites, termed site-1 and site-2. However, the precise functional roles of each binding event during IR activation remain unresolved. Here, we showed that IR incompletely saturated with insulin predominantly forms an asymmetric conformation and exhibits partial activation. IR with one insulin bound adopts a Γ-shaped conformation. IR with two insulins bound assumes a Ƭ-shaped conformation. One insulin binds at site-1 and another simultaneously contacts both site-1 and site-2 in the Ƭ-shaped IR dimer. We further show that concurrent binding of four insulins to sites-1 and -2 prevents the formation of asymmetric IR and promotes the T-shaped symmetric, fully active state. Collectively, our results demonstrate how the synergistic binding of multiple insulins promotes optimal IR activation.


Conflict of interest statement

Declaration of Interests

The authors declare no competing interests.

Figures

Extended Data Fig. 1
Extended Data Fig. 1. Domains of insulin receptor (IR) and activities of insulin analogs in primary mouse hepatocytes.
a. Domains and disulfide connectivity of IR. L1 and L2, leucine rich domains 1 and 2; CR, cysteine rich domain; F1, F2 and F3, fibronectin III (FnIII) domains; ID, insert in FnIII-2 domain; TM, transmembrane domain; TK, tyrosine kinase domain. b. HPLC traces for each of the insulins synthesized and utilized for both functional and structural studies. c. MS1 spectra of the purified insulins in B analyzed in the Orbitrap mass analyzer. d. Binding of insulin WT and site-1 mutant (IleA2A;ValA3A) labeled with Alexa Fluor 488 to purified IR WT in the indicated conditions (Mean ± SD, WT, n=9 independent experiments; IleA2A;ValA3A, n=3). Significance calculated using two-tailed student t-test; **p<0.01 and ***p<0.001 (The exact p values are provided in the source data). e. Insulin competition-binding assay for isolated FnIII-1 domain and insulin WT and mutants (ValA3E and LeuB17R) (Mean ± SD, n=3). f. Insulin-induced IR autophosphorylation in 293FT cells expressing IR wild-type (WT). Cells were treated with the indicated insulin WT or site-2 mutants for 10 min. The IR autophosphorylation levels were assessed by quantitative western blotting with a phospho-tyrosine (pY) IRβ antibody. Expression levels of IRβ were monitored by anti-Myc blotting against the C-terminal Myc-tag. g. Quantification of the western blot data shown in e (Mean ± SD). Each experiment was repeated four times. Significance calculated using two-tailed student t-test; *p<0.05; **p<0.01, ***p<0.001, and ****p<0.0001 (The exact p values are provided in the source data). Uncropped images for all blots and gels are available as source data.
Extended Data Fig. 2
Extended Data Fig. 2. Purification of the full-length mouse insulin receptor (IR).
a. A representative size-exclusion chromatography of IR. b. The peak fractions were combined and visualized on SDS-PAGE by Coomassie staining, in the absence or presence of dithiothreitol (DTT). Most of IR was processed into α-chain (IRα) and β-chain (IRβ). This experiment was repeated for 10 times independently with similar results.
Extended Data Fig. 3
Extended Data Fig. 3. Cryo-EM analysis of the IR-insulin site-1 mutant (ValA3E) complex.
a. Representative electron micrograph and 2D class averages of the IR-insulin site-1 mutant (ValA3E) complex. Scale bar: 200Å. This experiment was repeated for 2,879 times independently with similar results. b. Unsharpened cryo-EM map colored by local resolution. c. The gold-standard Fourier Shell Correlation (FSC) curve for the cryo-EM map shown in Fig. 2a. d. Flowchart of cryo-EM data processing.
Extended Data Fig. 4
Extended Data Fig. 4. Cryo-EM analysis of the IR-insulin site-2 mutant (LeuA13R) complex.
a. Representative electron micrograph and 2D class averages of the IR-insulin site-2 mutant (LeuA13R) complex. Scale bar: 200Å. This experiment was repeated for 3,783 times independently with similar results. b. Unsharpened cryo-EM map colored by local resolution. c. The gold-standard Fourier Shell Correlation (FSC) curve for the cryo-EM map shown in Fig. 3a. d. Flowchart of cryo-EM data processing.
Extended Data Fig. 5
Extended Data Fig. 5. Close-up view of asymmetric IR/insulin LeuA13R complex.
a. Overall view of asymmetric IR/insulin LeuA13R complex in two orthogonal views. b. The close-up view of the contact of site-1 bound insulin LeuA13R at FnIII-1 domain in the asymmetric IR/insulin LeuA13R complex. The location of this interaction in the asymmetric dimer is indicated by a blue box in a. c. The close-up view of the binding of a dimeric insulin at asymmetric IR/insulin LeuA13R complex. The location of this interaction in the asymmetric dimer is indicated by a red box in a.
Extended Data Fig. 6
Extended Data Fig. 6. Cryo-EM analysis of the IR-insulin site-2 mutant (LeuB17R) complex.
a. Representative electron micrograph and 2D class averages of the IR-insulin site-2 mutant (LeuB17R) complex. Scale bar: 200Å. This experiment was repeated for 3,995 times independently with similar results. b. Unsharpened cryo-EM map colored by local resolution. c. The gold-standard Fourier Shell Correlation (FSC) curve for the cryo-EM map shown in Fig. 4a. d. Flowchart of cryo-EM data processing.
Extended Data Fig. 7
Extended Data Fig. 7. Insulin binding to site-2 of IR facilitates IR activation and signaling.
a. IR signaling in 293FT cells expressing IR wild-type (WT). Cells were treated with the 10 nM insulin WT and site-2 mutants for the indicated times. Cell lysates were blotted with the indicated antibodies. b. Quantification of the western blot data shown in a (Mean ± SEM, For pY/IR, n=7 independent experiments; pAKT/AKT, n=4, pERK/ERK, n=6). Significance calculated using two-tailed student t-test; *p<0.05; **p<0.01, ***p<0.001, and ****p<0.0001 (The exact p values are provided in the source data). c. IR signaling in primary mouse hepatocytes treated with the indicated concentrations of insulin for 10 min. Cell lysates were blotted with the indicated antibodies. Quantification of the western blot data shown in Fig. 4e. d. IR signaling in primary mouse hepatocytes treated with 10 nM insulin for the indicated times. Cell lysates were blotted with the indicated antibodies. Quantification of the western blot data shown in Fig. 4g. Uncropped images for all blots and gels are available as source data.
Extended Data Fig. 8
Extended Data Fig. 8. Cryo-EM analysis of the IR-insulin site-1 (ValA3E) and site-2 (LeuA13R) mutants complex.
a. Representative electron micrograph and 2D class averages of the IR-insulin site-1 (ValA3E) and site-2 (LeuA13R) mutants complex. Scale bar: 200Å. This experiment was repeated for 4,895 times independently with similar results. b. Unsharpened cryo-EM map colored by local resolution. c. The gold-standard Fourier Shell Correlation (FSC) curve for the cryo-EM map shown in Fig. 5a, b. d. Flowchart of cryo-EM data processing.
Extended Data Fig. 9
Extended Data Fig. 9. Cryo-EM analysis of the IR-insulin WT complex at subsaturated insulin concentrations.
a. Representative electron micrograph and 2D class averages of the IR-insulin WT complex at subsaturated insulin concentrations. Scale bar: 200Å. This experiment was repeated for 3,635 times independently with similar results. b. Unsharpened cryo-EM maps colored by local resolution. c. The gold-standard Fourier Shell Correlation (FSC) curve for the cryo-EM map shown in Fig. 6a-d. d. Flowchart of cryo-EM data processing.
Extended Data Fig. 10
Extended Data Fig. 10. Close-up view of insulin, α-CT in asymmetric IR dimer and membrane proximal domains in asymmetric and symmetric IR dimer.
a. The close-up view of the contact of site-2 bound insulin at α-CT in the asymmetric IR/insulin complex. b. Close-up view of α-CT in 1 and 2 insulins bound asymmetric IR dimer. c. Superposition of the hybrid sites between the *****Ƭ-shaped asymmetric conformations 1 and 2, showing the rotation of insulin around the α-CT and two different insulin binding modes. d. Close-up view of the membrane proximal domains in asymmetric and symmetric IR dimer. e. Superposition between the membrane proximal domains in asymmetric and symmetric IR dimer.
Figure 1.
Figure 1.. Binding to IR by insulin site-1 and site-2 mutants.
a. Insulin structure with receptor binding sites-1 and −2 (PDB 6PXW). The residues in site 1 are marked as yellow, site-2 as purple, and backbone as grey. b. Sequences of human insulin and insulin analogs. The last amino acid in the B-chain of insulin analogs is deleted (WT: ΔB30). Mutations in insulin are in red. c. Binding of insulin analogs labeled with Alexa Fluor 488 to purified IR WT in the indicated conditions (Mean ± SD; WT, n=9 independent experiments; ValA3E, n=3; LeuA13R, n=6; LeuB17R, n=3). Significance calculated using two-tailed student t-test; **p<0.01 and ***p<0.001 (The exact p values are provided in the source data). d. Insulin competition-binding assay for full-length IR site-2 mutant (K484E/L552A) and insulin WT/mutants (ValA3E, LeuA13R and LeuB17R) (Mean ± SD, n=3). e. Isothermal titration calorimetry (ITC) analysis of binding between human L1-CR-L2/α-CT domains and insulin WT/mutants (ValA3E and LeuA13R). The integrated data points were displayed with their respective estimated error bars. Kd for the insulin WT binding to L1-CR-L2/α-CT is ~90 [60, 120] nM (n=2). The confidence intervals of Kd are shown in square brackets. A SDS-PAGE analysis of isolated L1-CR-L2/α-CT domains is shown. f. ITC analysis of binding between human IR FnIII-1 domain and insulin WT/mutants (ValA3E and LeuA13R). The integrated data points were displayed with their respective estimated error bars. Kd for site 2 insulin WT binding is ~760 [540, 1070] nM (n=2). The confidence intervals of Kd are shown in square brackets. A SDS-PAGE analysis of isolated FnIII-1 domain is shown.
Figure 2.
Figure 2.. Structure of IR with insulin only bound to site-2
a. 3D reconstruction of the 2:2 IR/insulin ValA3E complex and the corresponding ribbon representation of this complex fitted into cryo-EM map at 3.5 Å resolution, shown in two orthogonal views. b. The ribbon representation of the 2:2 IR/insulin ValA3E complex. c. Close-up view of the binding of insulin ValA3E at site-2 of apo-IR. The cryo-EM density of insulin is shown. d. Superposition between the structures of insulin bound at FnIII-1 domain of apo- (colored) and active-states (grey; PDB 6PXV) of IR. e. Superposition between the structures of insulin ValA3E bound IR (colored) and unliganded, apo-IR (grey; PDB 4ZXB). f. Insulin-induced IR autophosphorylation in 293FT cells expressing IR wild-type (WT). Cells were treated with the indicated insulin WT or site-1 mutant (ValA3E) for 10 min. The IR autophosphorylation levels were assessed by quantitative western blotting with a phospho-tyrosine (pY) IRβ antibody. Expression levels of IRβ were monitored by anti-Myc blotting against the C-terminal Myc-tag. g. Quantification of the western blot data shown in f (Mean ± SD). Each experiment was repeated three times. Significance calculated using two-tailed student t-test; ***p=0.000277; ****p=0.000001. Uncropped images for all blots and gels are available as source data.
Figure 3.
Figure 3.. Structures of IR with insulin LeuA13R only bound to site-1.
a. 3D reconstructions of the IR/insulin LeuA13R complex in both asymmetric and symmetric conformations, and the corresponding ribbon representations of this complex fitted into cryo-EM map at 3.6 Å (asymmetrical) and 3.4 Å resolution (symmetrical). The asymmetric and symmetric cryo-EM structures were reconstructed from 72% and 28% of good particles, respectively. b. The ribbon representation of the asymmetric IR/insulin LeuA13R complex, shown in two orthogonal views. The top view of the asymmetric IR/insulin LeuA13R complex, showing, in half of the complex, one insulin bound at site-1 of one protomer also weakly contacts the side-surface of FnIII-1 domain of another protomer. The binding of a dimeric insulin (purple) stabilizes this specific asymmetric conformation. The cryo-EM densities of insulins are shown. c. Superposition between the structures of two protomers in the asymmetric complex by aligning the FnIII-1-3 domains, revealing the structural rearrangements of L1-CR-L2 domains. d. Superposition between the structures of Γ-shaped protomer in the asymmetric complex (green) and one protomer in the active IR-dimer (grey; PDB 6PXV). Superposition between the structures of V-shaped protomer in the asymmetric complex (blue) and one protomer in the apo IR-dimer (grey; PDB 4ZXB). e. The structures of sandwiched insulin in the asymmetric complex (left), insulin bound at site-1 of active IR (middle, PDB 6PXV) and insulin bound at site-2 of active IR (right, PDB 6PXV). f. Superposition between the structures of sandwiched insulin in the asymmetric complex (colored) and insulin bound at site-1 of active IR (grey) by aligning the L1 domain, showing identical binding pattern. g. Superposition between the structures of sandwiched insulin in the asymmetric complex (colored) and insulin bound at site-2 of active IR (grey) by aligning the FnIII-1 domain, showing distinct binding pattern.
Figure 4.
Figure 4.. Structures of IR with insulin LeuB17R only bound to site-1 and functional importance of site-2 insulin binding
a. 3D reconstructions of the IR/insulin LeuB17R complex in both asymmetric and symmetric conformations, and the corresponding ribbon representations of this complex fitted into cryo-EM map at 5 Å (asymmetrical) and 3.7 Å resolution (symmetrical). The asymmetric and symmetric conformations comprise of 81% and 19% of good particles, respectively. b. The ribbon representation of the asymmetric IR/insulin LeuB17R complex, shown in two orthogonal views. The top view of the asymmetric IR/insulin LeuB17R complex, showing, in half of the complex, one insulin bound at site-1 of one protomer also weakly contacts the side-surface of FnIII-1 domain of another protomer. The cryo-EM density of insulin is shown. c. Superposition between the structures of IR/insulin LeuA13R (grey) and IR/insulin LeuB17R (orange), showing similar insulin binding pattern that one insulin is sandwiched between L1/α-CT of one protomer and FnIII-1 of another. d. IR signaling in primary mouse hepatocytes treated with the indicated concentrations of insulin for 10 min. Cell lysates were blotted with the indicated antibodies. e. Quantification of the western blot data shown in d. Mean ± SD. For pY/IR, WT, n=11 independent experiments; ValA3E, n=7; LeuA13R, n=6; LeuB17R, n=6; For pAKT/AKT, WT, n=7; ValA3E, n=4; LeuA13R, n=3; LeuB17R, n=4; For pERK/ERK, WT, n=8; ValA3E, n=4; LeuA13R, n=3; LeuB17R, n=5. Significance calculated using two-tailed student t-test; *p<0.05; **p<0.01, ***p<0.001, and ****p<0.0001 (The exact p values are provided in the source data). f. IR signaling in primary mouse hepatocytes treated with 10 nM insulin for the indicated times. Cell lysates were blotted with the indicated antibodies. g. Quantification of the western blot data shown in f. Mean ± SD. Each experiment was repeated three times. Significance calculated using two-tailed student t-test; *p<0.05; **p<0.01, ***p<0.001, and ****p<0.0001(The exact p values are provided in the source data). Uncropped images for all blots and gels are available as source data.
Figure 5.
Figure 5.. Mixture of the insulin site-1 and site-2 mutants promotes the formation of T-shaped IR dimer and activates IR signaling.
a. 3D reconstruction of the IR dimer with four insulin site-1 and site-2 mutants bound, as well as that after focused 3D refinement (left) and the corresponding ribbon representation (right). b. The structure of IR with four insulins WT bound at sites-1 and −2 (PDB 6PXW). The IR is colored in grey, site-1 insulins are colored in yellow, and site-2 insulins are colored in pink. c. Insulin-induced IR autophosphorylation in 293FT cells expressing IR wild-type (WT). Cells were treated with the WT, site-1 (IleA2A;ValA3A or ValA3E), site-2 (LeuA13R) or 1:1 mixture of the insulin mutants for 1 min. d. Quantification of the western blot data shown in c (100 nM insulin, Mean ± SD) WT, n=15 independent experiments; ValA3E, n=5; LeuA13R, n=8; IleA2A;ValA3A, n=3; ValA3E+LeuA13R, n=6, IleA2A;ValA3A+LeuA13R, n=5. Significance calculated using two-tailed student t-test; *p<0.05; **p<0.01, ***p<0.001, and ****p<0.0001 (The exact p values are provided in the source data). e. Insulin tolerance test of 2-month old male mice. Mice were injected intraperitoneally with insulin WT and mutants at 1 U per kg body weight, and their blood glucose levels were measured at the indicated time points after injection. Animal number, WT, n= 34; IleA2A;ValA3, n=5; ValA3E, n=18; LeuA13R, n=11; IleA2A;ValA3A+LeuA13R, n=8; ValA3E+LeuA13R, n=8. Mean ± SEM. Significance calculated using multiple Mann-Whitney tests with two-stage linear step-up procedure; **p<0.01, ***p<0.001 and ****p<0.0001 (The exact p values are provided in the source data). f. Insulin tolerance test of 3-month old male mice. Mice were injected intraperitoneally with insulin WT and mutants at 1.5 U per kg body weight, and their blood glucose levels were measured at the indicated time points after injection. Mean ± SEM. WT, n=7; LeuB17R, n=8. Significance calculated using Mann-Whitney test with two-stage linear step-up procedure; *p=0.050194, **p=0.008236, and ***p=0.000622. Uncropped images for all blots and gels are available as source data.
Figure 6.
Figure 6.. Structures of IR/insulin WT complex at subsaturated insulin concentrations.
a. 3D reconstruction of the IR/insulin WT in two insulins bound, symmetric conformation, and the corresponding ribbon representation fitted into cryo-EM map at 3.5 Å resolution. The symmetric cryo-EM structure was reconstructed from 21.5% of good particles. b. 3D reconstruction of the IR/insulin WT in a single insulin bound, asymmetric conformation, and the corresponding ribbon representation fitted into cryo-EM map at 4.9 Å resolution, shown in three orthogonal views. The asymmetric cryo-EM structure was reconstructed from 9.5% of well-defined asymmetric particles. c. 3D reconstruction of the IR/insulin WT in two insulins bound, asymmetric conformation, and the corresponding ribbon representation fitted into cryo-EM map at 4.4 Å resolution. The asymmetric cryo-EM structure was reconstructed from 19.3% of well-defined asymmetric particles. The ribbon representation of the asymmetric IR/insulin WT complex, shown in two orthogonal views. The top view of the asymmetric IR/insulin WT complex, showing, in half of the complex, one insulin bound at site-1 of one protomer also weakly contacts the side-surface of FnIII-1 domain of another protomer. The cryo-EM densities of insulins are shown. d. 3D reconstruction of the IR/insulin WT in two insulins bound, asymmetric conformation, and the corresponding ribbon representation fitted into cryo-EM map at 4 Å resolution. The asymmetric cryo-EM structure was reconstructed from 71.2% of well-defined asymmetric particles. The ribbon representation of the asymmetric IR/insulin WT complex, shown in two orthogonal views. The top view of the asymmetric IR/insulin WT complex, showing, in half of the complex, one insulin bound at site-2 of one protomer also weakly contacts the site 1a of neighboring protomer. The cryo-EM densities of insulins are shown. e. Cryo-EM density and model of dimerized α-CT motifs in a single insulin bound, asymmetric IR (b). f. Cryo-EM density and model of dimerized α-CT motifs in two insulins bound, asymmetric IR (d).
Figure 7.
Figure 7.. Working models for insulin-induced IR activation.
a. Insulin-induced IR activation in low insulin concentrations. b. Insulin-induced IR activation in saturating insulin concentrations. The binding of multiple insulins to 2 distinct types of site-1 in apo-IR would trigger the structural transition of IR directly from Λ-shaped apo-form to T-shaped active form.

Similar articles

Cited by

References

    1. Haeusler RA, McGraw TE & Accili D Biochemical and cellular properties of insulin receptor signalling. Nat Rev Mol Cell Biol 19, 31–44, doi:10.1038/nrm.2017.89 (2018). - DOI - PMC - PubMed
    1. Ullrich A et al. Human insulin receptor and its relationship to the tyrosine kinase family of oncogenes. Nature 313, 756–761, doi:10.1038/313756a0 (1985). - DOI - PubMed
    1. White MF Insulin signaling in health and disease. Science 302, 1710–1711, doi:10.1126/science.1092952 (2003). - DOI - PubMed
    1. Boucher J, Kleinridders A & Kahn CR Insulin receptor signaling in normal and insulin-resistant states. Cold Spring Harb Perspect Biol 6, doi:10.1101/cshperspect.a009191 (2014). - DOI - PMC - PubMed
    1. Petersen MC & Shulman GI Mechanisms of Insulin Action and Insulin Resistance. Physiol Rev 98, 2133–2223, doi:10.1152/physrev.00063.2017 (2018). - DOI - PMC - PubMed

Publication types