. 2022 Apr;54(4):437-449.
doi: 10.1038/s41588-022-01016-z. Epub 2022 Mar 31.

Polygenic prediction of educational attainment within and between families from genome-wide association analyses in 3 million individuals

Collaborators, Affiliations

Polygenic prediction of educational attainment within and between families from genome-wide association analyses in 3 million individuals

Aysu Okbay et al. Nat Genet. 2022 Apr.

Abstract

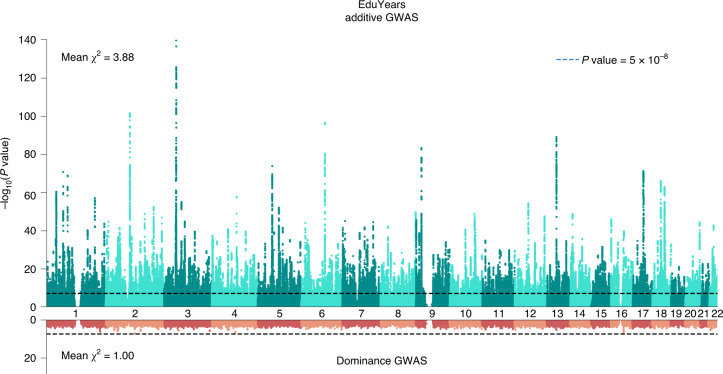
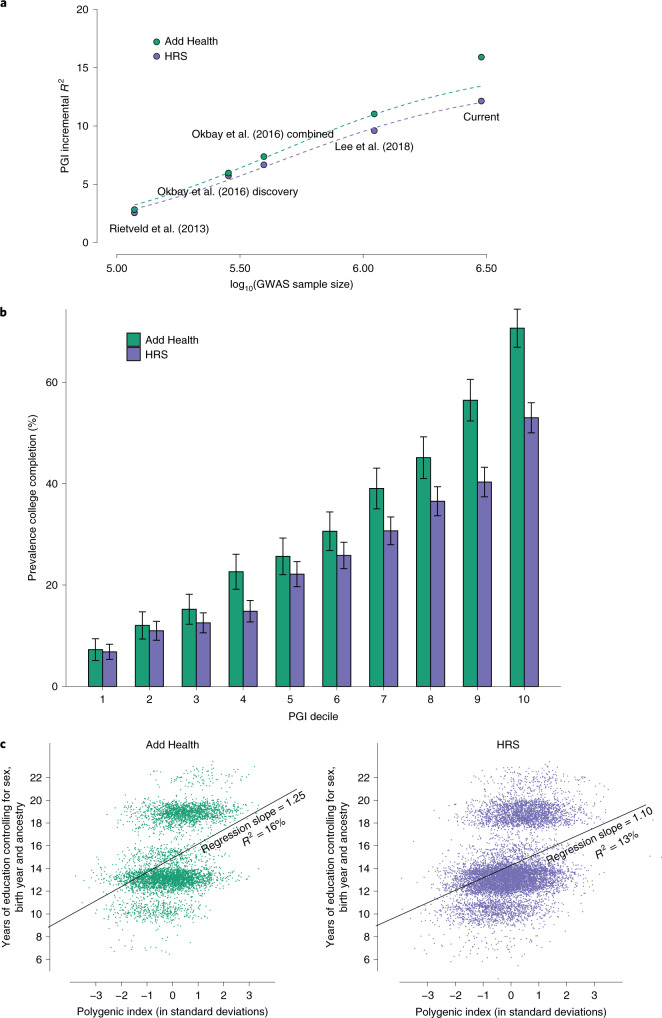
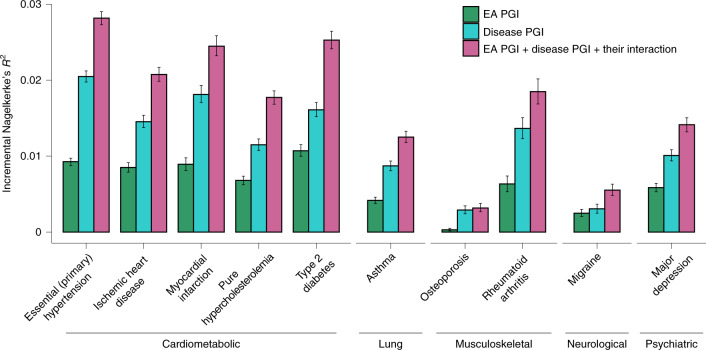
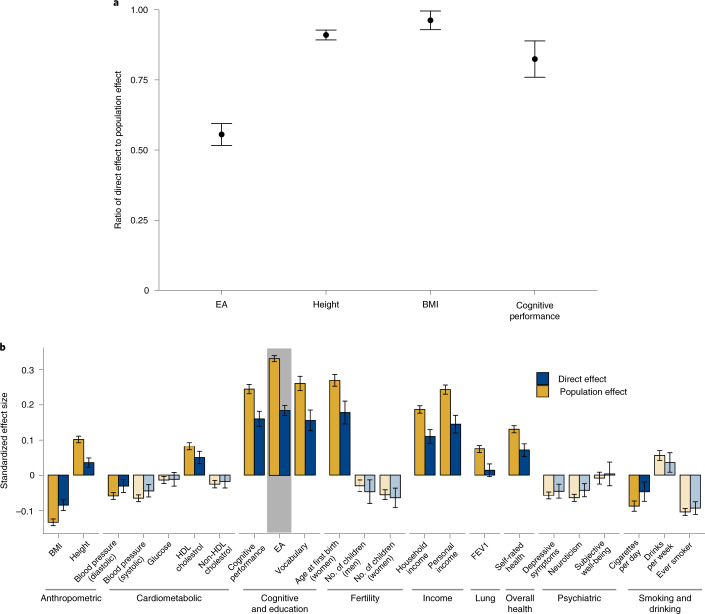
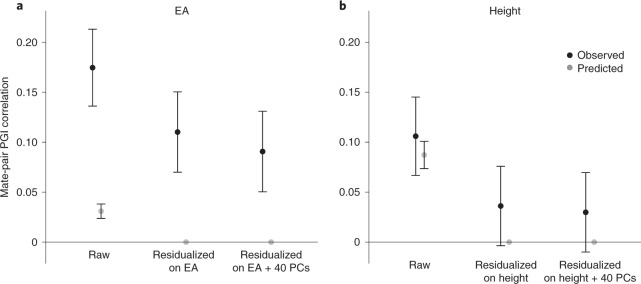
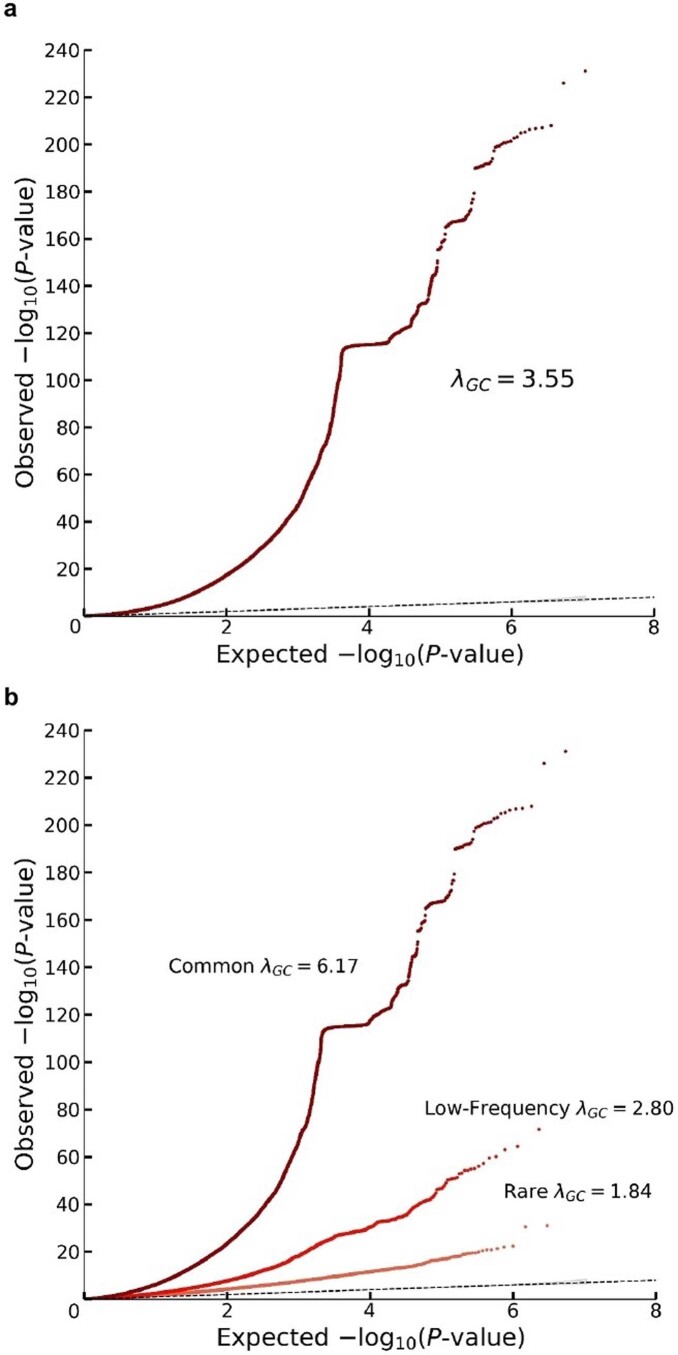
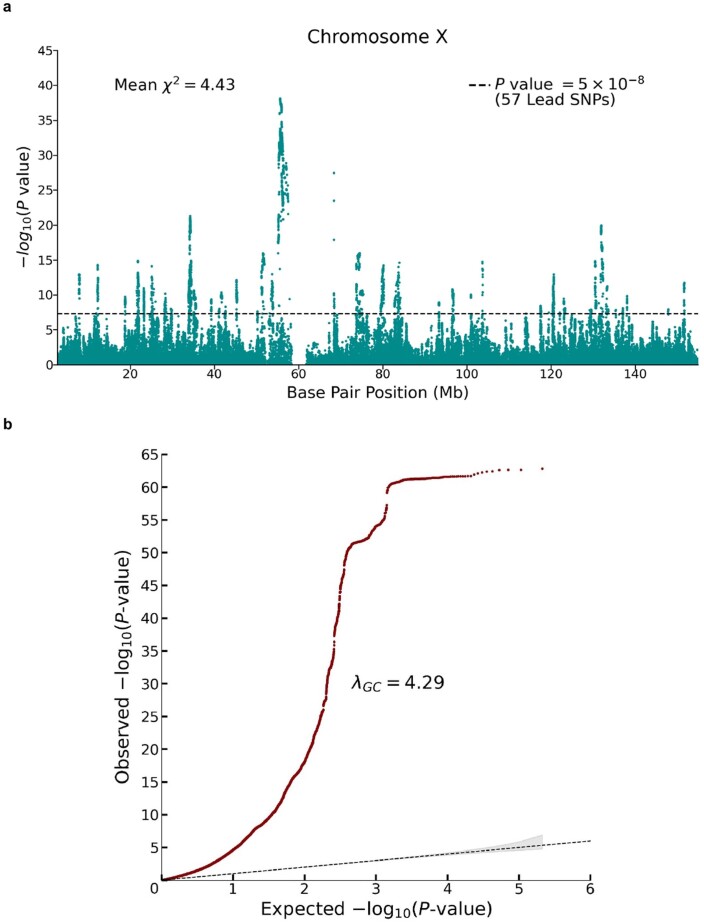
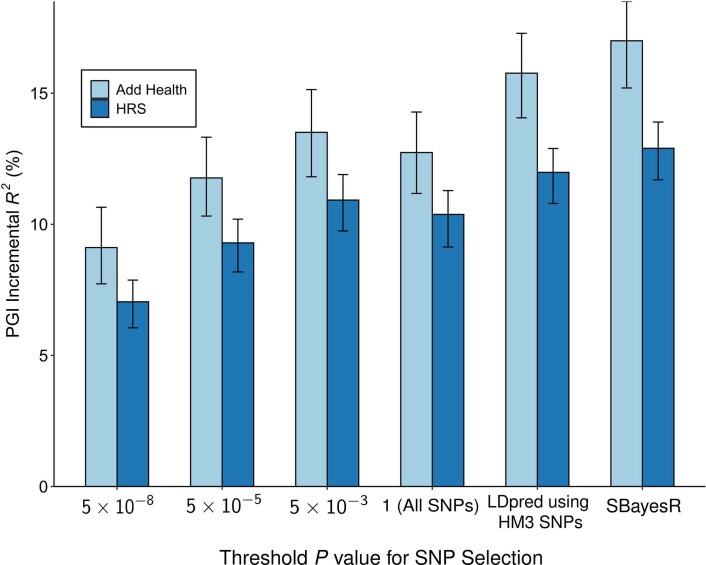
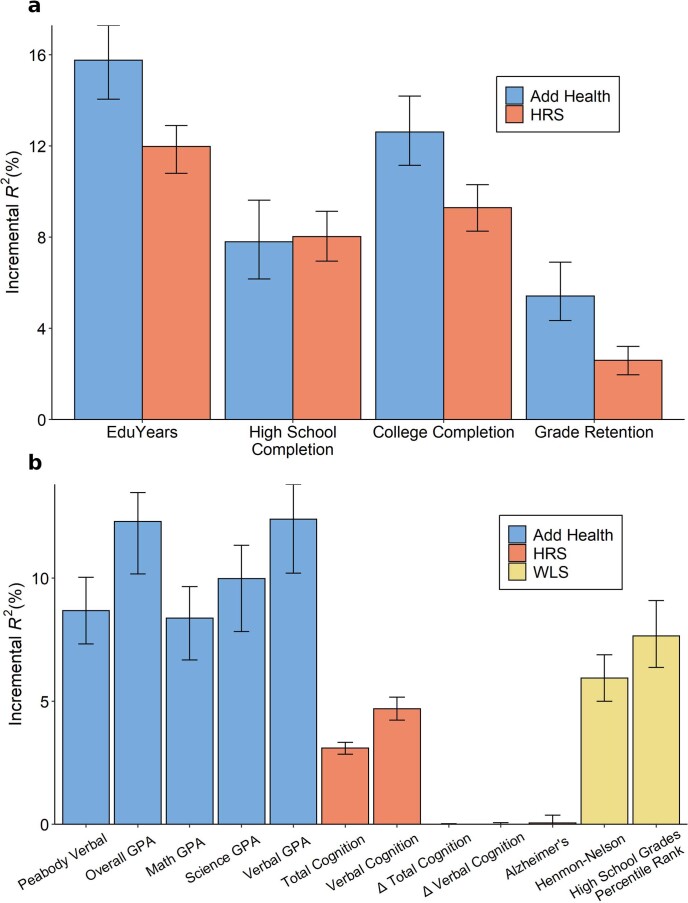
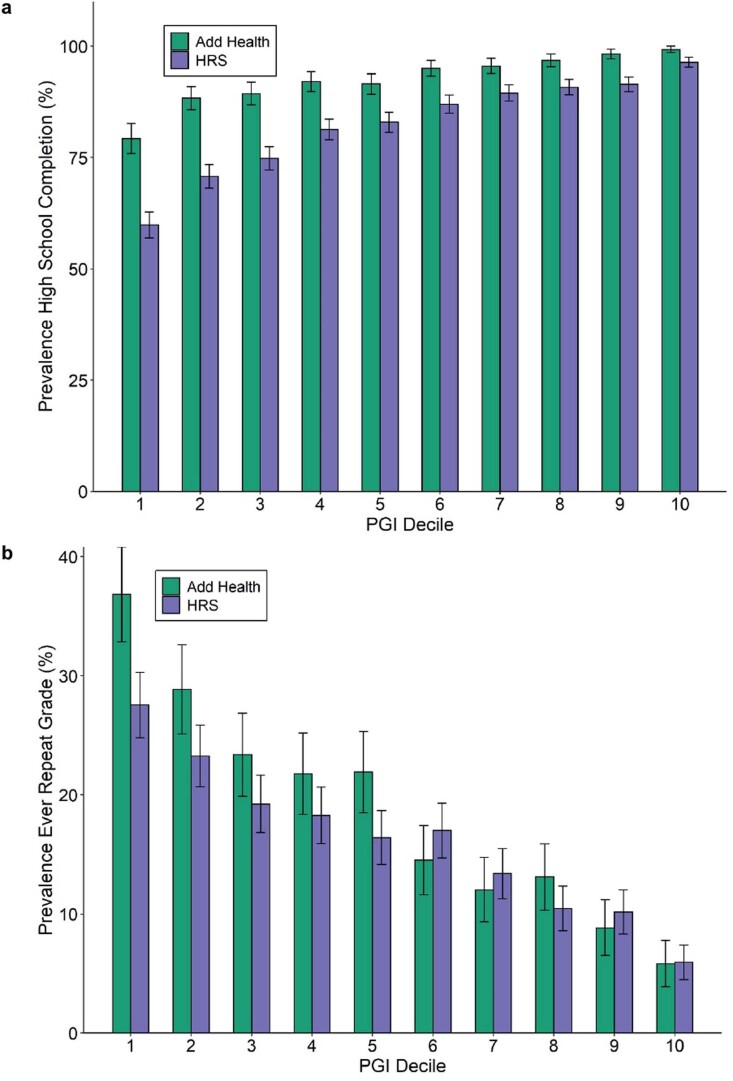
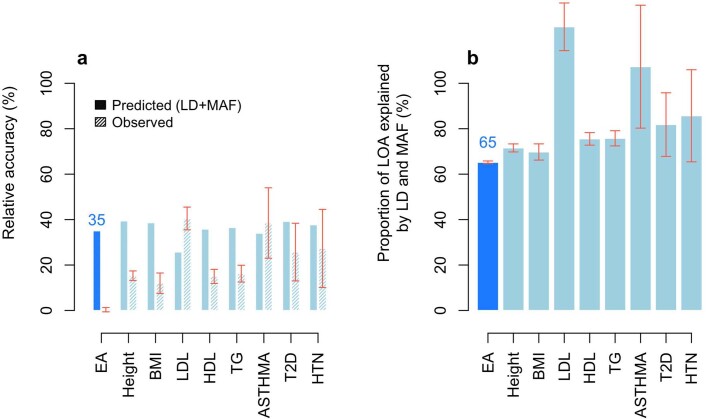
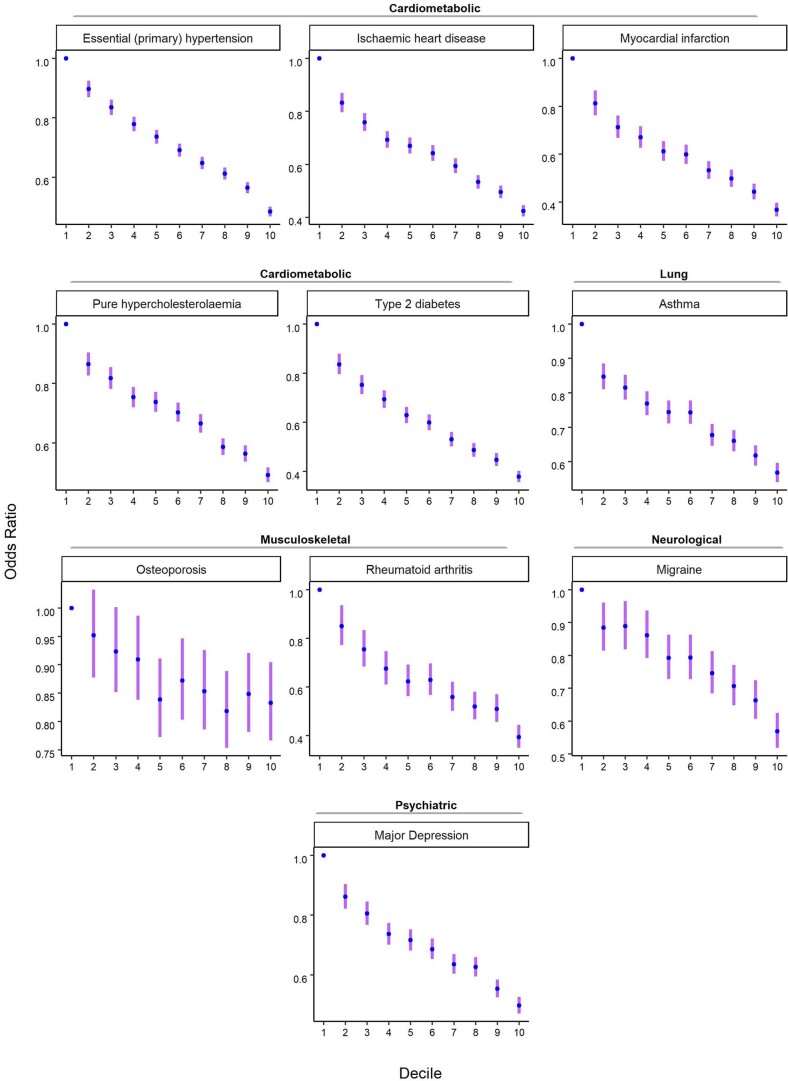
We conduct a genome-wide association study (GWAS) of educational attainment (EA) in a sample of ~3 million individuals and identify 3,952 approximately uncorrelated genome-wide-significant single-nucleotide polymorphisms (SNPs). A genome-wide polygenic predictor, or polygenic index (PGI), explains 12-16% of EA variance and contributes to risk prediction for ten diseases. Direct effects (i.e., controlling for parental PGIs) explain roughly half the PGI's magnitude of association with EA and other phenotypes. The correlation between mate-pair PGIs is far too large to be consistent with phenotypic assortment alone, implying additional assortment on PGI-associated factors. In an additional GWAS of dominance deviations from the additive model, we identify no genome-wide-significant SNPs, and a separate X-chromosome additive GWAS identifies 57.


Conflict of interest statement

Y.J., B.H., C.T., D.A.H. and the members of the 23andMe Research Team are current or former employees of 23andMe, Inc. All other authors declare no competing interests.

Figures

Fig. 1
Fig. 1. Manhattan plots for the additive and dominance GWASs.
The top graph (green) shows the additive GWAS (N = 3,037,499 individuals), and the bottom graph (red) shows the dominance GWAS (N = 2,574,253 individuals). The P value and mean χ2 values are based on inflation-adjusted two-sided Z tests. The x axis is chromosomal position, and the y axis is the significance on a −log10 scale. The dashed line marks the threshold for genome-wide significance (P = 5 × 10−8).
Fig. 2
Fig. 2. Polygenic prediction.
a, Predictive power of the EA PGI as a function of the size of the GWAS discovery sample, with expected predictive power shown by the dashed lines (Supplementary Note section 5.5). b, Prevalence of college completion by EA PGI decile, with 95% CIs. c, Scatterplot of EA PGI (residualized on ten principal components) and EduYears (residualized on sex, a full set of birth-year dummies, their interactions and ten principal components). Prediction samples for all panels are European-ancestry participants in Add Health (N = 5,653) and the HRS (N = 10,843). All PGIs were constructed from EduYears GWAS results that exclude Add Health and HRS using the software LDpred and assuming a normal prior for SNP effect sizes. Incremental R2 is the difference between the R2 from a regression of EduYears on the PGI and the controls (sex, a full set of birth-year dummies, their interactions and ten principal components) and the R2 from a regression of EduYears on just the controls. The individual-level data plotted in c have been jittered by adding a small amount of noise to each observation.
Fig. 3
Fig. 3. Predictive power of the EA PGI and the disease-specific PGI and their combination for ten diseases in the UKB.
For each disease phenotype, the figure shows the incremental Nagelkerke’s R2 from adding the EA PGI, the disease PGI or both PGIs and their interaction to a logistic regression of the disease phenotype on covariates. The covariates are sex, a third-degree polynomial in birth year and their interactions with sex, the first 40 PCs and batch dummies. The error bars represent 95% CIs calculated with the bootstrap percentile method, with 1,000 repetitions.
Fig. 4
Fig. 4. Meta-analysis estimates of direct and population effects of PGIs.
a, For each PGI, the ratio of the direct effect to the population effect on the phenotype from which the PGI was derived. b, The effects of the EA PGI on 23 phenotypes. Bars are shaded lighter when the population and direct effects are statistically indistinguishable (two-sided Z test P > 0.05/23, where 23 is the number of phenotypes under study). For both panels, estimates are from meta-analyses of UKB, GS, and STR samples of siblings and trios. Phenotypes and the PGIs are scaled to have variance one, so effects correspond to partial correlation coefficients. Error bars represent 95% CIs. See Supplementary Table 9 for details on phenotypes and Supplementary Tables 10–13 for numerical values underlying this figure. FEV1, forced expiratory volume during the first second; HDL, high-density lipoprotein.
Fig. 5
Fig. 5. Correlations between mate-pair PGIs.
a, Black dots show the correlation between mate-pair EA PGIs (raw) and the correlation between the residuals of the mate-pair EA PGIs after regressions with the listed regressors. Gray dots show the predicted correlations under phenotypic assortment; that is, all correlations between mate-pair EA PGIs are explained by assortment on EA itself. N = 2,344 (861 from UKB and 1,483 from GS). b, Analogous but for the height PGI and predictions under phenotypic assortment on height. N = 2,451 (858 from UKB and 1,593 from GS). For both panels, error bars represent 95% CIs. See Supplementary Table 14 for numerical values underlying this figure.
Extended Data Fig. 1
Extended Data Fig. 1. Quantile-quantile plots for the additive GWAS meta-analysis.
The panels display Q-Q plots, which show the -log10(P-values) based on a two-sided Z-tests for (a) all SNPs and (b) SNPs grouped by minor allele frequency (MAF): rare (<1%), low frequency (1–5%) and common (>5%). The plots and λGC numbers are based on the unadjusted GWAS summary statistics (that is with standard errors that were not inflated by the square root of the estimated LD Score intercept). The dotted line represents the expected -log10(P-values) under the null hypothesis. The (barely visible) gray shaded areas in the Q-Q plots represent the 95% confidence intervals under the null hypothesis. The flat horizontal region in the plots is an inversion region in chromosome 17 (17q21.31).
Extended Data Fig. 2
Extended Data Fig. 2. LD score plot from the additive GWAS meta-analysis.
Each point represents an LD score quantile containing 1000 SNPs (except for the last quantile, which contains 709). The x and y coordinates of each point are the mean LD score and the mean statistic of SNPs in that quantile. The LD score regression intercept is 1.663, suggesting that biases due to stratification or cryptic relatedness explain roughly 7% of the inflation in test statistics (see Supplementary Note section 2.2.6).
Extended Data Fig. 3
Extended Data Fig. 3. Replication of EA3 lead SNPs.
We examined the out-of-sample replicability of the 1,504 lead SNPs identified at genome-wide significance in a version of our previously published GWAS meta-analysis of EduYears (EA3), with the UKB GWAS in that analysis replaced by a UKB GWAS that uses the new phenotype coding explained in Supplementary Note section 1.1. Prior to clumping, we dropped SNPs that had a sample size smaller than 80% of the maximum sample size in the updated EA3 data (NEA3,max = 1,130,819), or that had a sample size in the new data smaller than 80% of the maximum sample size of the new data (Nnew,max = 2,272,216). The x axis is the winner’s-curse-adjusted estimate of the SNP’s effect size in the updated EA3 study (calculated using shrinkage parameters estimated using summary statistics from EA3). The y axis is the SNP’s effect size estimated from the subsample of our data that did not contribute to the EA3 GWAS. All effect sizes are from a regression where the phenotype has been standardized to have unit variance. The reference allele is chosen to be the allele estimated to increase EA in EA3. The dashed line is the identity, and the solid line is the fitted regression line. P-values are based on two-sided Z-tests.
Extended Data Fig. 4
Extended Data Fig. 4. Meta-analysis of X chromosome SNPs (N = 2,713,033 individuals).
The meta-analysis was conducted by combining summary statistics from (pooled-sex) association analyses conducted in UK Biobank (N = 440,817 individuals) and 23andMe (N = 2,272,216 individuals); see Supplementary Note section 3.4 for details. Panel (a): Manhattan plot, in which P values are based on summary statistics adjusted for inflation using the LD score intercept estimated from an autosomal association analysis of UKB and 23andMe. The solid line indicates the threshold for genome-wide significance (P = 5 × 10−8 based on a two-sided Z-test adjusted for multiple comparisons). Panel (b): Q-Q plot, in which P values are based on unadjusted Z-test statistics. The dotted line represents the expected -log10(P-values) under the null hypothesis. The (barely visible) gray shaded area in represents the 95% confidence intervals under the null hypothesis.
Extended Data Fig. 5
Extended Data Fig. 5. Predictive power of the EduYears PGI as a function of pruning at different P value thresholds.
Each bar represents the incremental R2 with error bars showing the 95% confidence intervals bootstrapped with 1,000 iterations each. Each clumping and thresholding PGI is based on a set of approximately independent SNPs identified using the clumping algorithm defined in Supplementary Note section 2.2.6. For HRS (N = 10,843 individuals) and Add Health (N = 5,653 individuals) respectively, the number of SNPs included in the PGI is (with P value threshold in parentheses): 3,806 and 3,843 (5 × 10−8); 10,852 and 10,897 (5 × 10−5); 33,159 and 32,693 (5 × 10−3); 281,087 and 247,329 (1); 1,137,480 and 1,170,675 (All HapMap3 SNPs, LDpred); 2,540,570 and 2,548,339 (SBayesR). P-values are based on two-sided Z-tests. Incremental R2 is the difference between the R2 from a regression of EduYears on the PGI and the controls (sex, birth-year dummies, their interactions, and 10 PCs) and the R2 from a regression of EduYears on just the controls.
Extended Data Fig. 6
Extended Data Fig. 6. PGI prediction in Add Health, HRS and WLS.
Predictive power of the PGI constructed from the current EduYears GWAS results in three independent prediction cohorts: Add Health (N = 5,653), HRS (N = 10,843), and WLS (N = 8,395). For binary phenotypes, the y-axis is incremental Nagelkerke R2. Panel (a): Results for education phenotypes available in Add Health and HRS. Panel (b): Results for cognitive and academic achievement phenotypes available in either Add Health, HRS or WLS. “Δ Total Cognition” and “Δ Verbal Cognition” are wave to wave changes in total and verbal cognition. In both panels, error bars show 95% confidence intervals for the incremental R2, bootstrapped with 1000 iterations each. The number of individuals in the prediction sample for each regression can be found in Supplementary Table 4.
Extended Data Fig. 7
Extended Data Fig. 7. Prevalence of schooling outcomes by EduYears PGI decile.
Each decile contains approximately 1,085 respondents in HRS and 565 in Add Health. Total sample sizes for these phenotypes in each prediction cohort are in Supplementary Table 4. Decile 1 contains the lowest PGI values; decile 10, the highest. Error bars show 95% confidence intervals. Panel (a): High school completion. Panel (b): Grade retention.
Extended Data Fig. 8
Extended Data Fig. 8. European genetic ancestries to African genetic ancestries relative accuracy.
Panel (a) plots the relative accuracy (RA) with error bars representing confidence intervals with + /− 1 standard error. Panel (b) plots the proportion of the loss of accuracy (LOA) explained by LD and MAF calculated as 100% × (1 − RApred(LD+MAF))/(1 − RAobs) with error bars representing confidence intervals with + /− 1 standard error. RA refers to the European genetic ancestries to African genetic ancestries ratio of prediction accuracies (R2) of PGIs trained in a large sample of European-genetic-ancestry UKB participants (N = 425,231). The accuracy in European-genetic-ancestry participants was assessed in a holdout sample of 10,000 unrelated individuals, while the accuracy in African-genetic-ancestry participants was assessed in a holdout sample of 6,514 unrelated individuals. Phenotype labels: EA (Educational Attainment), Height (standing height), BMI (body mass index), LDL (low-density lipoprotein cholesterol), HDL (high-density lipoprotein cholesterol), TG (triglycerides), ASTHMA (diagnosed asthma), T2D (diagnosed type 2 diabetes) and HTN (diagnosed hypertension). See Supplementary Note section 7 in Wang et al. for additional details. Data underlying this Figure are reported in Supplementary Table 5.
Extended Data Fig. 9
Extended Data Fig. 9. Odds ratio for selected diseases by deciles of the EA PGI in the UKB.
The EA PGI was discretized into deciles (1 = lowest, 10 = highest), and nine dummy variables were created to contrast each of deciles 2-10 to decile 1 as the reference. Odds ratio and 95% confidence intervals (the error bars) were estimated using logistic regression while controlling for covariates (sex, a third-degree polynomial in birth year and interactions with sex, the top 40 PCs, and batch dummies).

Comment in

  • Indirect paths from genetics to education.
    Schork AJ, Peterson RE, Dahl A, Cai N, Kendler KS. Schork AJ, et al. Nat Genet. 2022 Apr;54(4):372-373. doi: 10.1038/s41588-021-00999-5. Nat Genet. 2022. PMID: 35361971 No abstract available.

References

    1. Marioni RE, et al. Genetic variants linked to education predict longevity. Proc. Natl Acad. Sci. USA. 2016;113:13366–13371. doi: 10.1073/pnas.1605334113. - DOI - PMC - PubMed
    1. Lee JJ, et al. Gene discovery and polygenic prediction from a genome-wide association study of educational attainment in 1.1 million individuals. Nat. Genet. 2018;50:1112–1121. doi: 10.1038/s41588-018-0147-3. - DOI - PMC - PubMed
    1. Bycroft C, et al. The UK Biobank resource with deep phenotyping and genomic data. Nature. 2018;562:203–209. doi: 10.1038/s41586-018-0579-z. - DOI - PMC - PubMed
    1. Harden KP, et al. Genetic associations with mathematics tracking and persistence in secondary school. NPJ Sci. Learn. 2020;5:1. doi: 10.1038/s41539-020-0060-2. - DOI - PMC - PubMed
    1. Kong A, et al. The nature of nurture: effects of parental genotypes. Science. 2018;359:424–428. doi: 10.1126/science.aan6877. - DOI - PubMed

Publication types

MeSH terms