. 2022 Apr;40(4):585-597.
doi: 10.1038/s41587-022-01222-4. Epub 2022 Mar 31.

Inferring gene expression from cell-free DNA fragmentation profiles

Affiliations

Inferring gene expression from cell-free DNA fragmentation profiles

Mohammad Shahrokh Esfahani et al. Nat Biotechnol. 2022 Apr.

Abstract

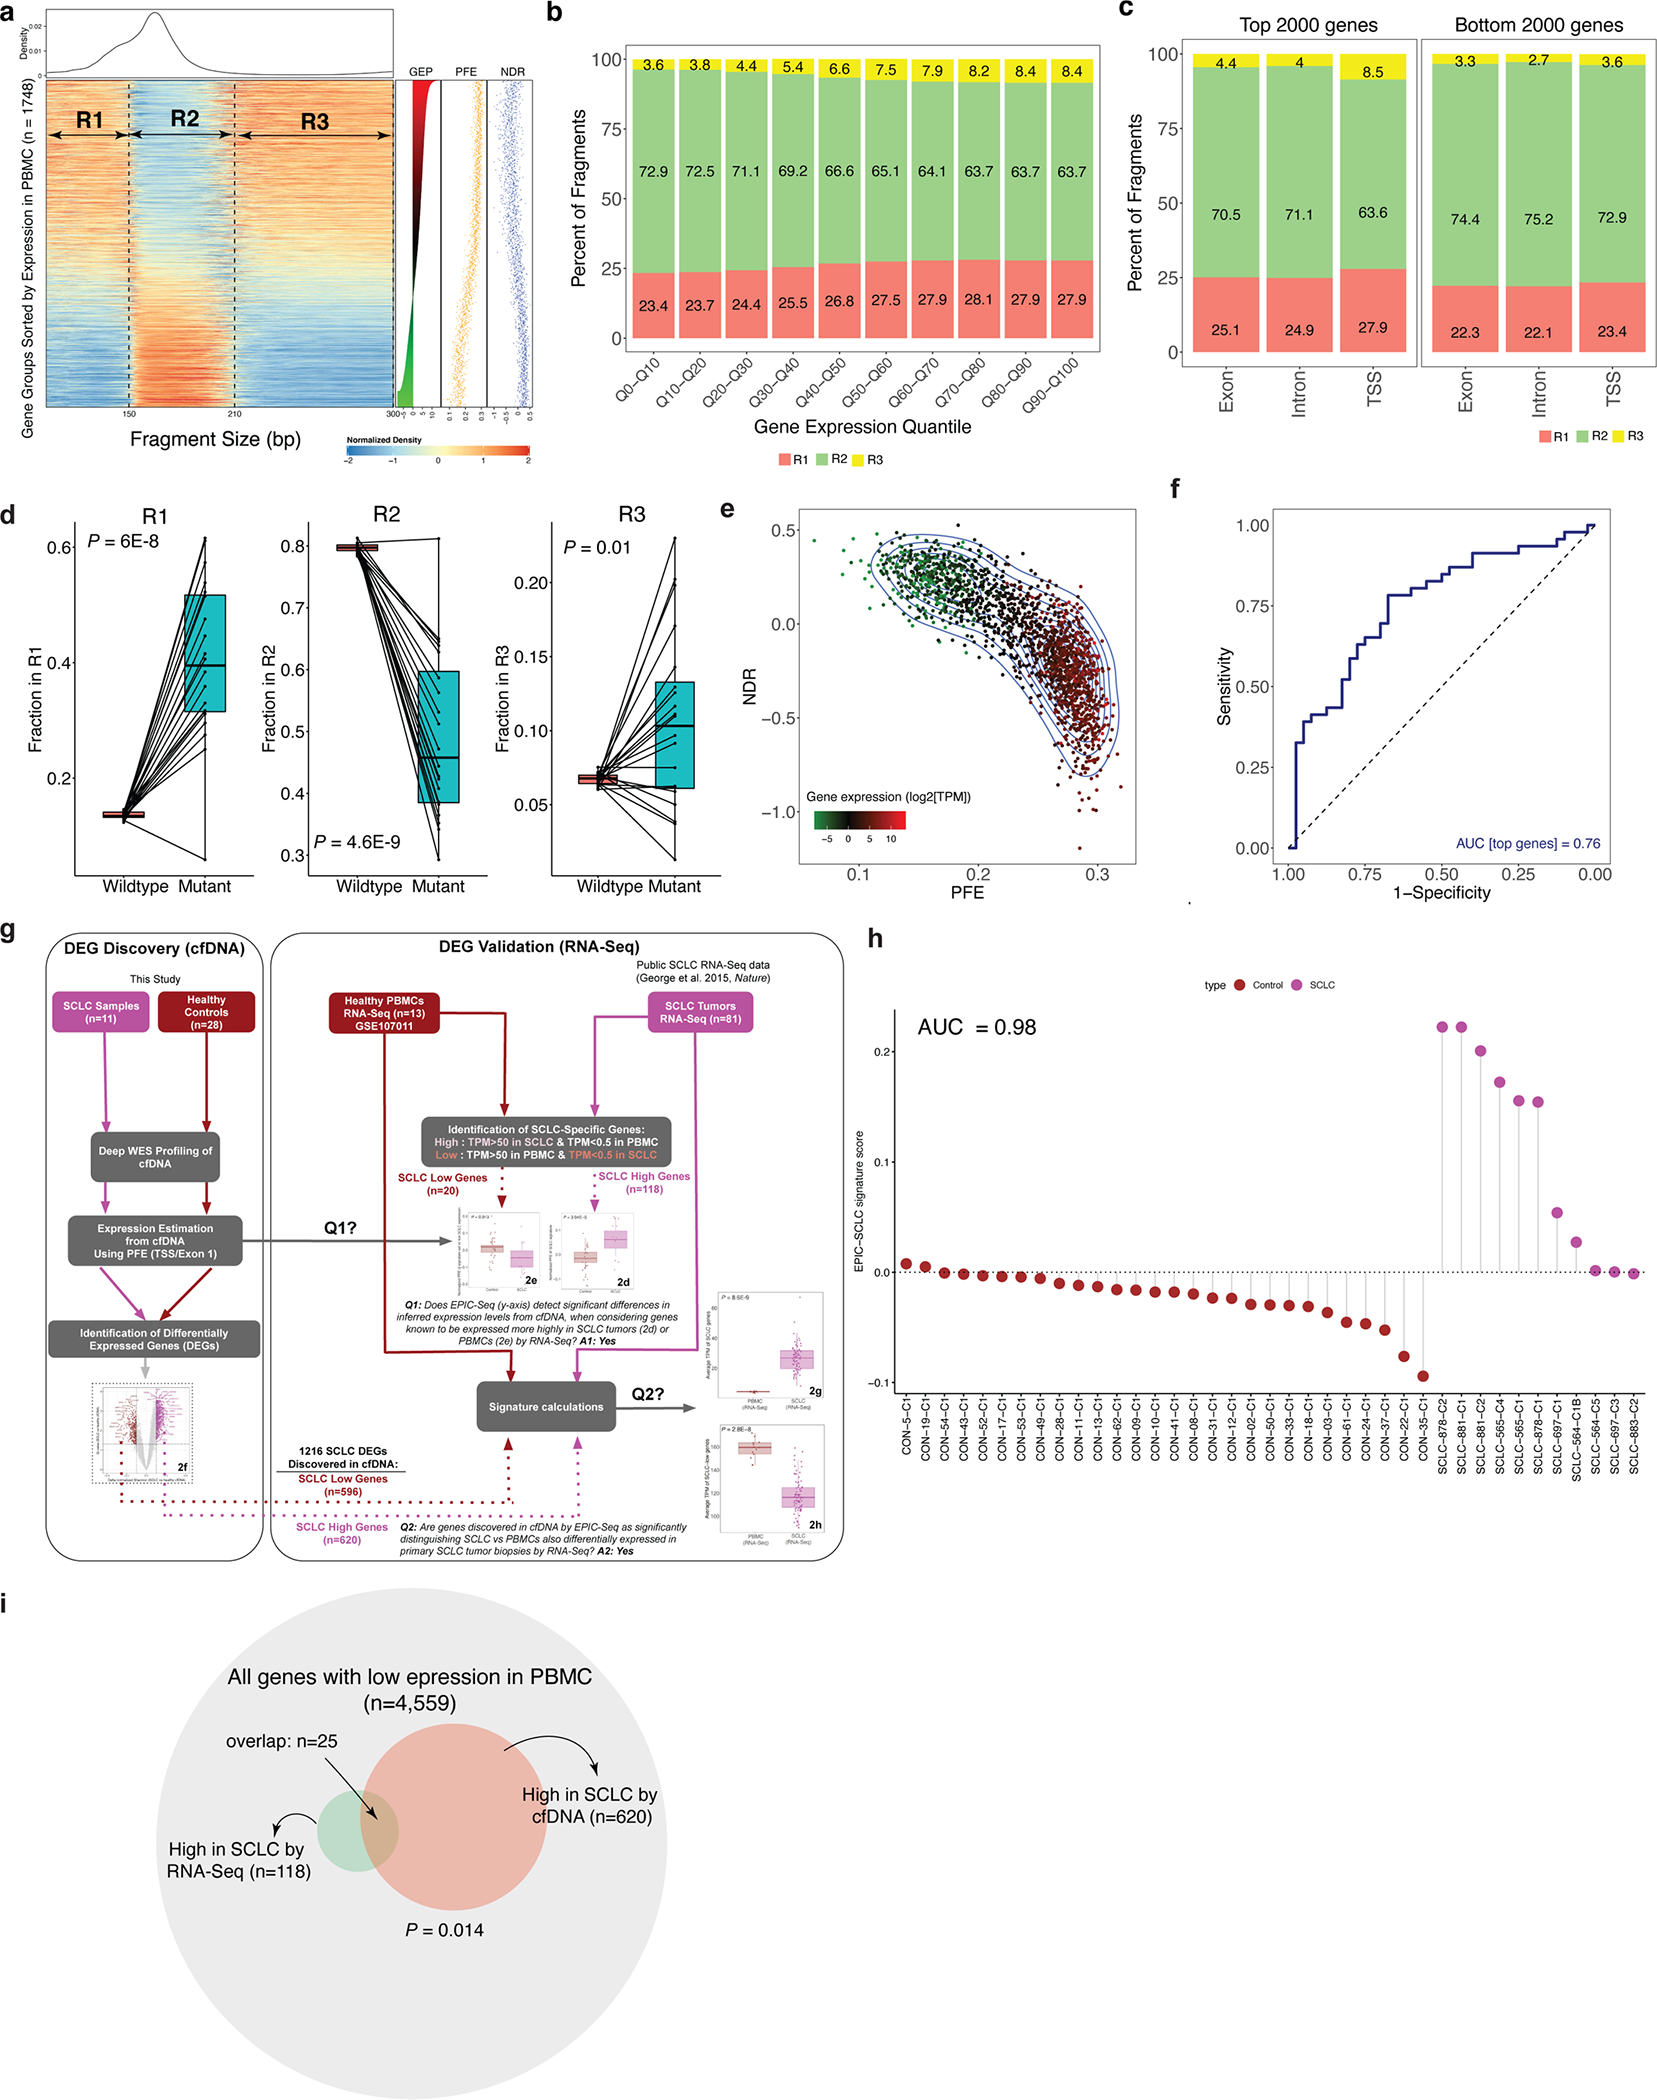
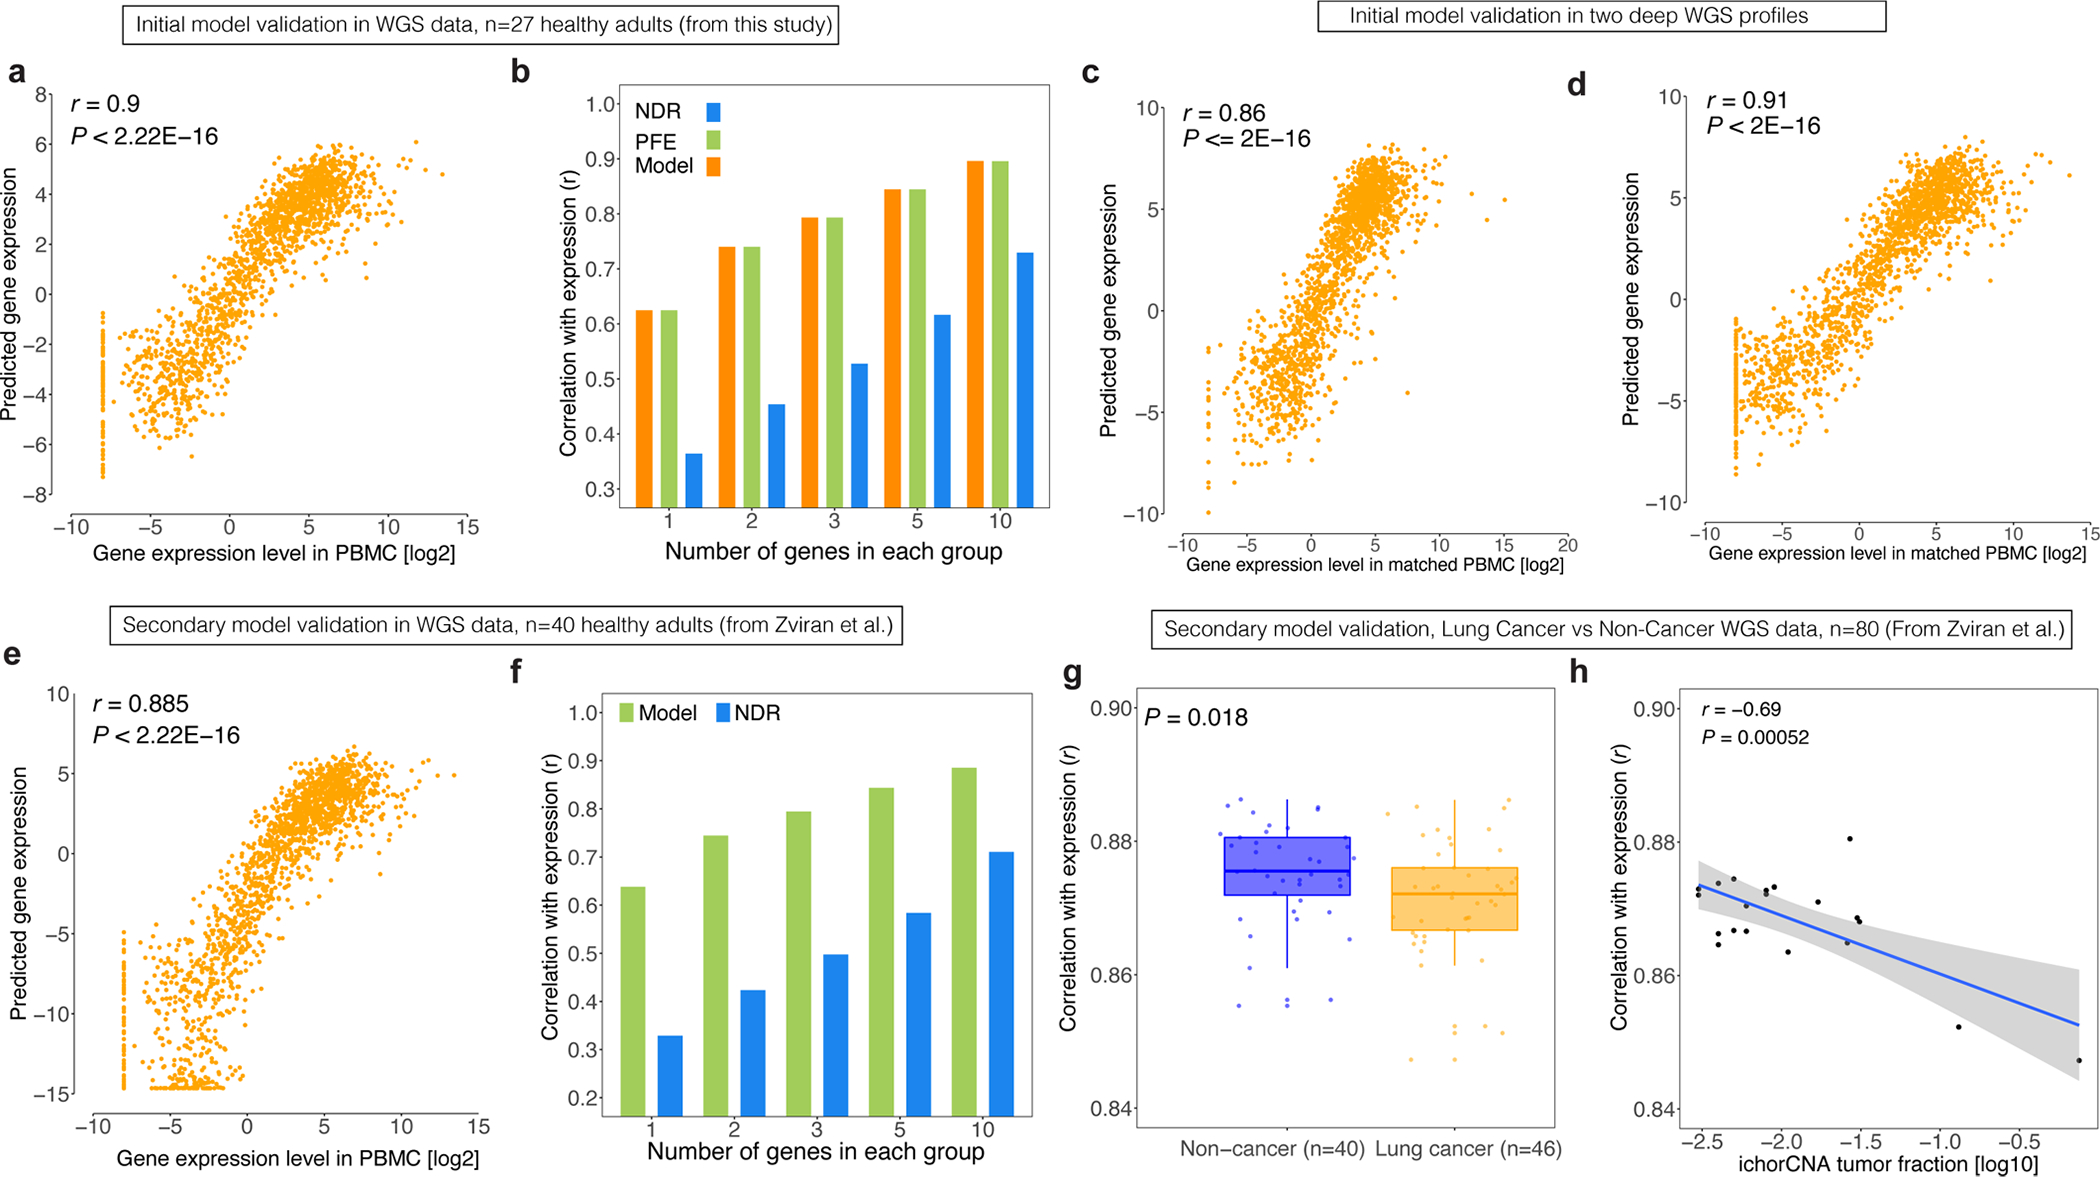
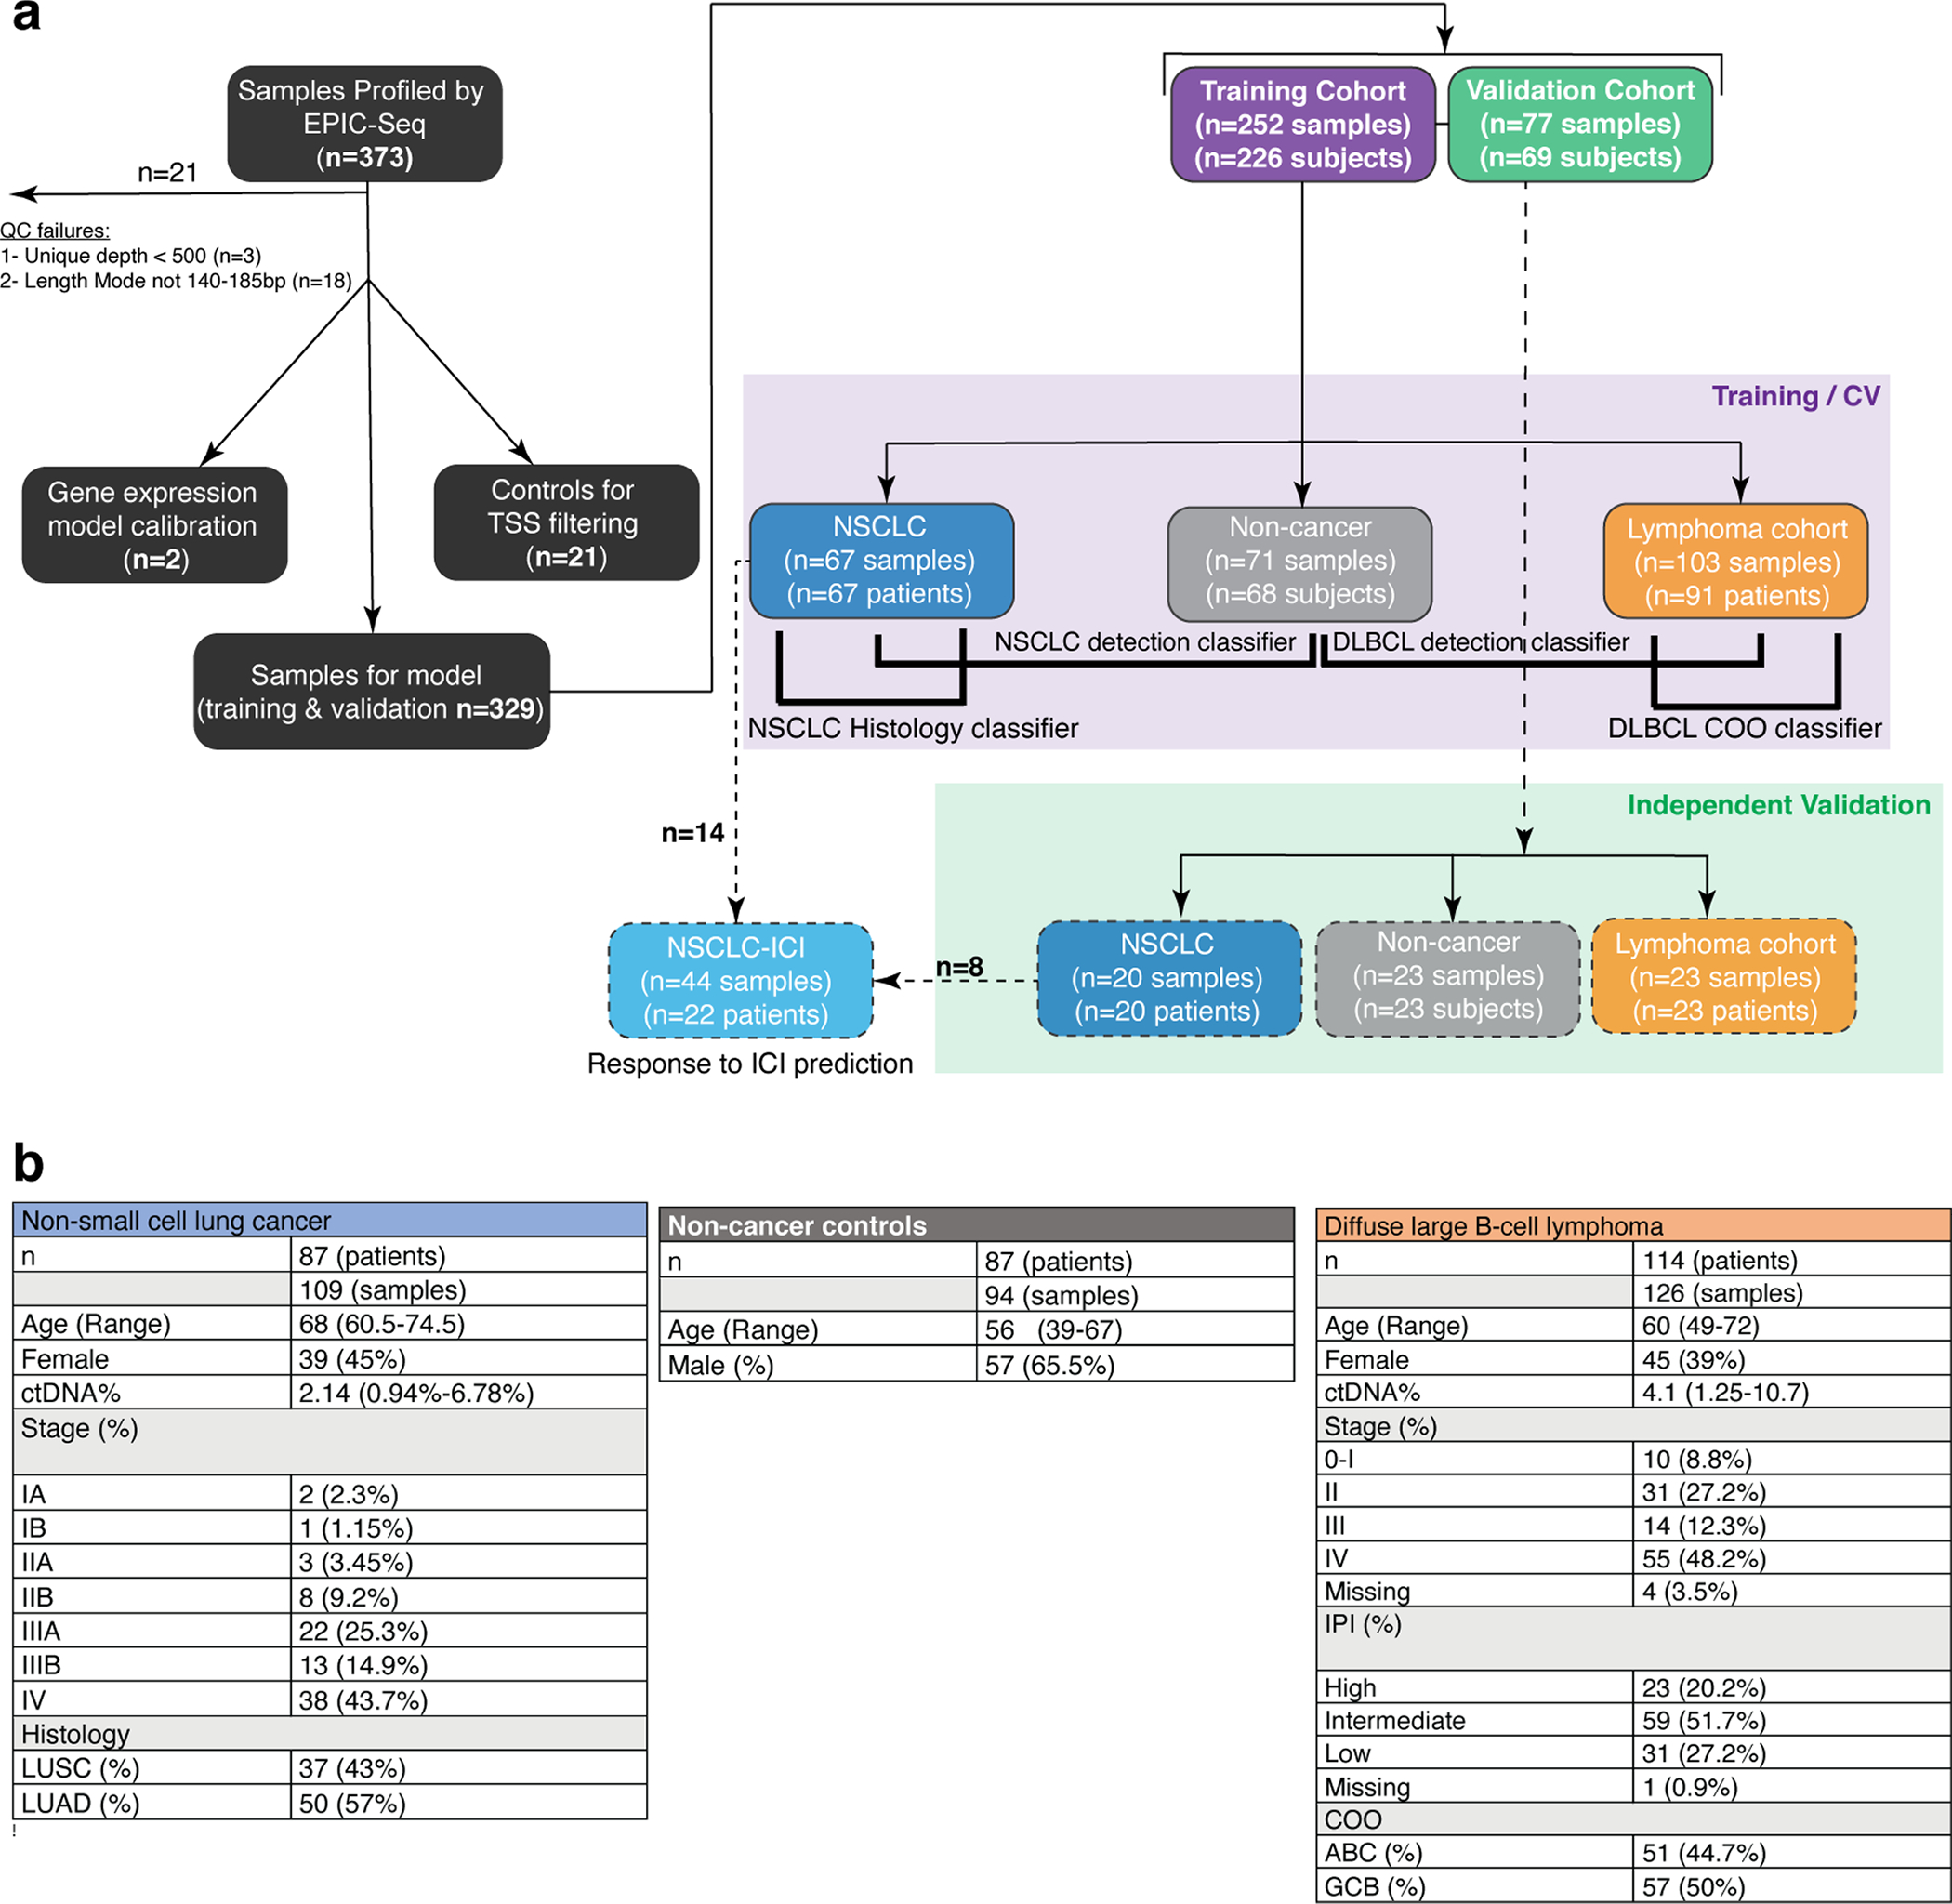
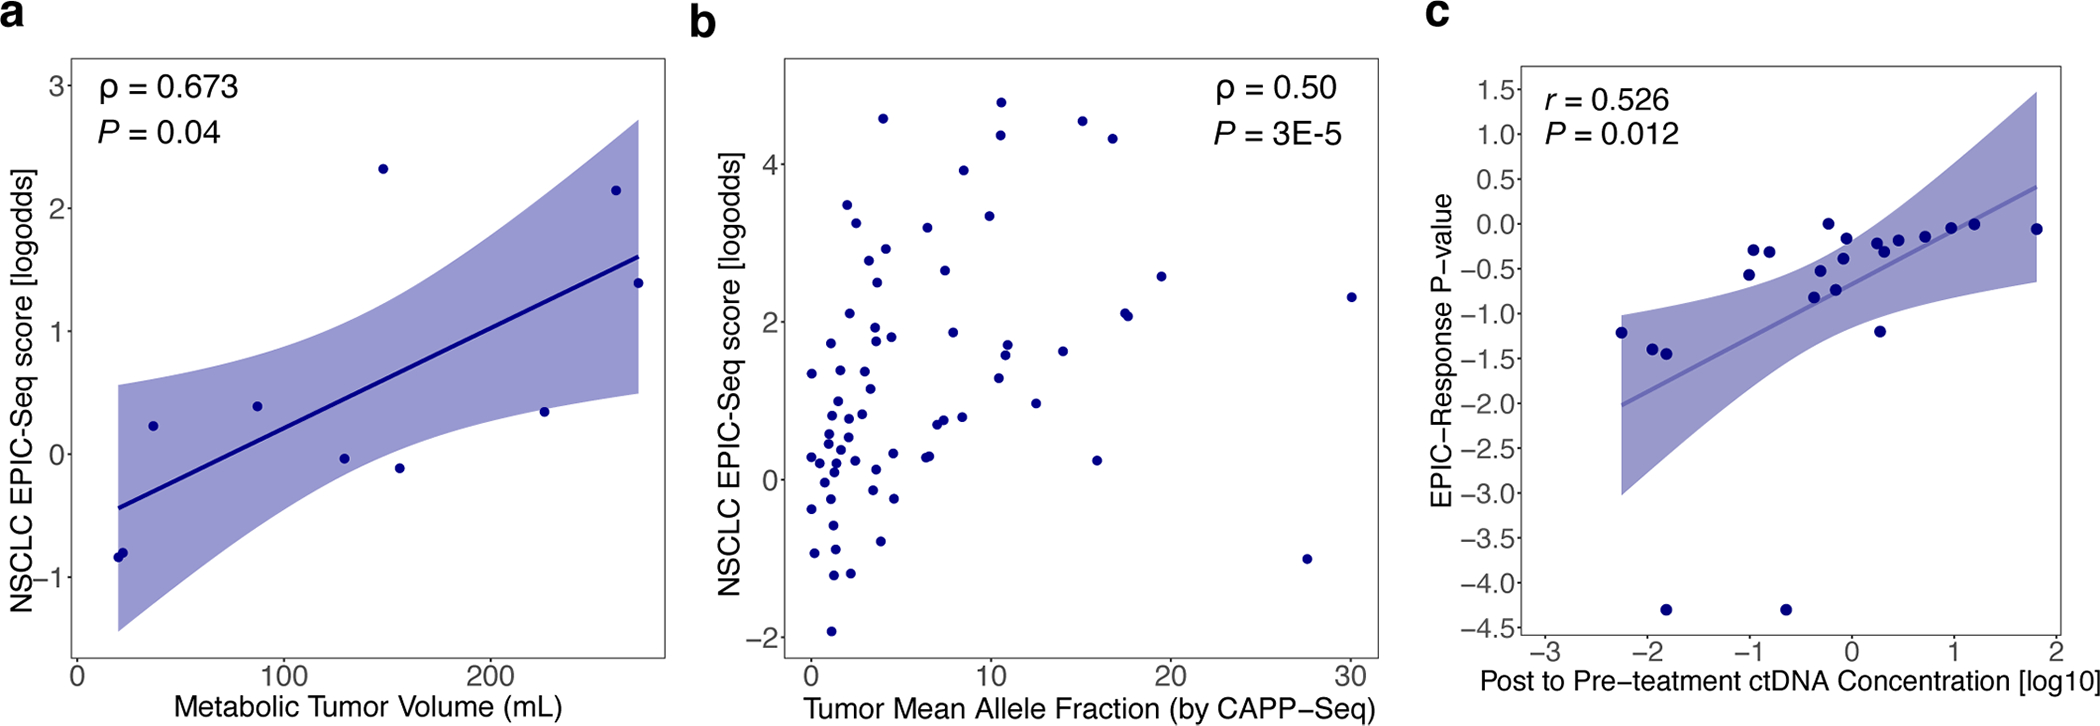
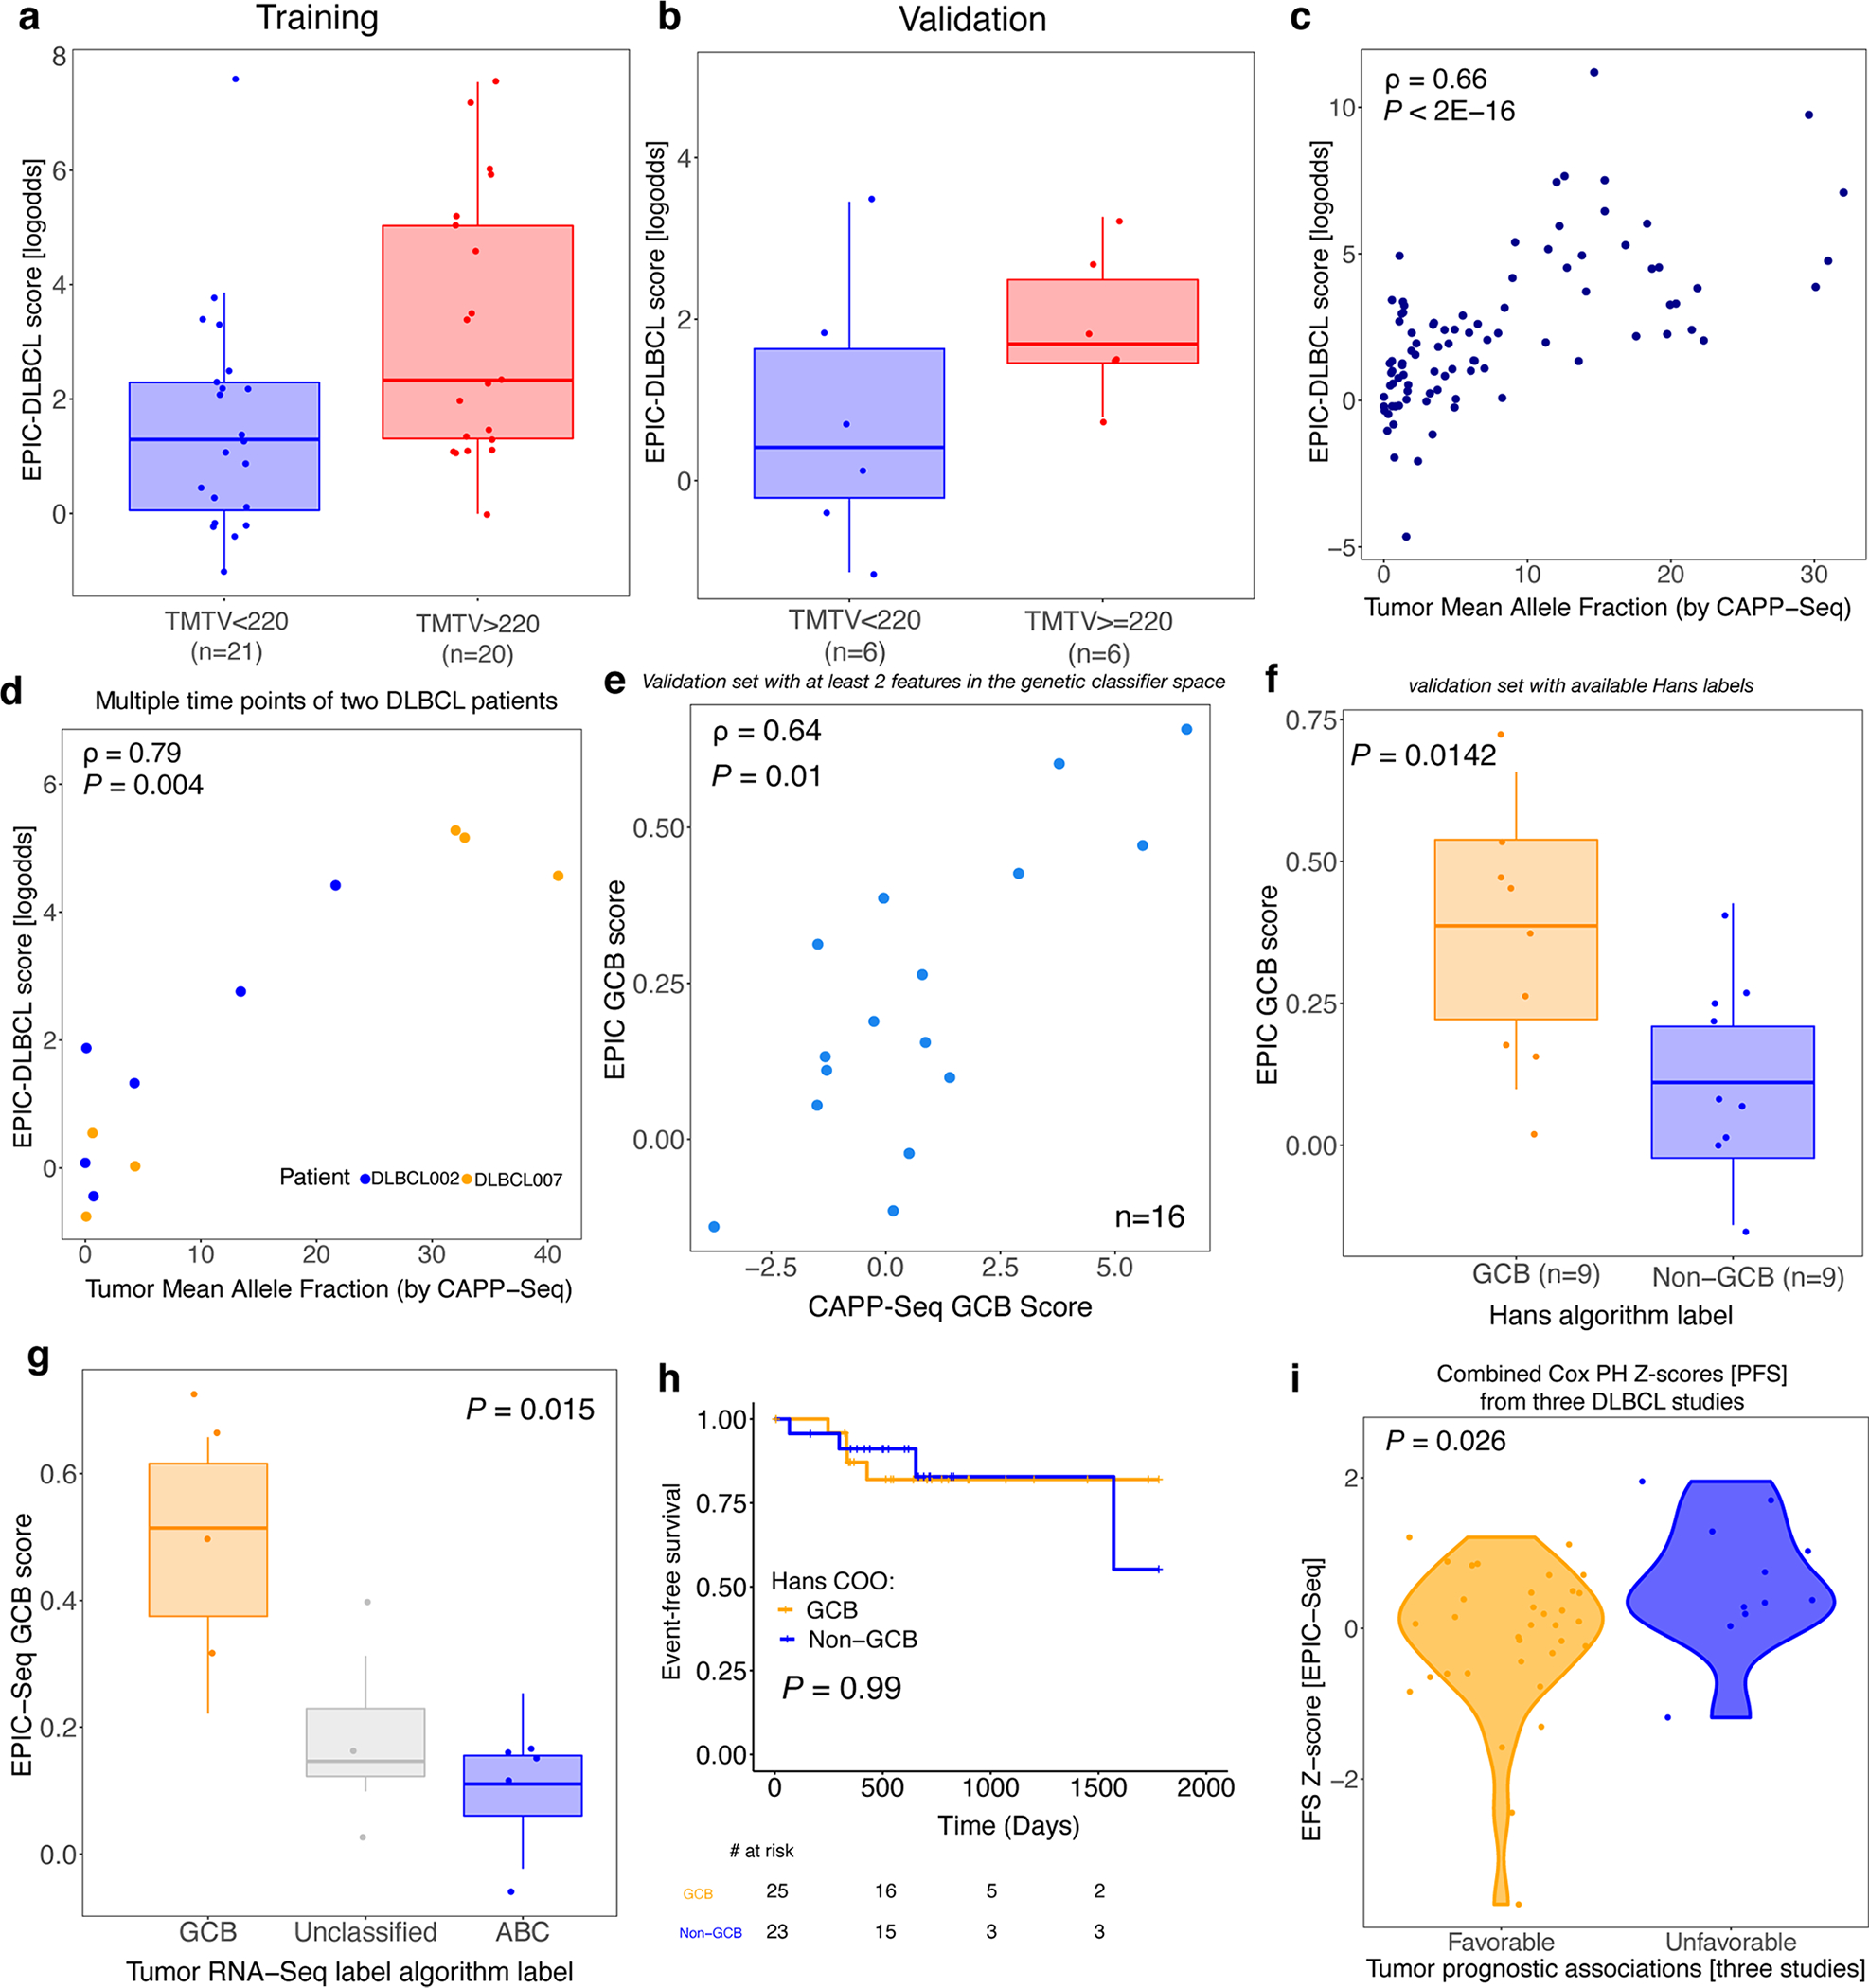
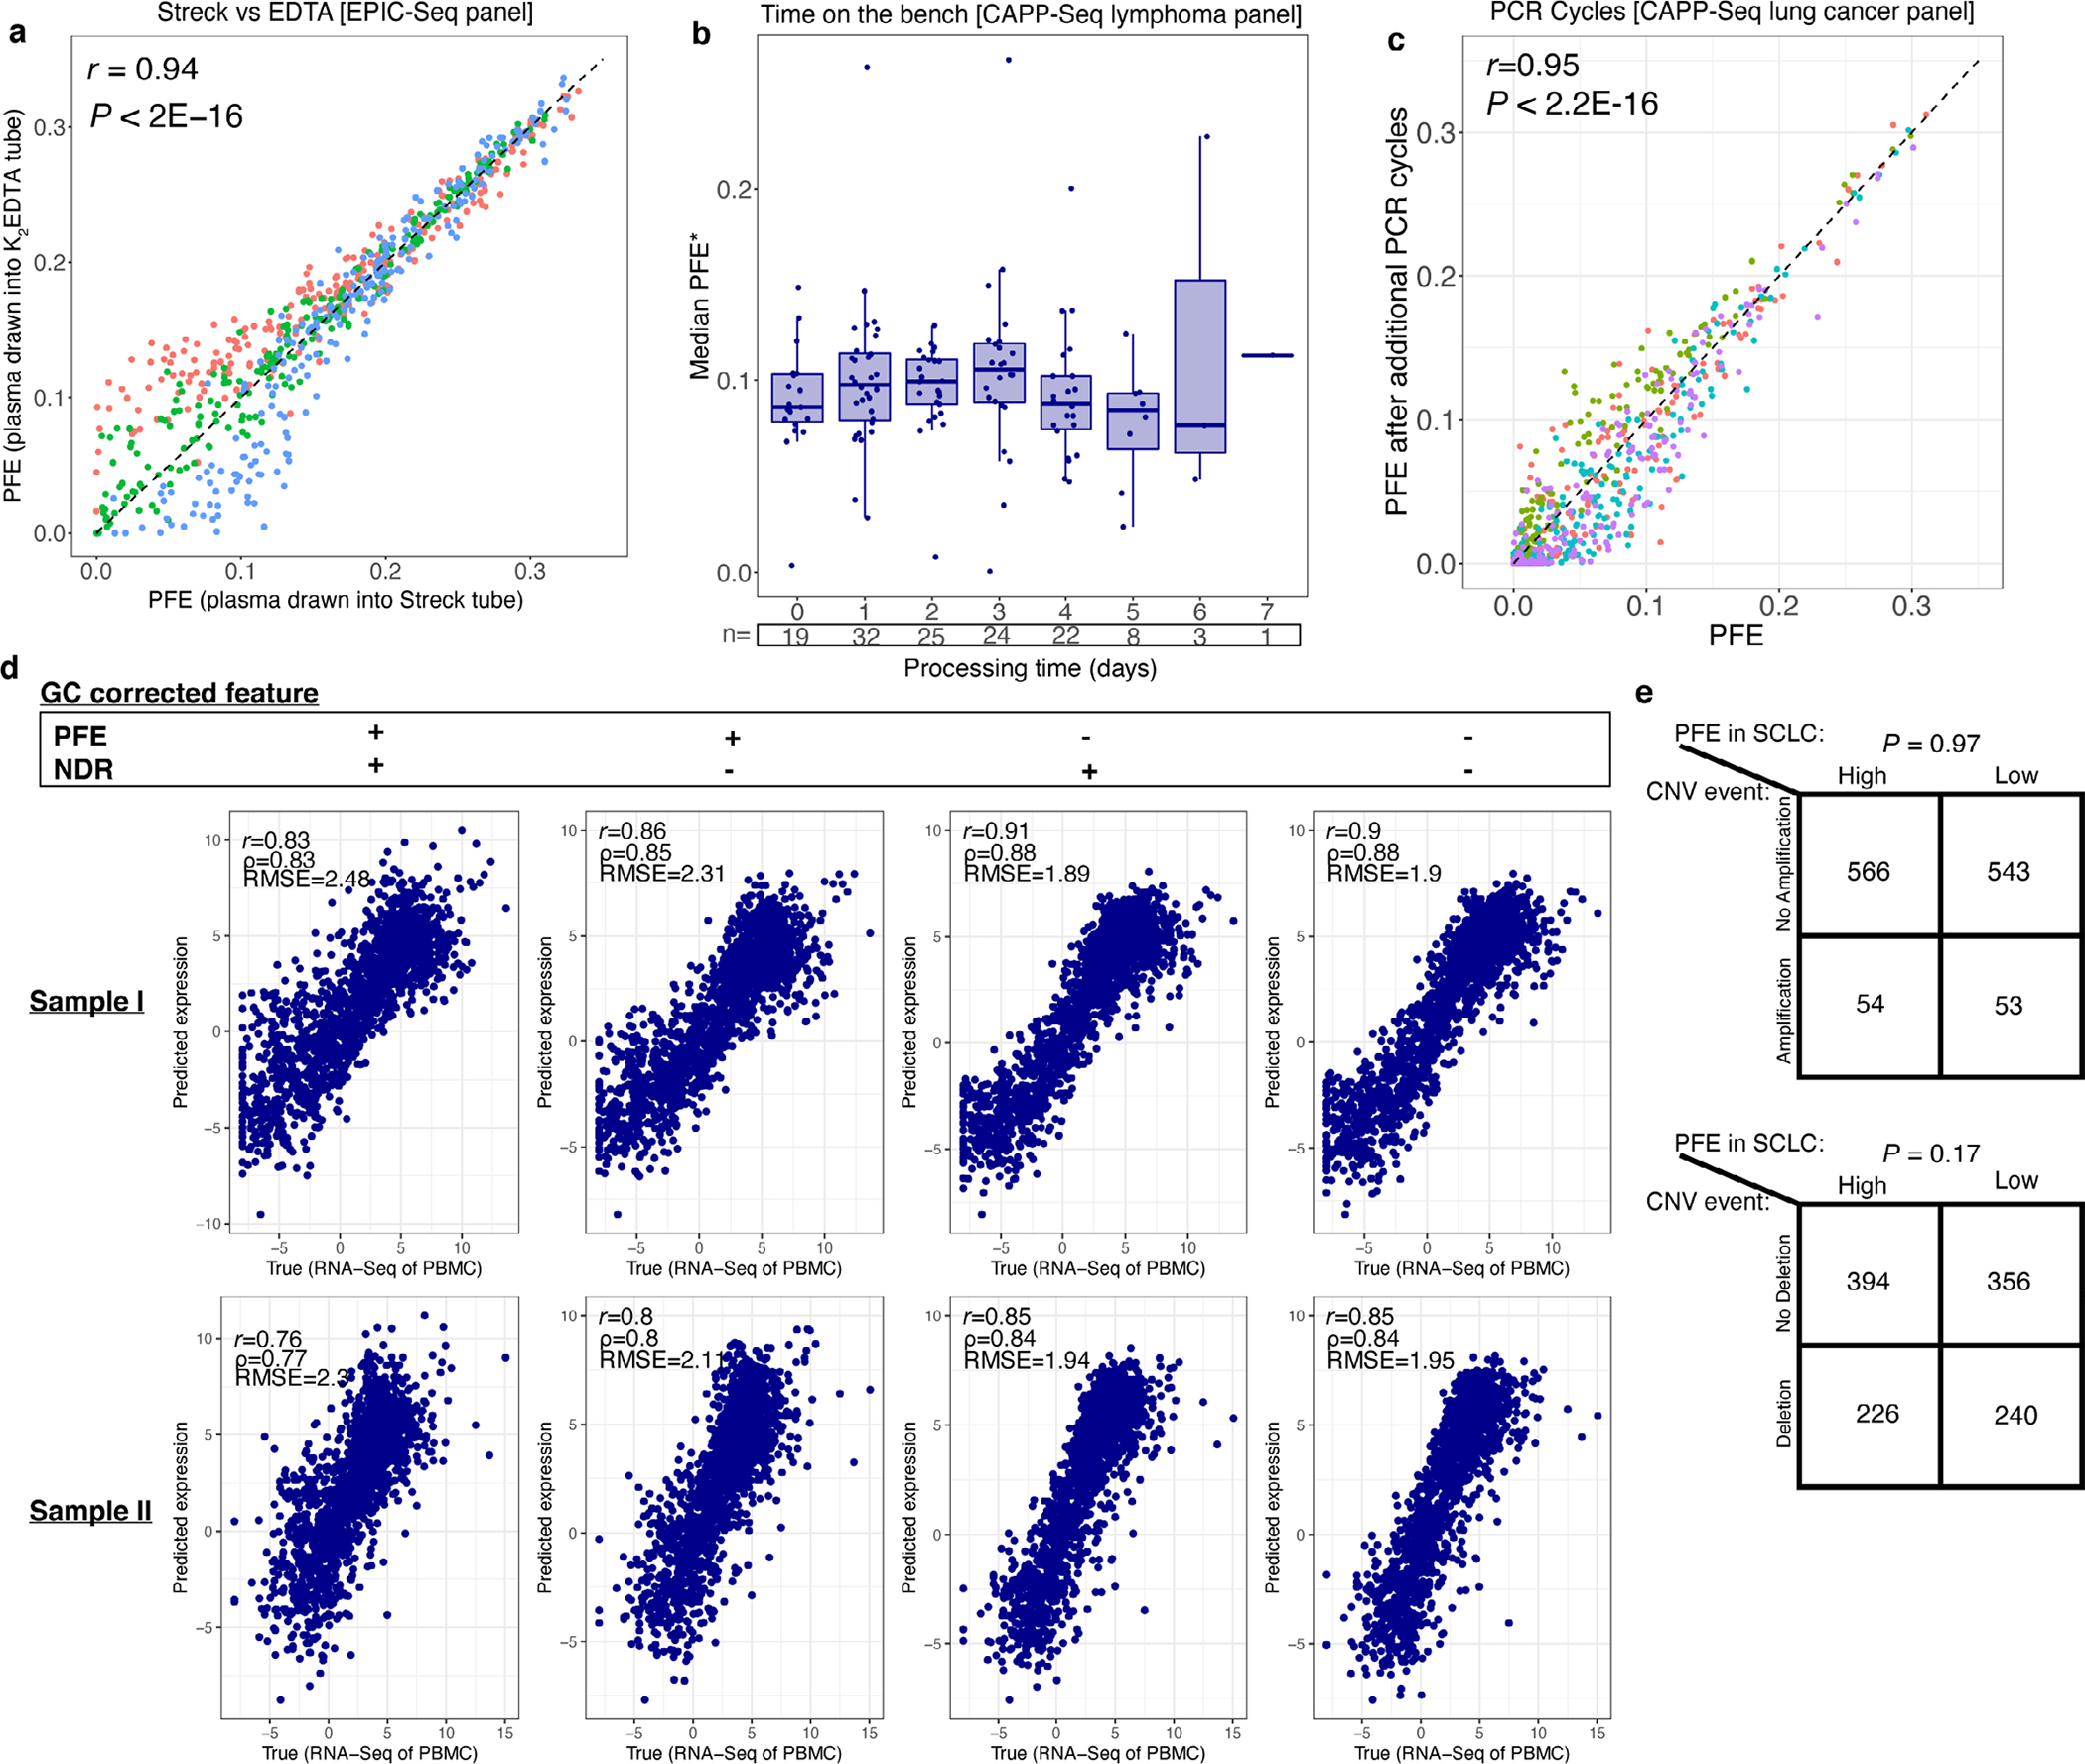
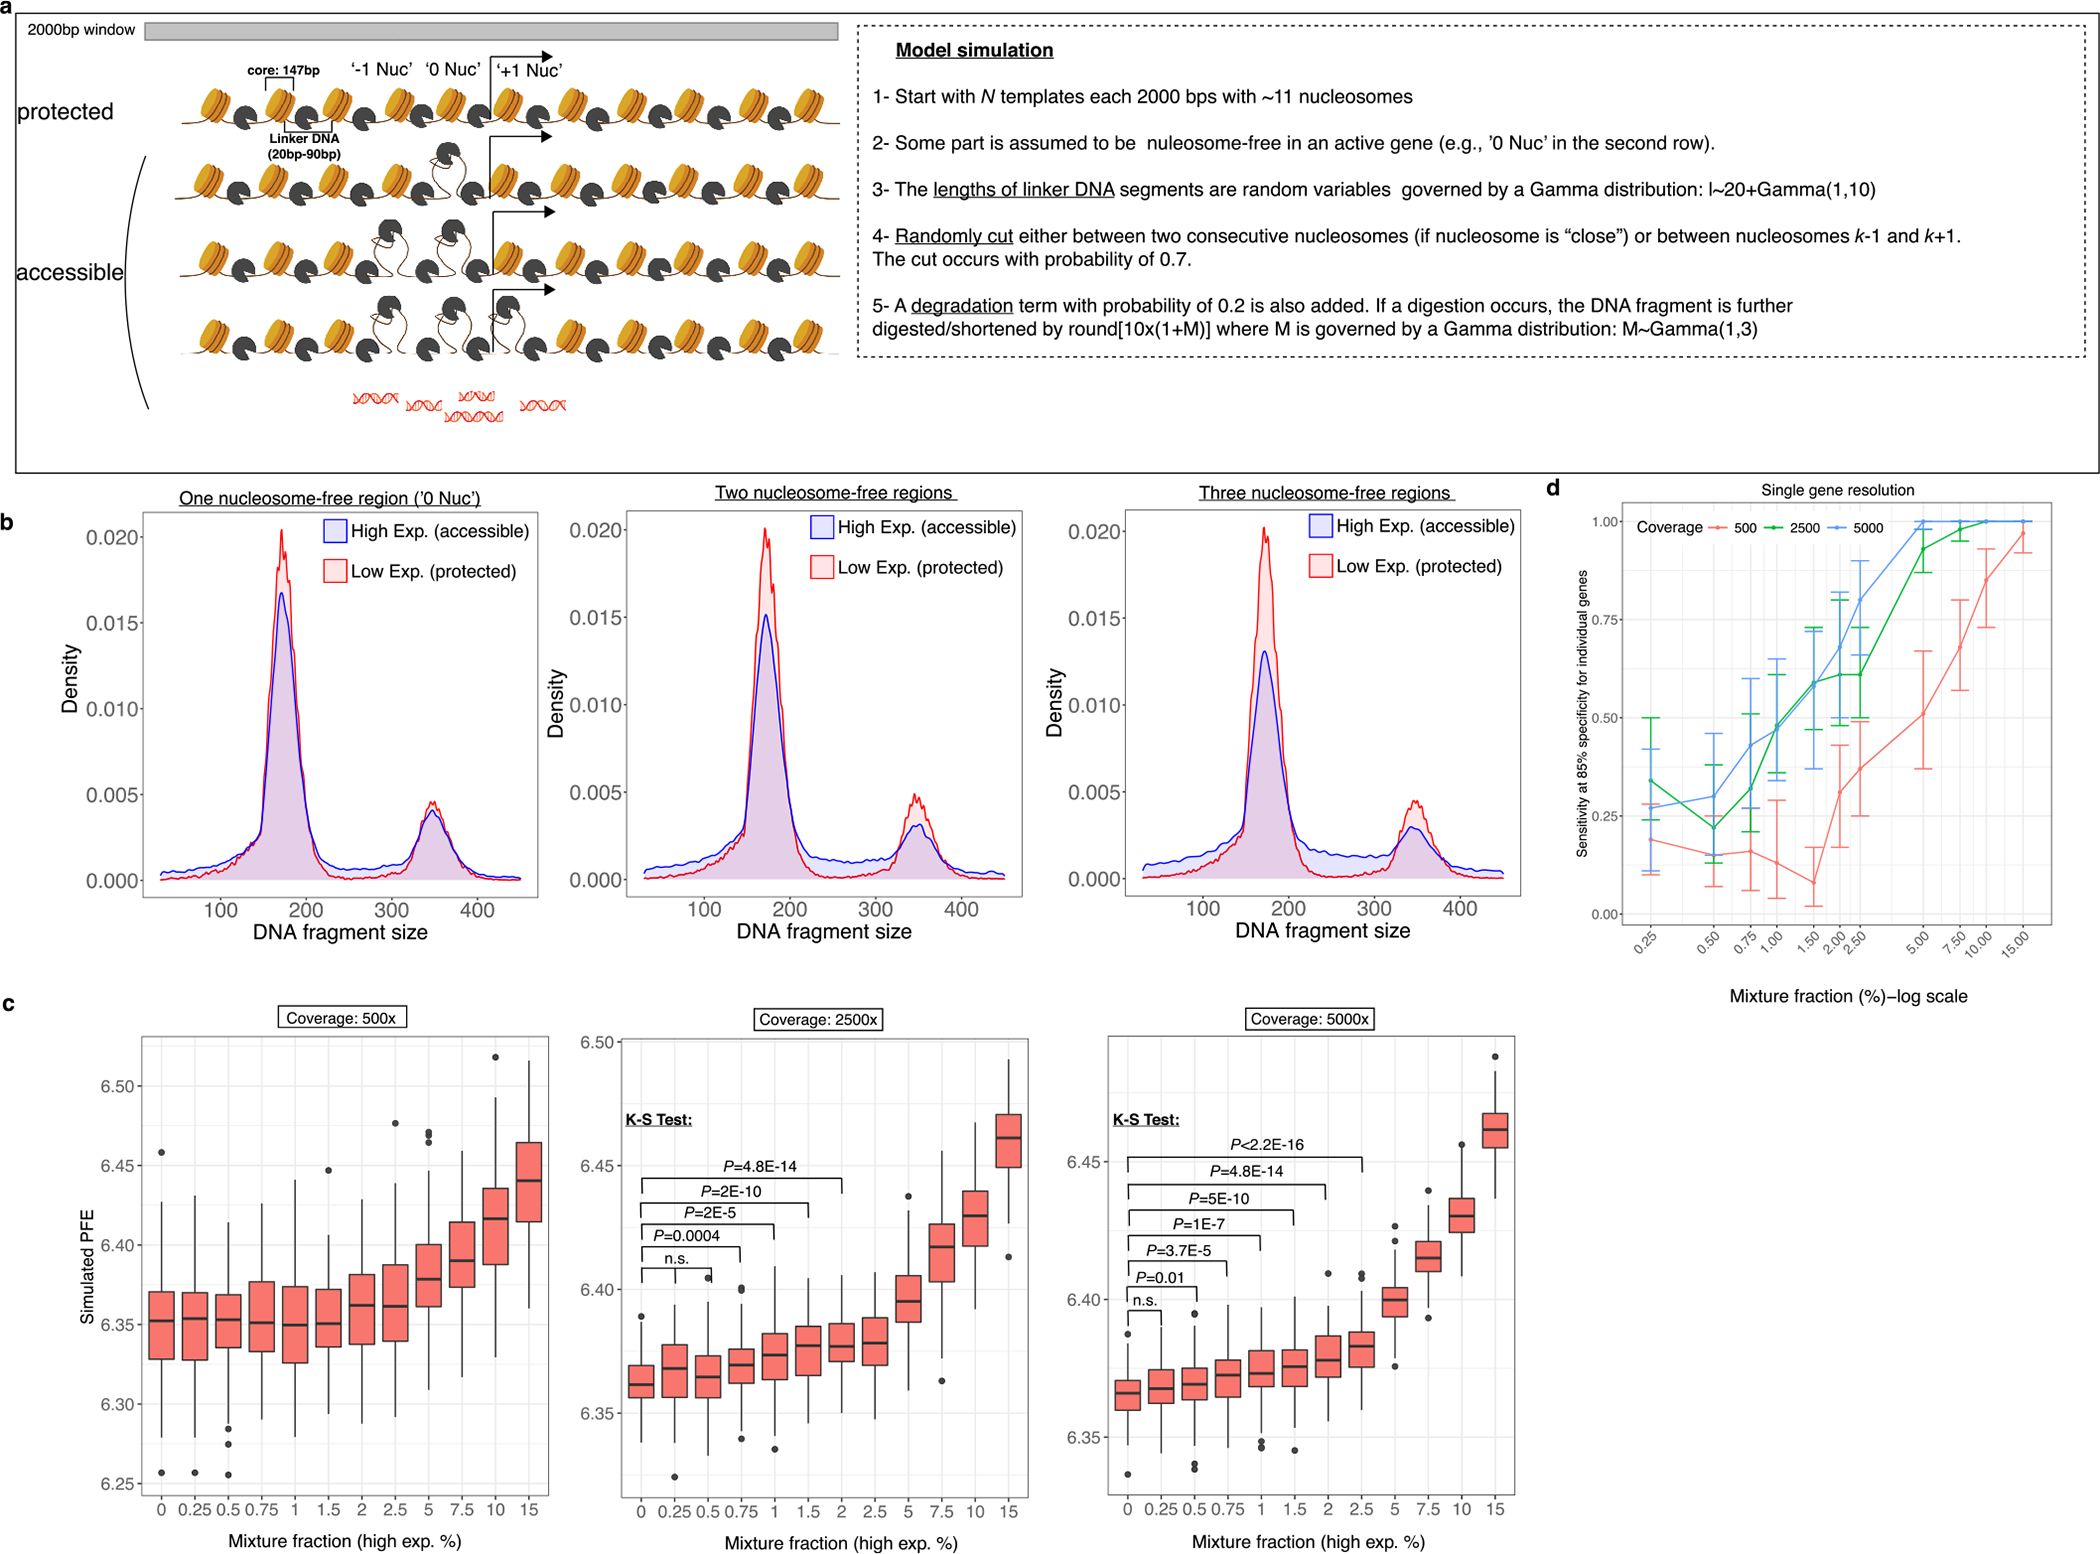
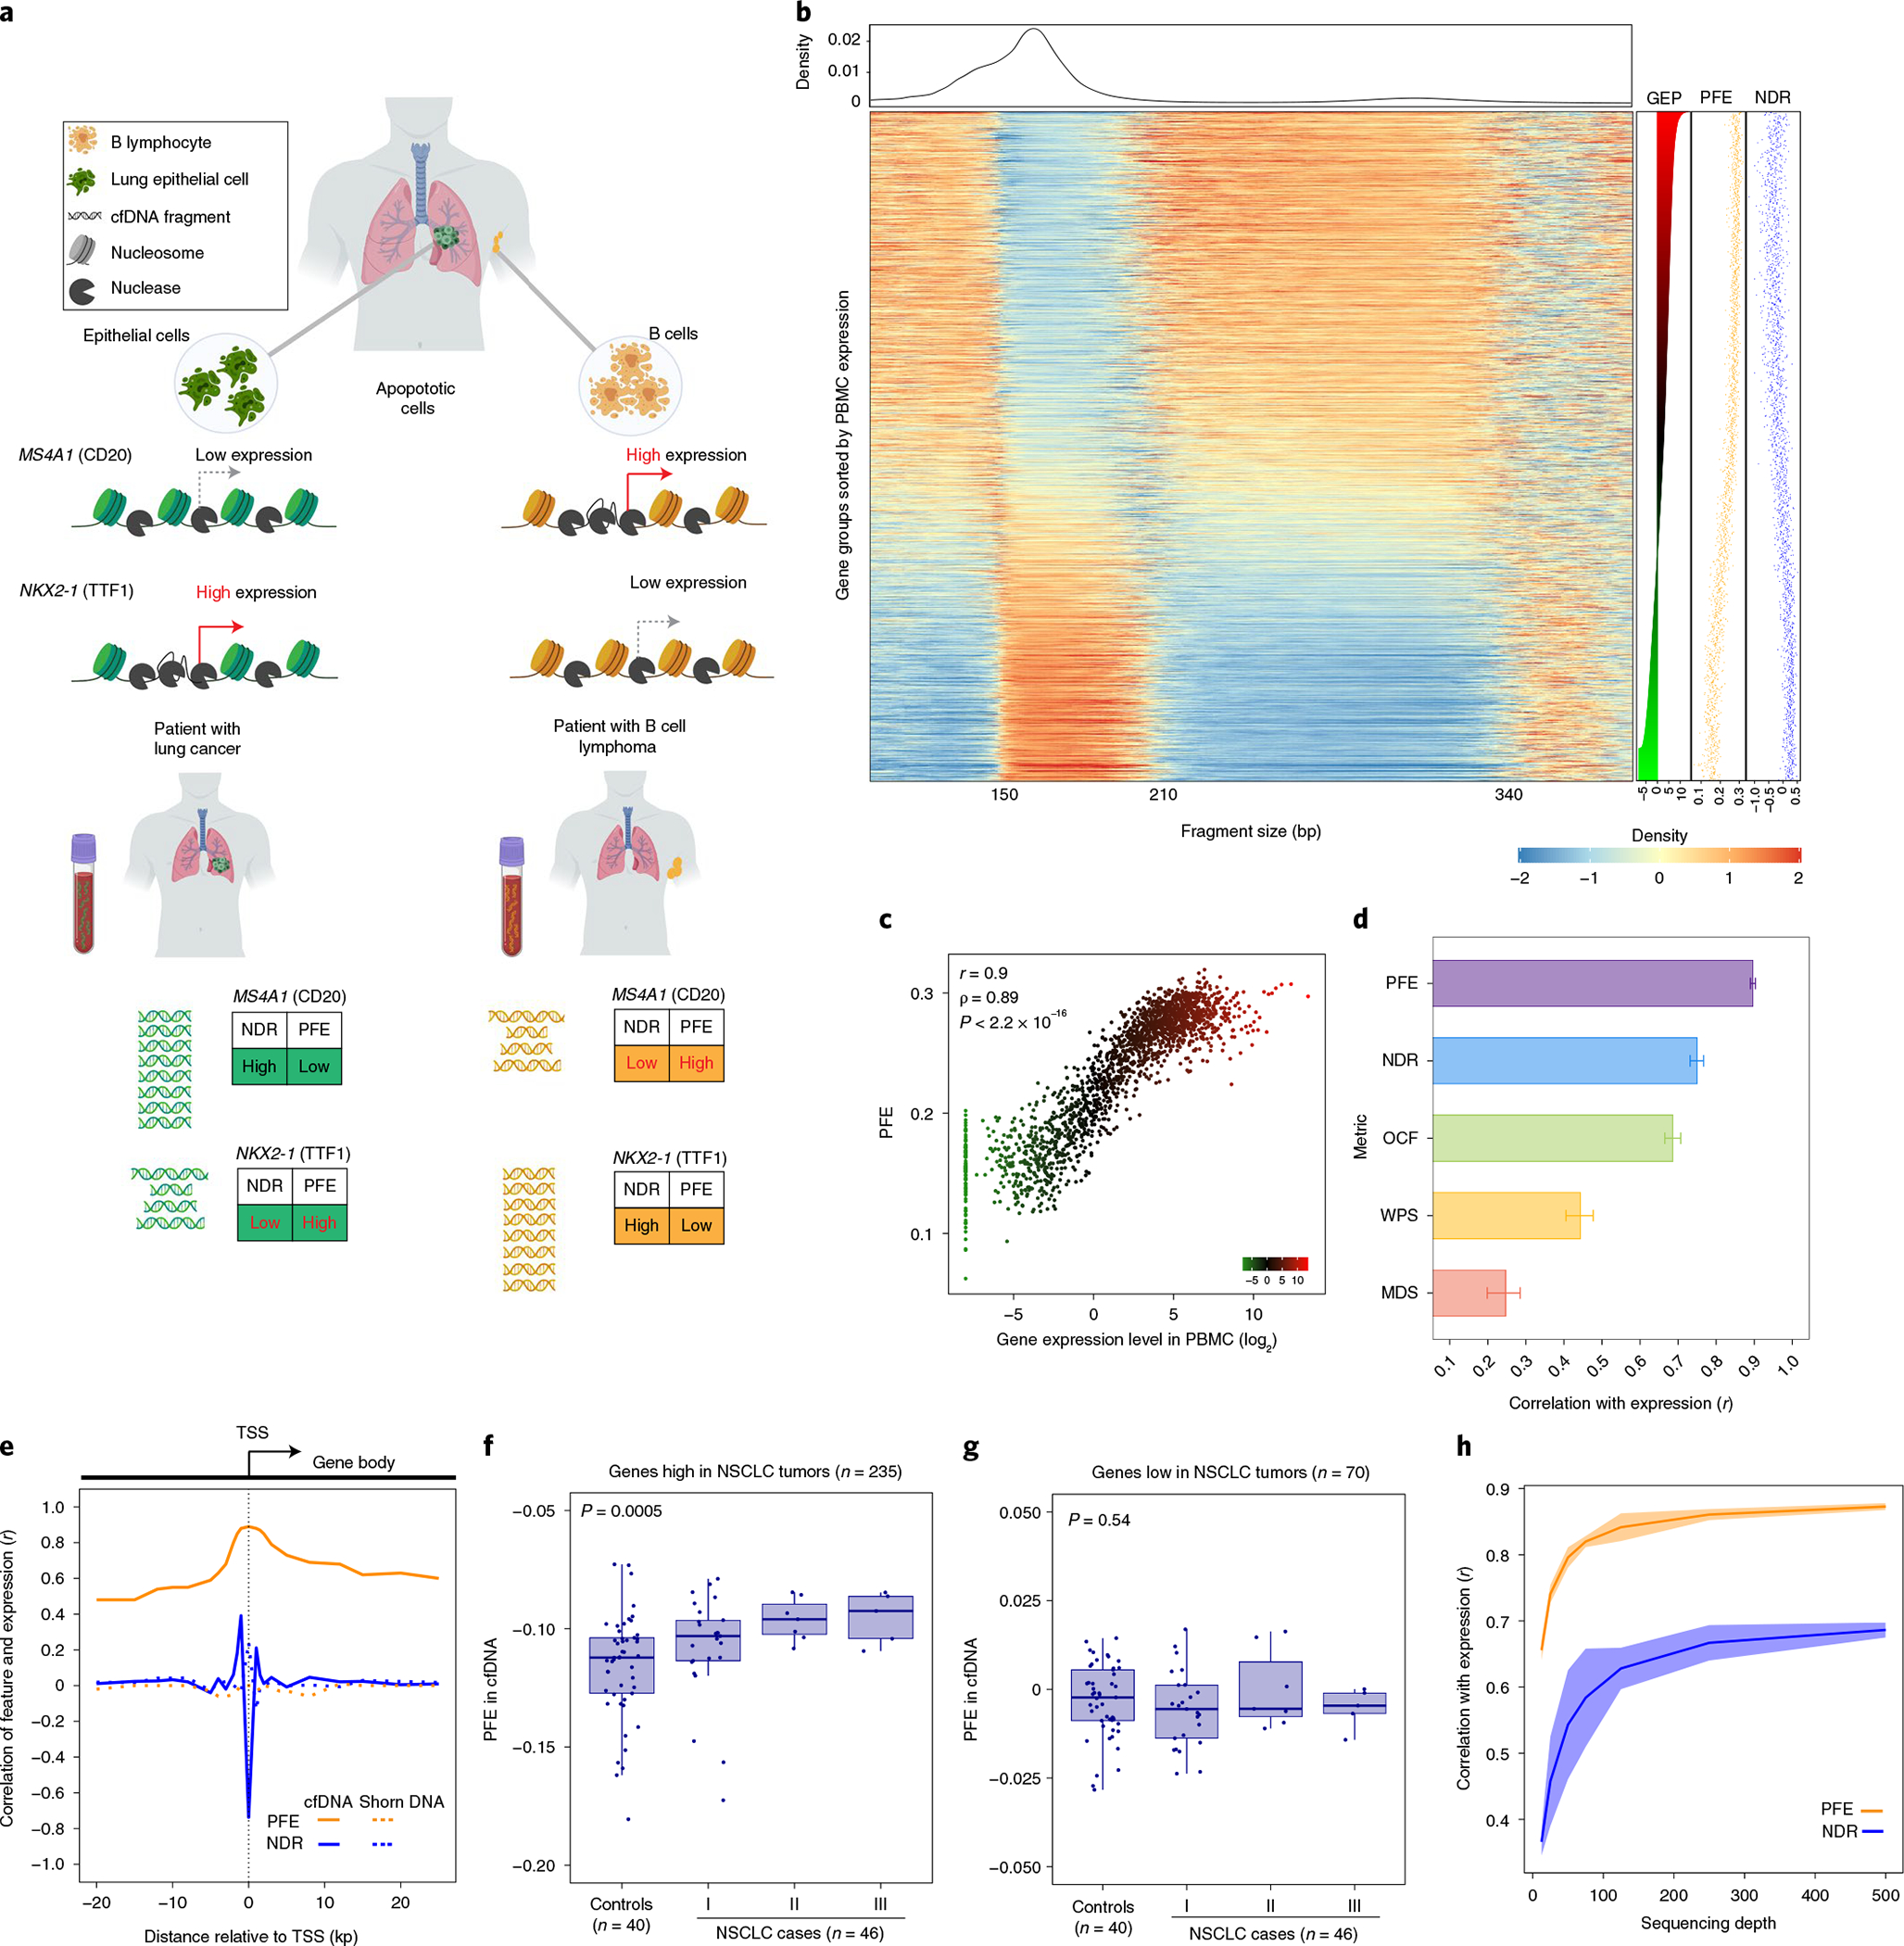
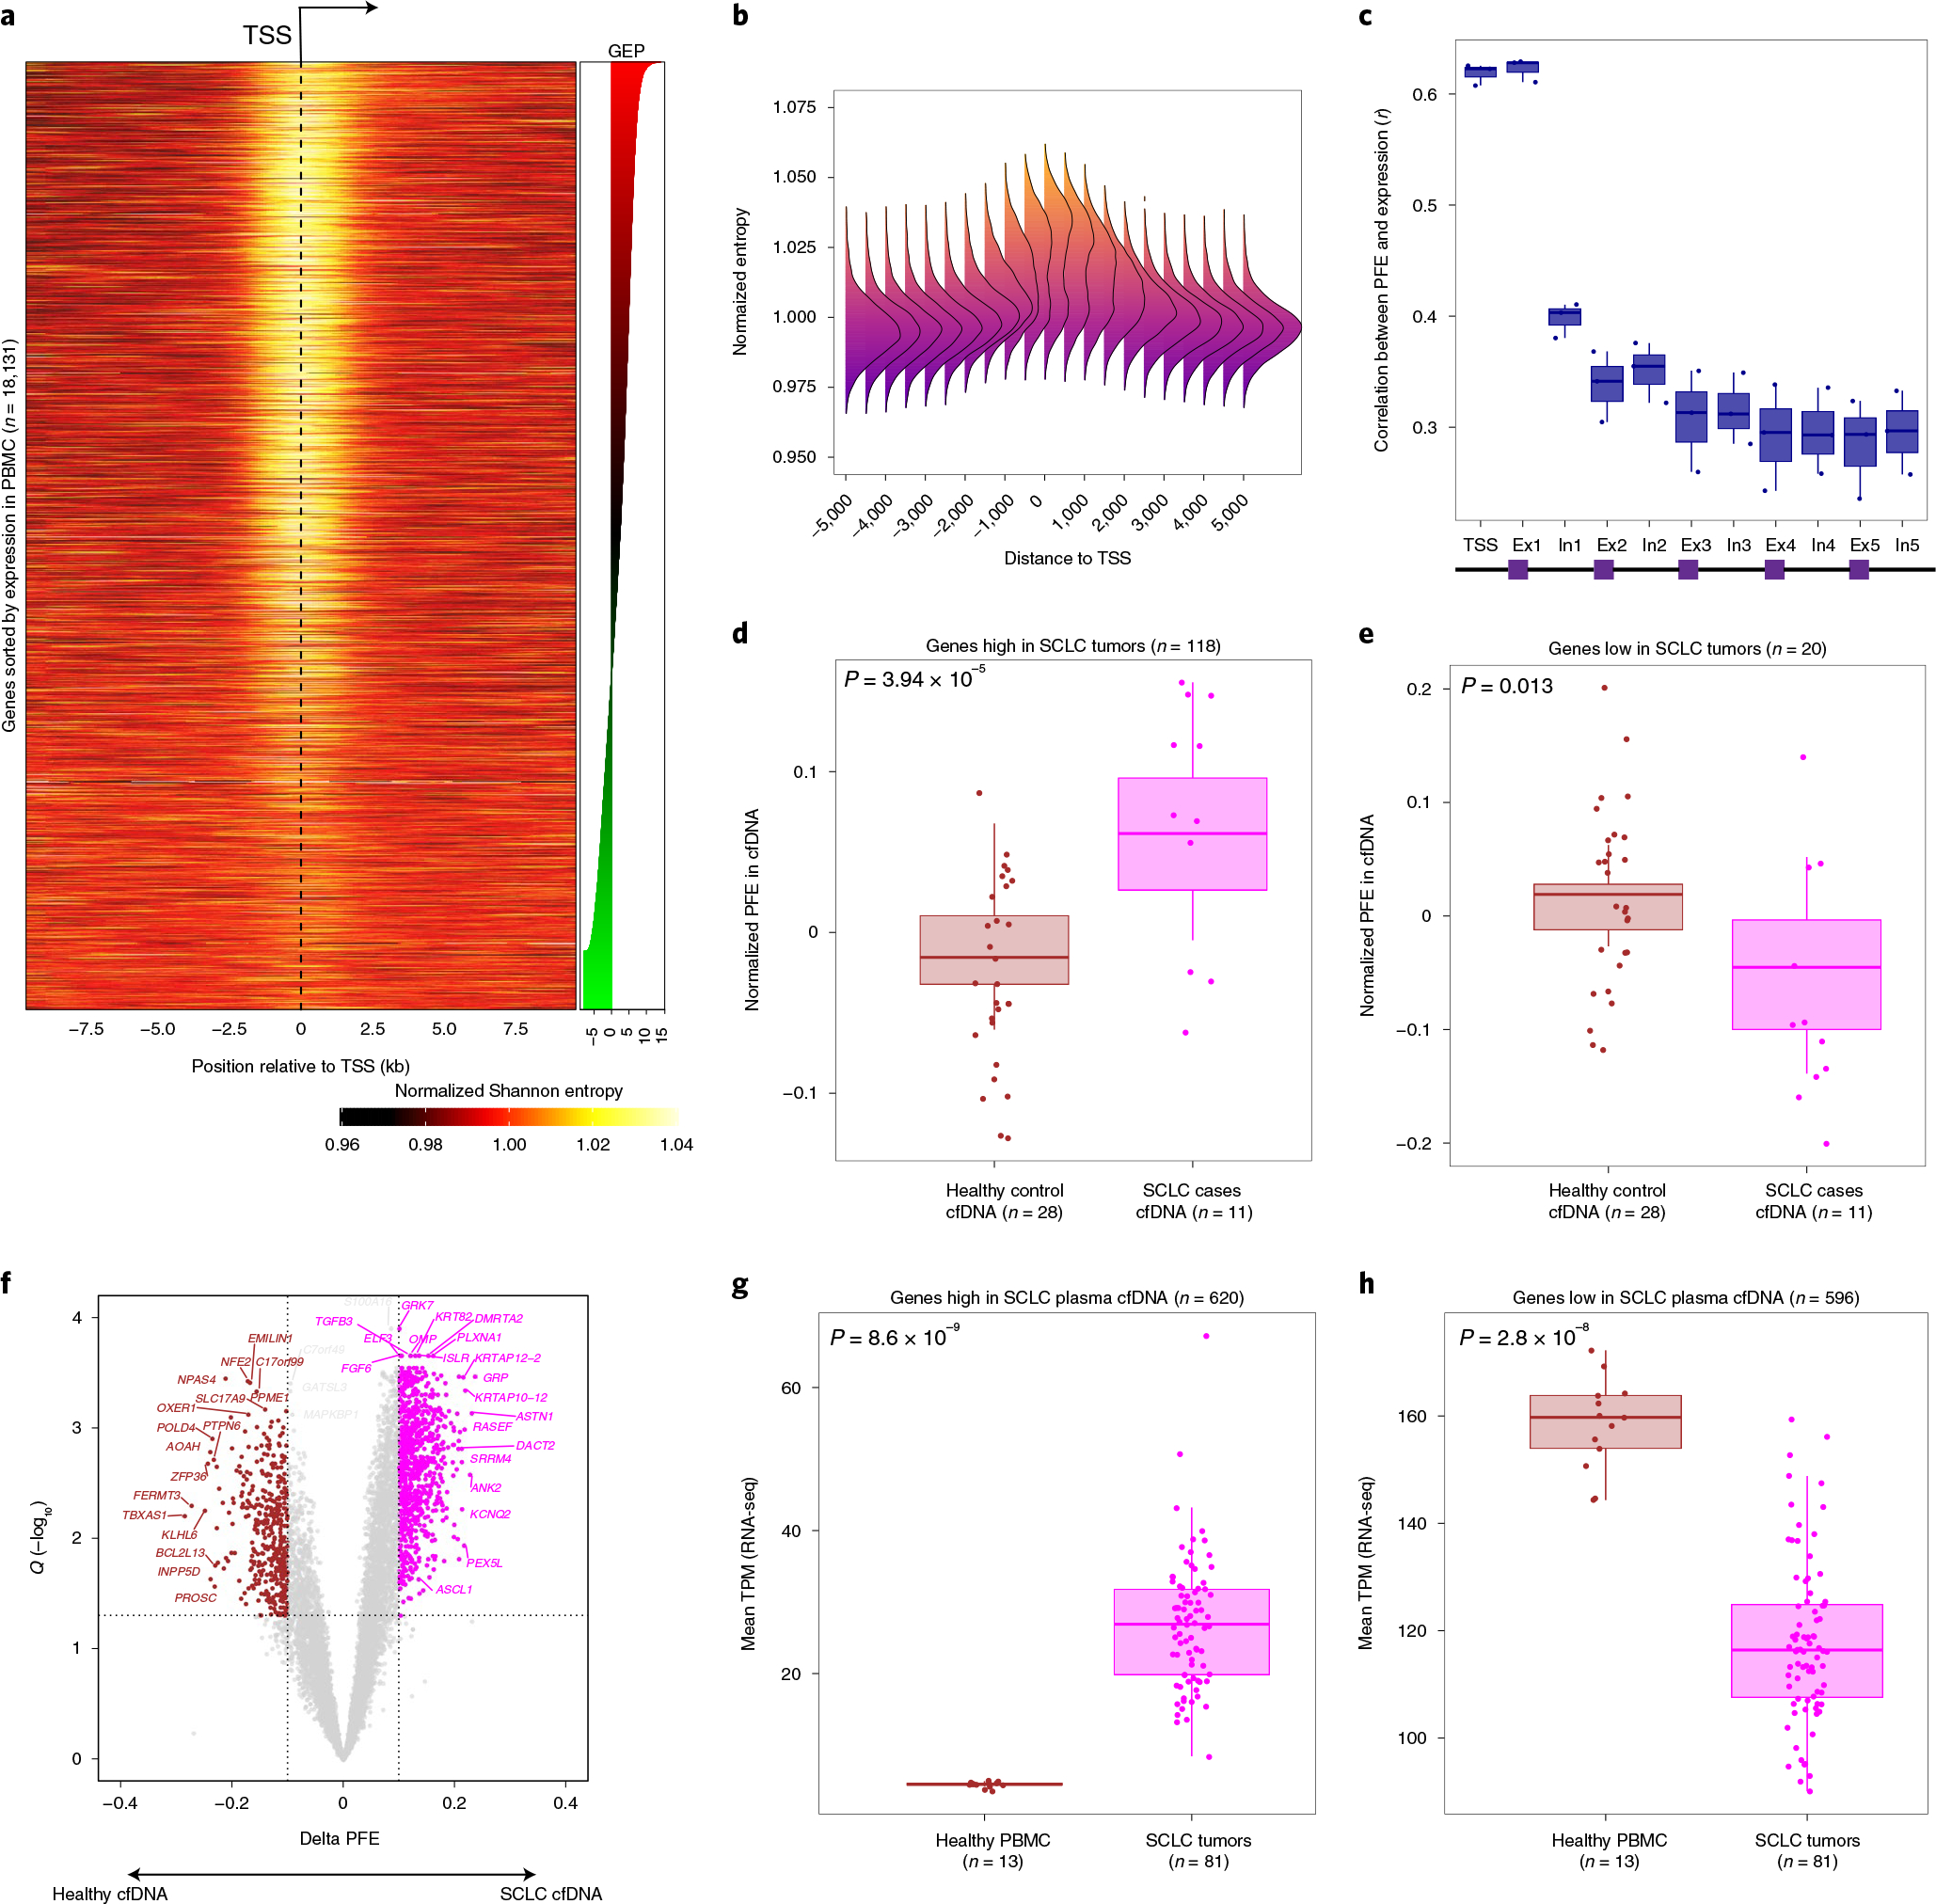
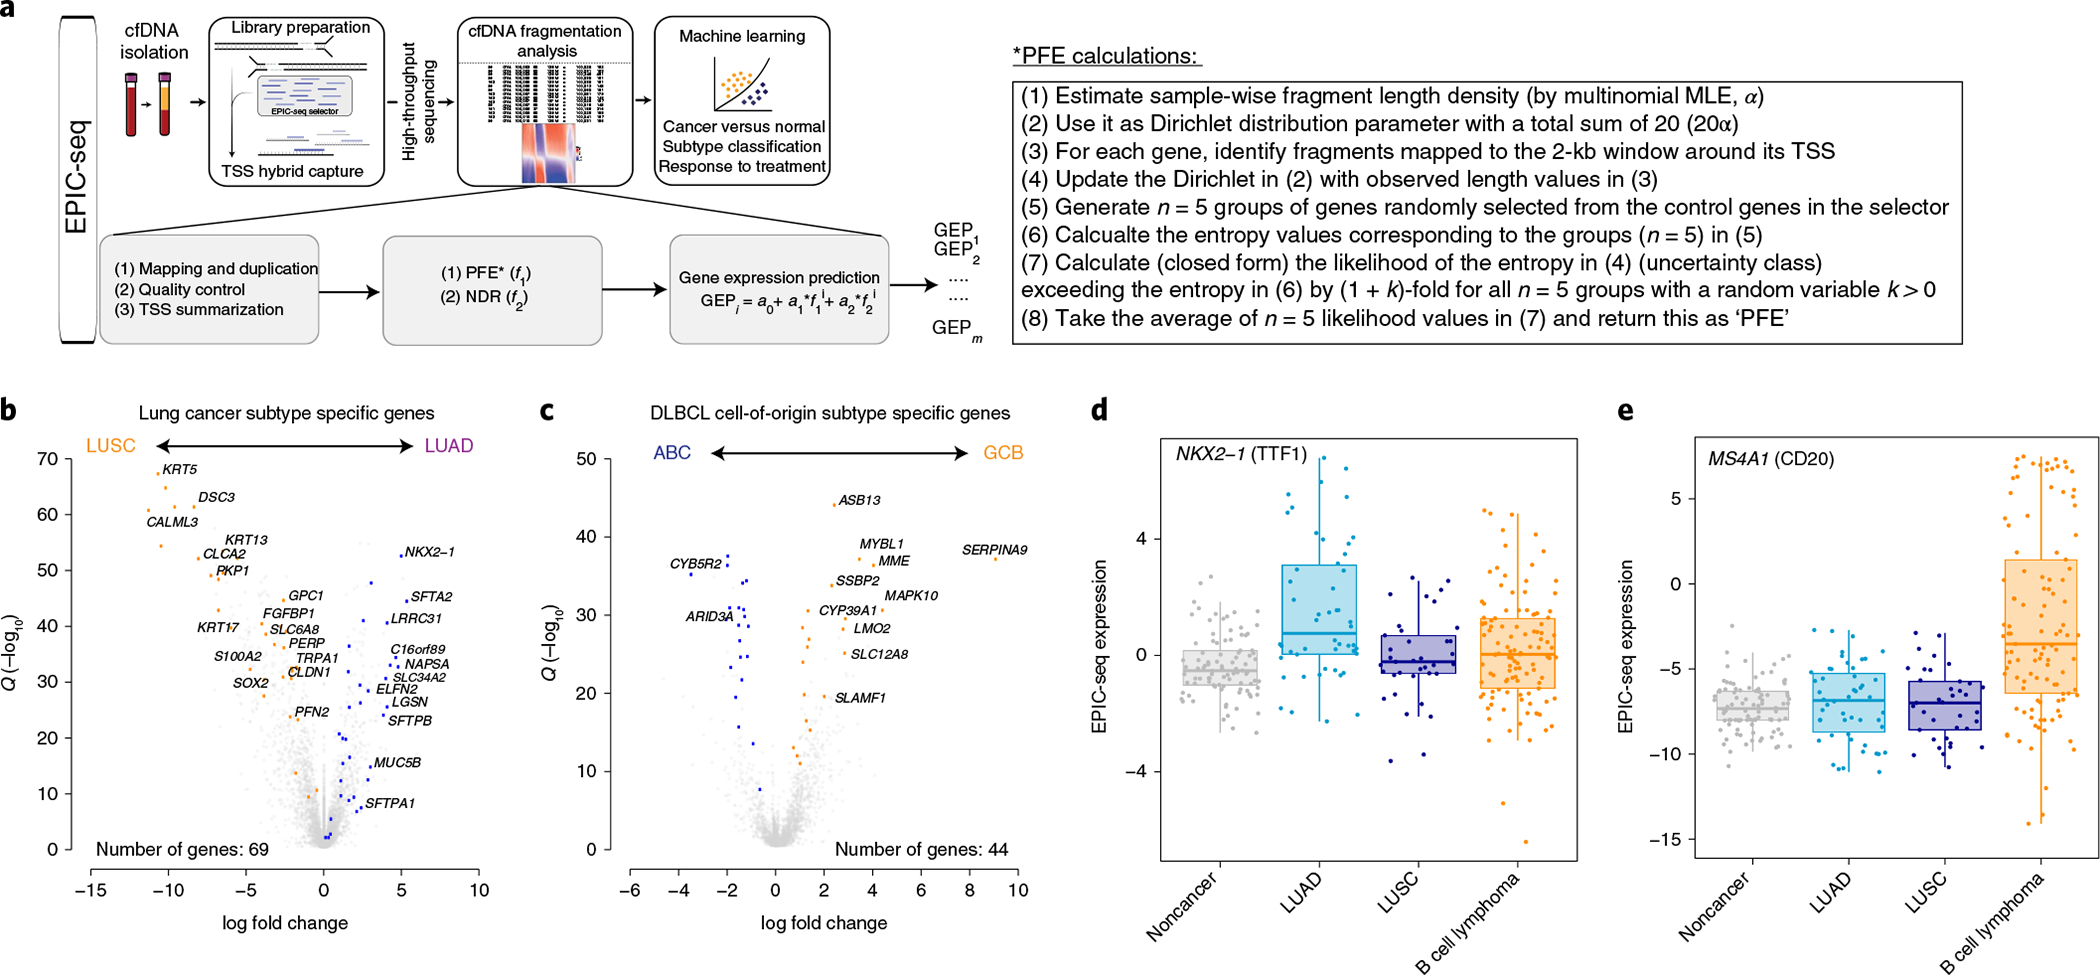
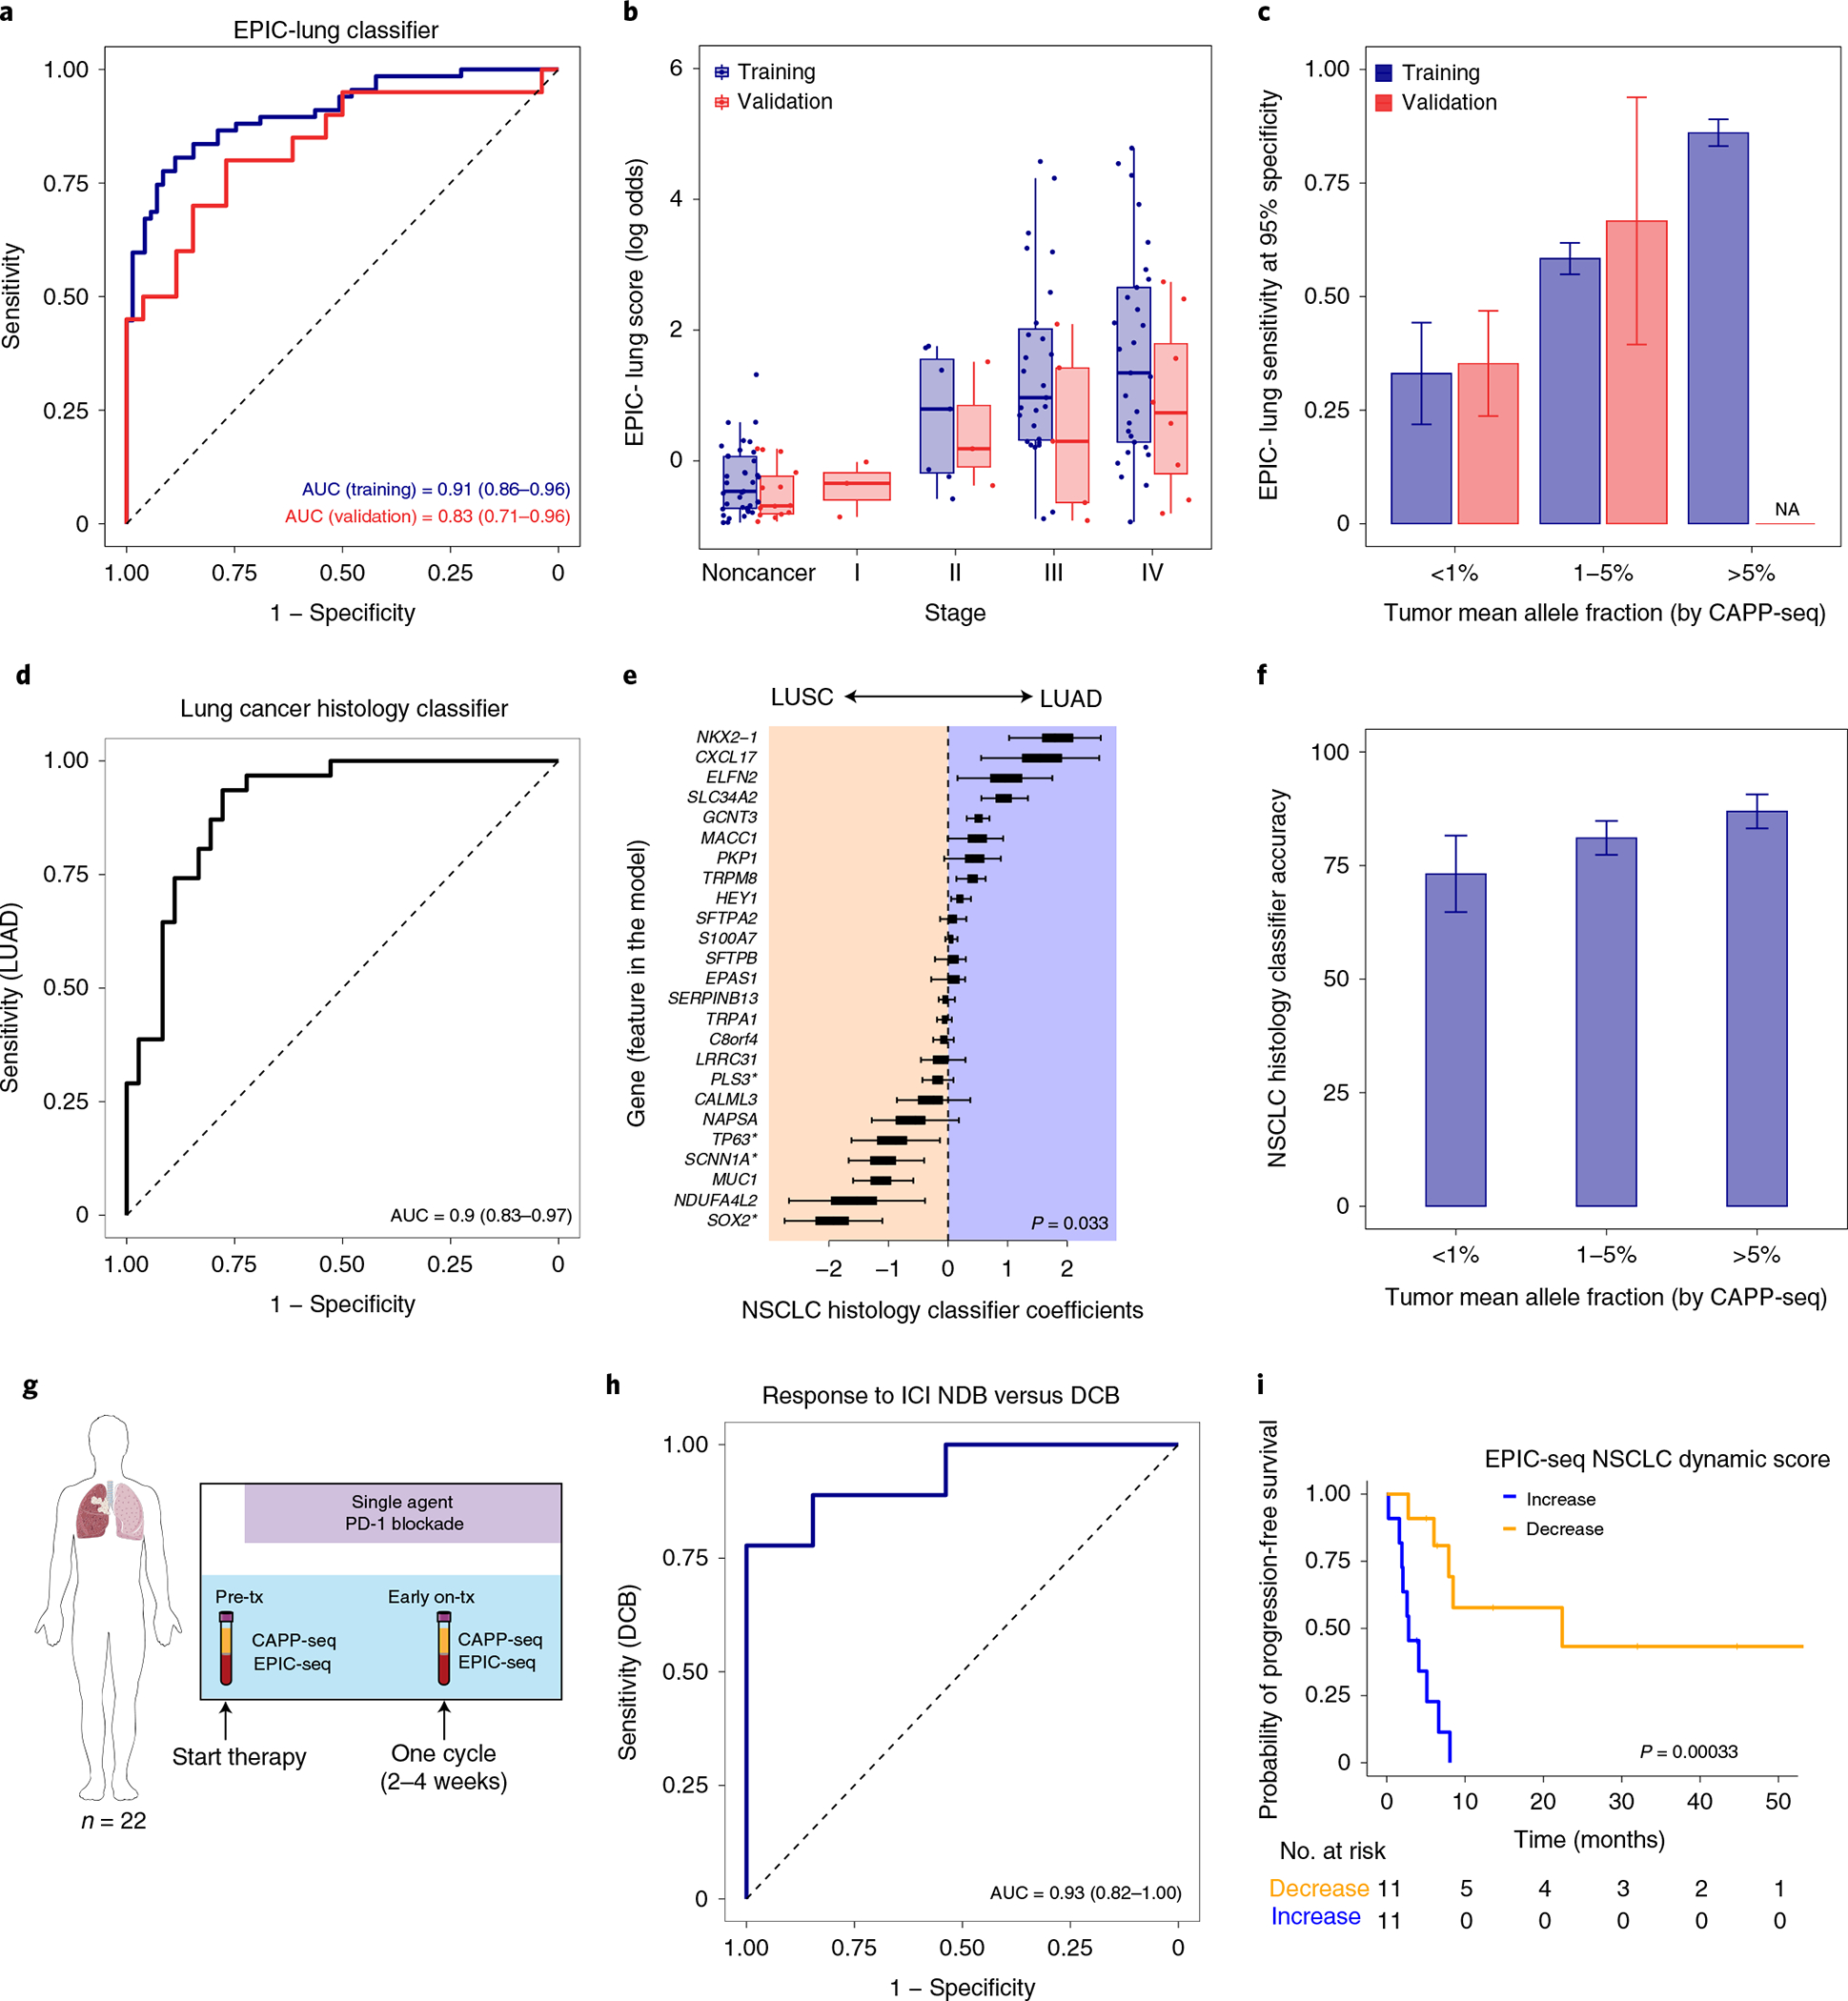
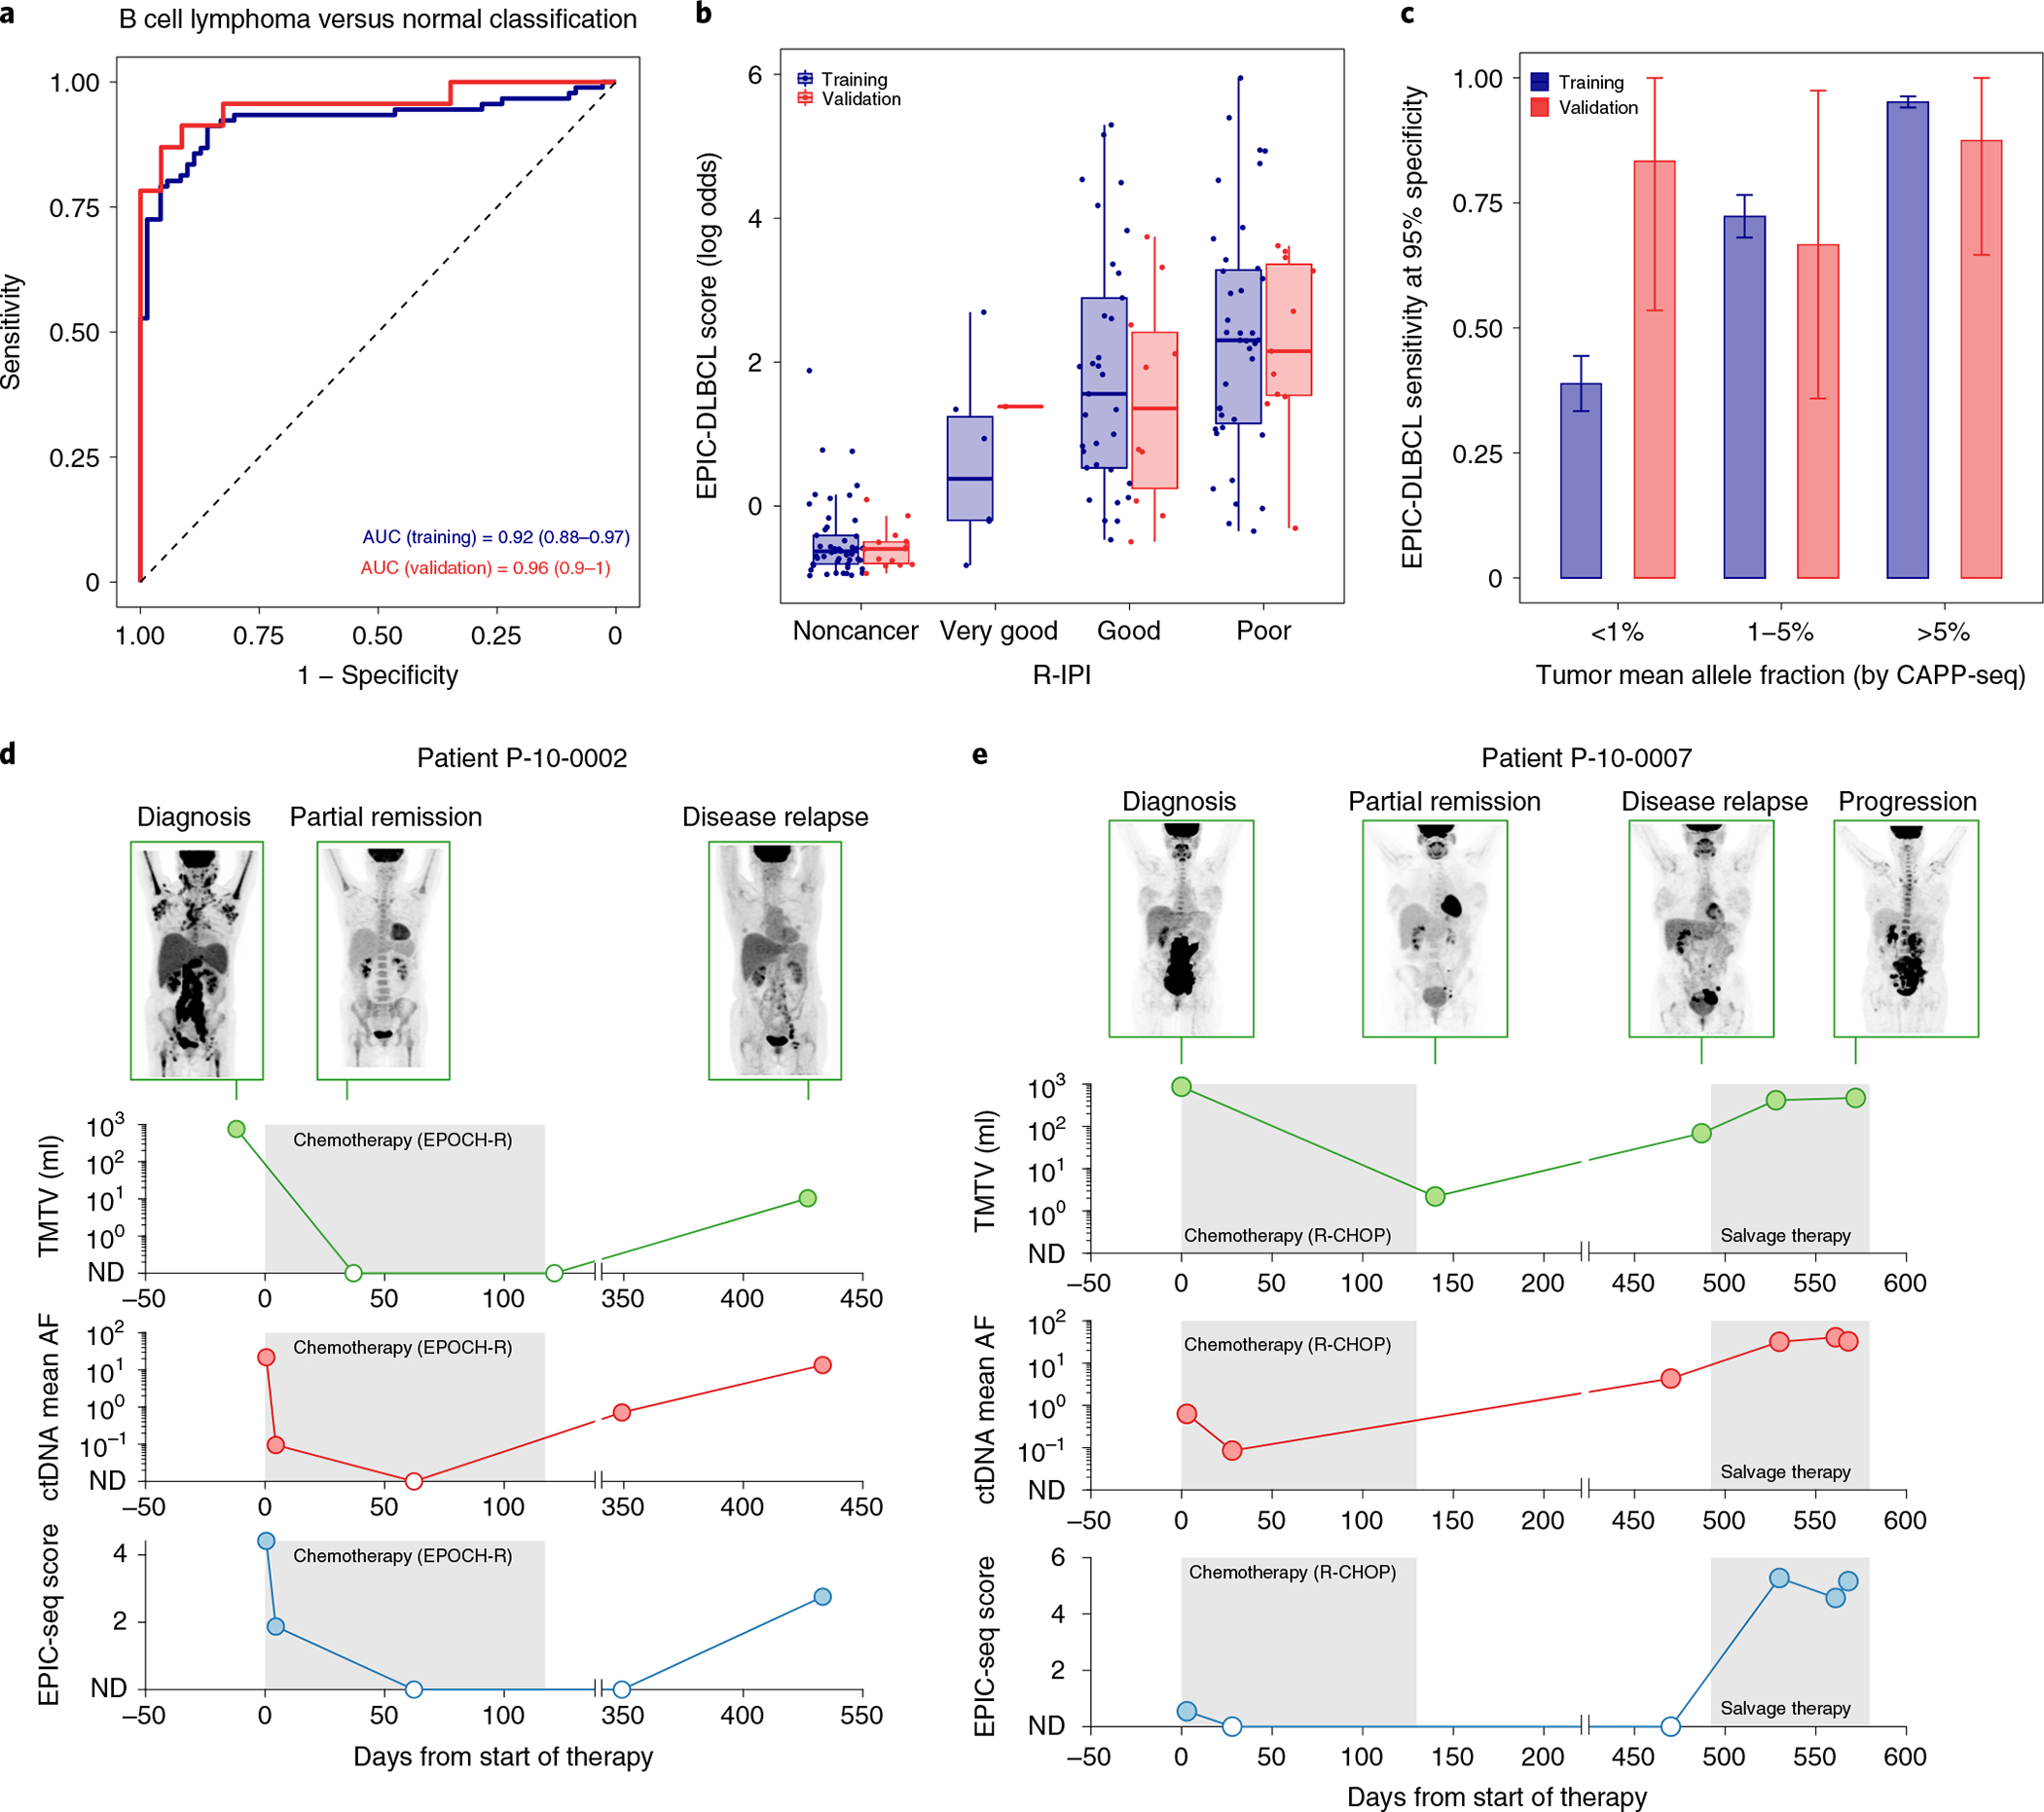
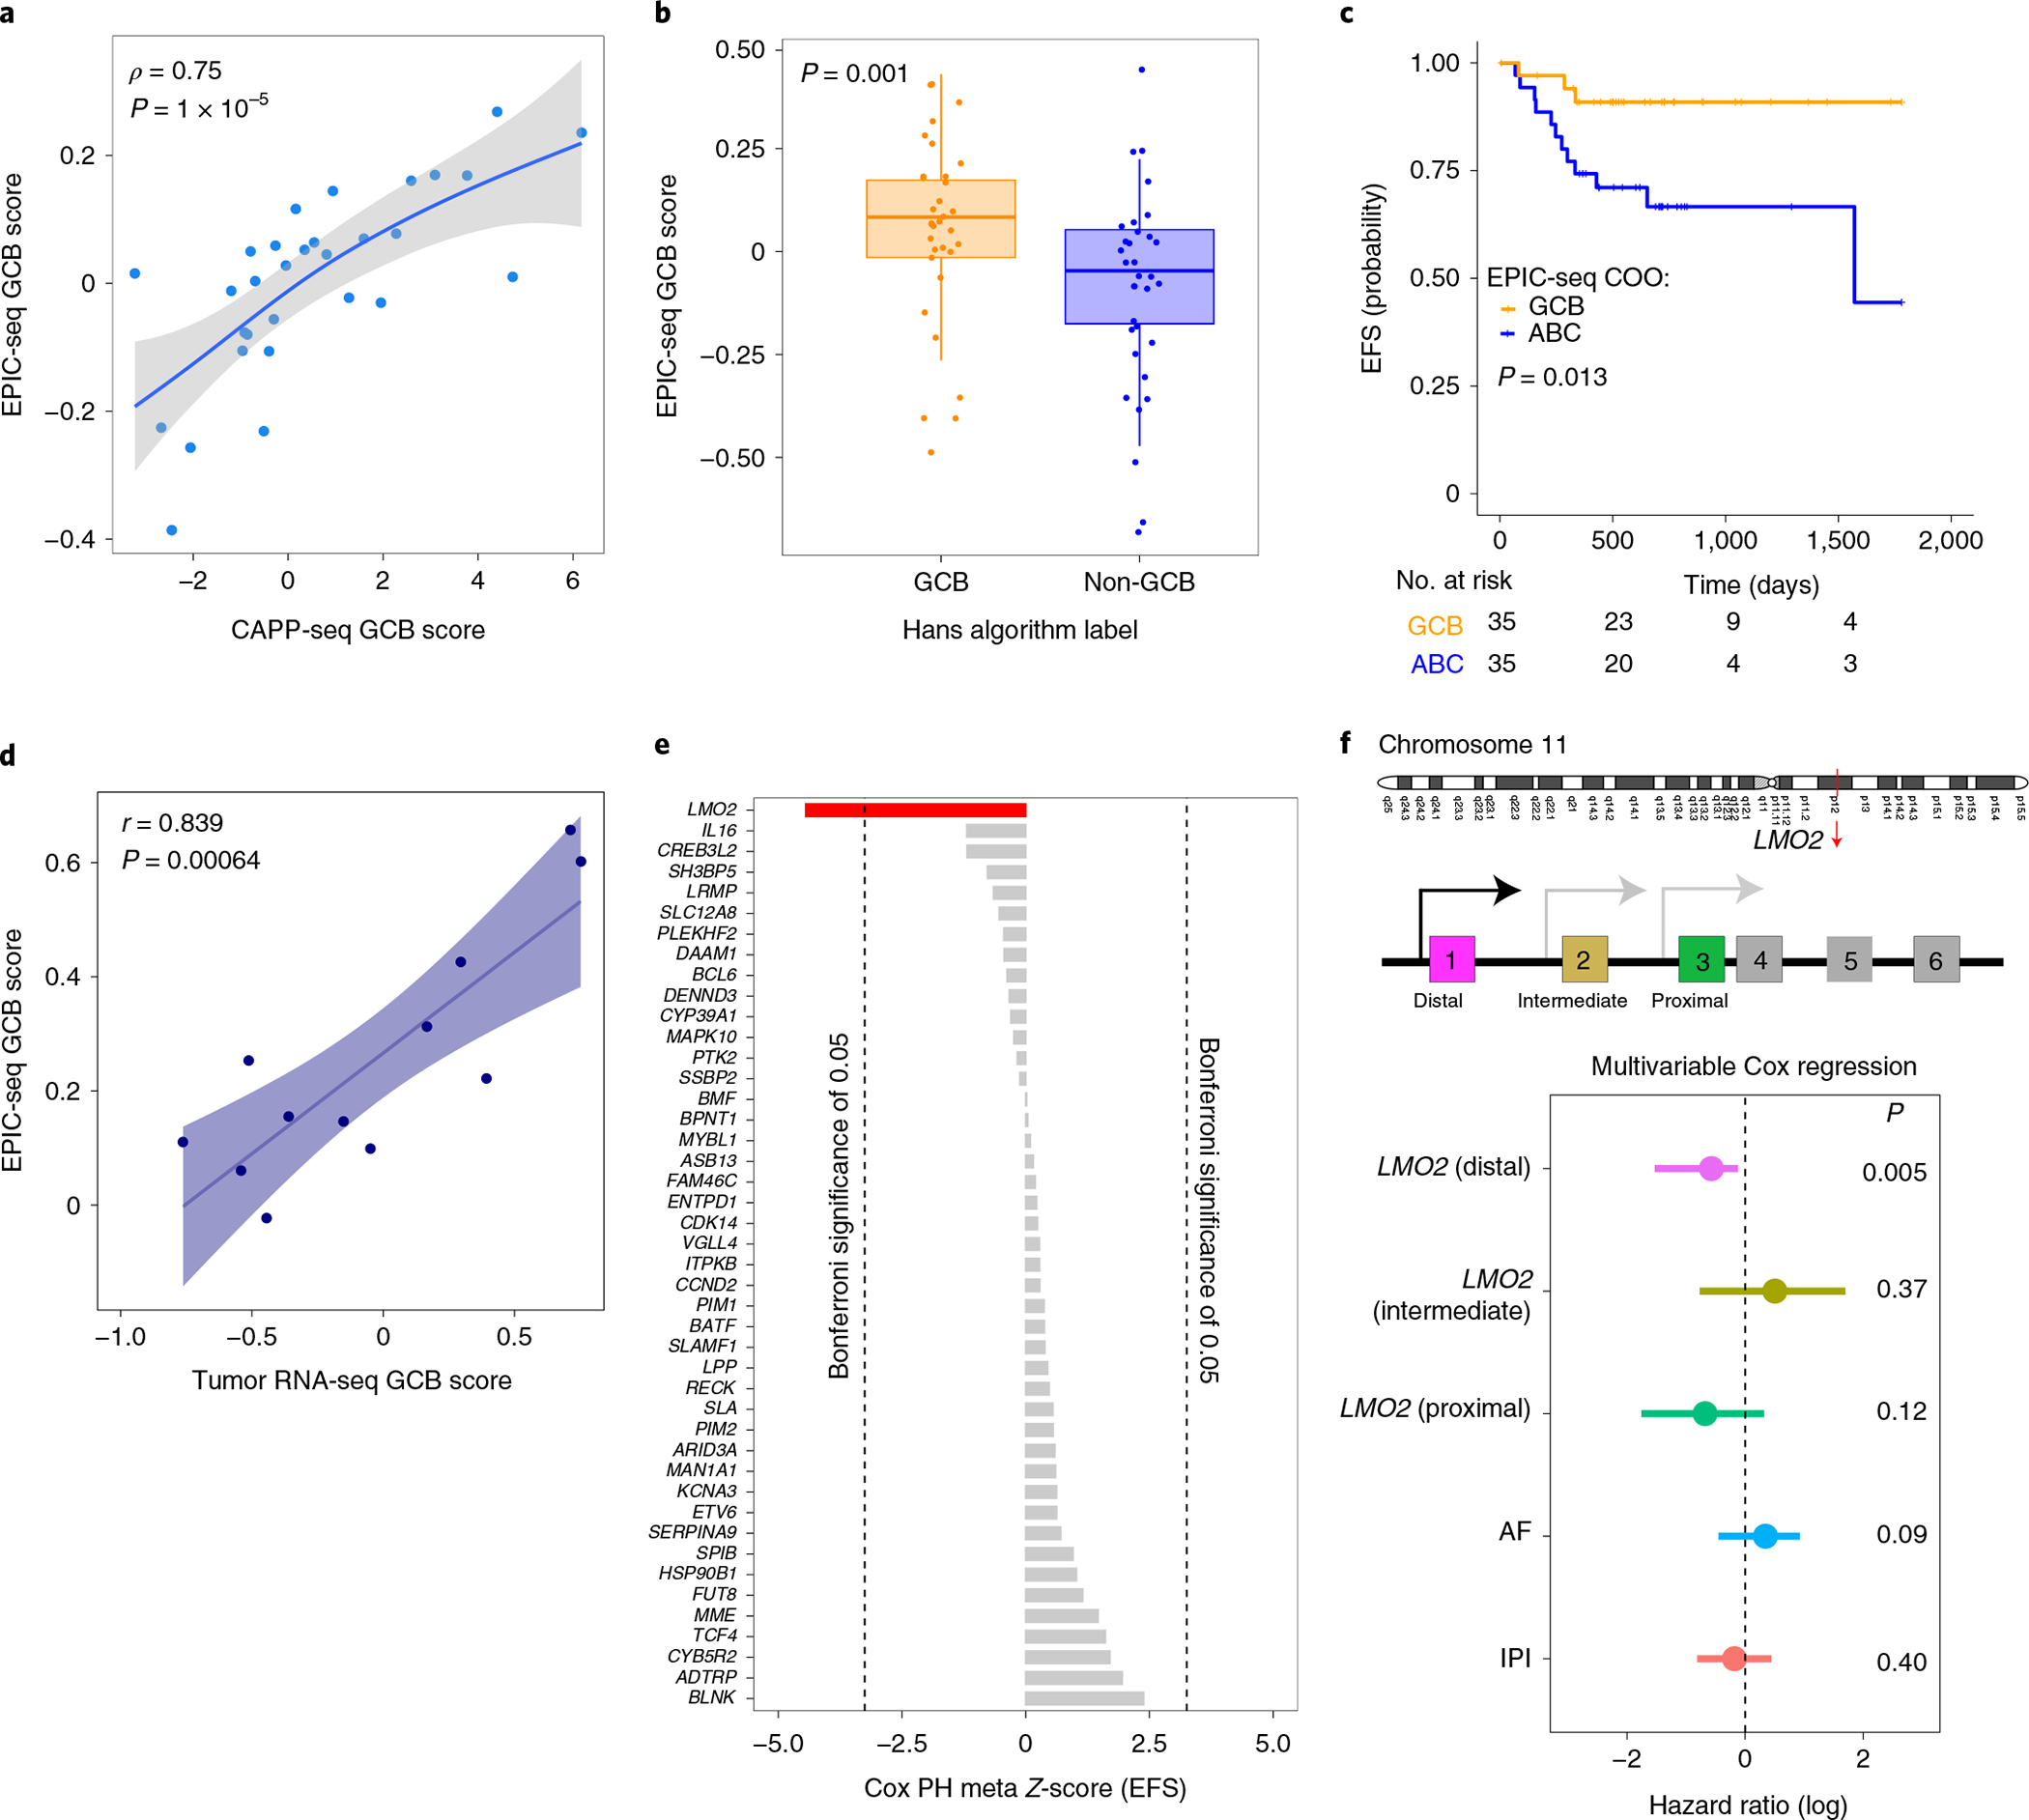
Profiling of circulating tumor DNA (ctDNA) in the bloodstream shows promise for noninvasive cancer detection. Chromatin fragmentation features have previously been explored to infer gene expression profiles from cell-free DNA (cfDNA), but current fragmentomic methods require high concentrations of tumor-derived DNA and provide limited resolution. Here we describe promoter fragmentation entropy as an epigenomic cfDNA feature that predicts RNA expression levels at individual genes. We developed 'epigenetic expression inference from cell-free DNA-sequencing' (EPIC-seq), a method that uses targeted sequencing of promoters of genes of interest. Profiling 329 blood samples from 201 patients with cancer and 87 healthy adults, we demonstrate classification of subtypes of lung carcinoma and diffuse large B cell lymphoma. Applying EPIC-seq to serial blood samples from patients treated with PD-(L)1 immune-checkpoint inhibitors, we show that gene expression profiles inferred by EPIC-seq are correlated with clinical response. Our results indicate that EPIC-seq could enable noninvasive, high-throughput tissue-of-origin characterization with diagnostic, prognostic and therapeutic potential.


Conflict of interest statement

Competing interests

A.A.A. reports research funding from Celgene, Pfizer, ownership interests in FortySeven, CiberMed, ForeSight and paid consultancy from Roche, Genentech, Janssen, Pharmacyclics, Gilead, Celgene and Chugai. M.D. reports research funding from Varian Medical Systems and Illumina, ownership interest in CiberMed, ForeSight and paid consultancy from Roche, AstraZeneca, Illumina, RefleXion and BioNTech. J.J.C. reports paid consultancy from Lexent Bio Inc. and ownership interests in ForeSight. A.M.N. has patent filings related to expression deconvolution and cancer biomarkers and has served as a consultant for Roche, Merck and CiberMed. D.M.K. reports paid consultancy from Roche. B.T.L. has served as an uncompensated advisor and consultant to Amgen, Genentech, Boehringer Ingelheim, Lilly, AstraZeneca and Daiichi Sankyo. B.T.L. reports receiving research grants to his institution from Amgen, Genentech, AstraZeneca, Daiichi Sankyo, Lilly, Illumina, GRAIL, Guardant Health, Hengrui Therapeutics, MORE Health and Bolt Biotherapeutics. B.T.L. has received academic travel support from MORE Health and Jiangsu Hengrui Medicine. B.T.L. reports to be inventor on two institutional patents at MSKCC (US62/685,057, US62/514,661) and has intellectual property rights as a book author at Karger Publishers and Shanghai Jiao Tong University Press. J.M.I. reports serving as an unpaid consultant to Amgen and Roche-Genentech, institutional research support from Guardant Health and GRAIL, and ownership interest in LumaCyte. A.A.A., M.D., M.S.E., D.M.K., J.J.C., and B.Y.N. report patent filings related to cancer biomarkers. M.S.E., M.M., A.A.A. and M.D. have patent filing related to this paper. B.Y.N. is currently an employee and holds stock from Roche/Genentech. The remaining authors declare no competing interests.

Figures

Extended Data Fig. 1 |
Extended Data Fig. 1 |. Fragment length density at the transcription start sites varies with gene expression.
Fragment length density at the transcription start sites varies with gene expression. (a) A heatmap of fragment length densities across 1,748 groups of genes (similar to Fig. 1a). Three regions R1 (100–150 bps), R2 (151–210 bps), and R3 (211–300 bps) show enrichment in either high or low expression gene groups. (b) The percent of fragments within each region defined in panel (a) in the deep whole-genome sample across deciles of the reference PBMC gene expression vector, that is, 10 groups of genes when sorted by their expression values in PBMC. Highly expressed genes include fewer monosome fragments, indicating a wider distribution and thereby a higher PFE. (c) Fraction of fragments within the three regions, R1-R3, for exons vs introns vs TSS sites for the top (and bottom) 2000 genes as ranked by expression. The fraction of monosomal fragments within TSS regions is substantially lower than within intronic and exonic regions (63.5% at TSS vs ~71% at non-TSS). Pearson’s Chi-Squared goodness-of-fit tests resulted in the following test statistics (TSS vs Exon: G = 62,133 [P < 2.2E-16]; TSS vs Intron: G = 84,110 [P < 2.2E-16]). (d) Fraction of fragments falling within each region (R1, R2, and R3) for mutant cfDNA fragments and their wildtype counterparts. Each dot represents one tuple (variant-patient) and the connecting lines indicate the paired mutant-wildtype status. These results show that the mutant cfDNA fragments are enriched for R1 and R3 while wildtype fragments are enriched in R2. (e) A contour plot capturing the relationship between expression level (depicted by heat) as a function of two cfDNA fragmentomic features used in the gene inference model: PFE and NDR. (f) ROC analysis of a ‘NSCLC Score’ for noninvasively distinguishing patients with NSCLC from healthy controls (AUC = 0.76). The genes comprising this score were first defined from external RNA-Seq profiling data of primary NSCLC tumor tissues and blood samples, allowing subsequent calculation of their corresponding PFE in cfDNA samples profiled by WGS for independent NSCLC cases and healthy controls. (g) A schematic for the analyses performed for Fig. 2d–h. (h) Sample-level ‘SCLC Score’ from deep whole exome analysis of cfDNA and associated diagnostic performance. As in the exercise for NSCLC depicted in panel f, the genes comprising this SCLC score were first defined from external RNA-Seq profiling data of primary SCLC tumor tissues and blood samples. The corresponding PFEs (as the difference between the overall PFE level of top and bottom gene signatures) were subsequently calculated in cfDNA samples we profiled by deep WES for independent SCLC cases and healthy controls. Using these scores, an AUC of 0.9 was achieved in distinguishing cases from controls. (i) The Venn diagram of SCLC high genes identified in cfDNA (whole exome profiling) and tumor biopsy (RNA-Seq transcriptome profiling), with significance of overlap assessed by hypergeometric test.
Extended Data Fig. 2 |
Extended Data Fig. 2 |. Ensemble model accurately predicts gene expression in validation samples.
Ensemble model accurately predicts gene expression in validation samples. (a) The scatterplot of the predicted vs a population-averaged gene expression across 1,748 groups of genes. The underlying data are from a merged cfDNA ‘meta-sample’ (pooled from merger of 27 healthy subjects profiled by relatively shallow WGS), achieving a correlation of 0.9 in initial validation. (b) The meta sample from panel (a) was used to assess model performance, when considering TSS-level expression values without gene grouping (n = 1), as well as scenarios with 2, 3, 5 and 10 genes per group. The Pearson correlation between observed expression in PBMC versus predicted expression from our model (combining PFE and NDR) is shown in green bars. This correlation substantially improves as number of genes per group increases. The Pearson correlation values between observed gene expression and those predicted by NDR or PFE expression are shown in blue and green bars, respectively. (c) Scatterplot depicts predicted versus observed gene expression measurements across 1,748 groups of genes (dots), when comparing expression measurements by RNA-Seq on matched PBMC (x-axis) against plasma cfDNA inferences (y-axis), for a validation sample from a healthy adult that we also profiled by deep WGS (~200x). This achieved a Pearson correlation of 0.86. (d) Similar to panel c, but for a second healthy adult control subject also profiled for validation, by deep WGS of cfDNA and matched RNA-Seq of PBMC (Pearson r = 0.91). (e-f) The same analysis as in panels (a-b) for a meta whole-genome sample generated from healthy subjects from Zviran et al. (g) The whole genome samples (depth ~20–40x) from Zviran et al. were used with every ten genes grouped and the concordance between model-predicted expression and PBMC expression are evaluated using Pearson correlation (that is, each dot is one subject). The non-cancer samples show a significantly higher correlation with normal PBMC than lung cancer cases (Wilcoxon P = 0.018). (h) The ichorCNA tumor fraction estimates of the lung cancer cases in panel f are used to compare with the correlations in panel f. As shown in a scatterplot, as tumor fraction increases, the correlation decreases (r = −0.69, P = 0.00052).
Extended Data Fig. 3 |
Extended Data Fig. 3 |. Case-level information of samples profiled by EPIC-Seq.
Cohorts and cell-free DNA samples profiled by EPIC-seq in this study, including Cancer Cases and Control Subjects. (a) Schema depicts the full set of specimens profiled by EPIC-Seq (n = 373), including those meeting Quality Control (QC) criteria (n = 352, 95%). A subset of samples were used for the initial gene expression model tuning (n = 2) and TSS filtering (n = 21). The remaining 329 samples were profiled by EPIC-Seq to address disease-specific questions, including utility for cancer detection, classification of histology and cell-of-origin, and response monitoring. These included 252 samples (76.6%) from 226 subjects that comprised our Discovery/Training cohort (large light purple rectangle), as well as subsequent profiling of a Validation Cohort of 77 samples (23.4%) from 69 subjects, after models were ‘locked down’ (large light green rectangle). A subset of 22 NSCLC patients where a pair of serial blood samples were monitored for ICI response (to allow comparisons of both EPIC-Seq and CAPP-Seq and assess biological plausibility), but this exercise was not subject to any model training. No samples were shared between Training and Validation exercises, with all models locked down before independent validations. Four healthy subjects (4.5%) provided more than one cfDNA specimen with one used for Training and the second for Validation. (b) Distribution of demographic, clinical, anatomic, and pathological variables for subjects profiled by EPIC-Seq. Tabulated are the relevant indices for cancer cases (235 blood samples 201 patients), including NSCLC patients (light blue; 109 blood samples from 87 patients), DLBCL patients (light orange; 126 blood samples from 104 patients), and non-cancer control subjects (gray; 94 blood samples from 87 adults).
Extended Data Fig. 4 |
Extended Data Fig. 4 |. Correlation between EPIC-lung score and clinical factors.
Concordance between EPIC-Seq measurements and established NSCLC risk factors including metabolic tumor burden, ctDNA level, and ctDNA response. (a) Concordance between EPIC-lung score and metabolic tumor volume (MTV), as measured by Spearman correlation (ρ = 0.67; P = 0.04). (b) Concordance between EPIC-lung score and the ctDNA mean allele fractions as measured by CAPP-Seq, evaluated using Spearman correlation (ρ = 0.5; P = 3E-5). (c) Relationships between genetic versus epigenetic molecular responses to Immune Checkpoint Inhibitor (ICI) therapy in advanced NSCLC. Scatterplot compares molecular responses measured noninvasively by CAPP-Seq (x-axis; fold change, Log10) and EPIC-Seq (lung dynamics score; y-axis) using serial plasma profiling before and after ICI therapy. The two orthogonal measures show moderate but significant correlation (r = 0.53, P = 0.012).
Extended Data Fig. 5 |
Extended Data Fig. 5 |. Correlation between EPIC-lymphoma score and clinical factors, results of the validation set and prognostic value of the LMO2 distal promoter.
Concordance between EPIC-Seq measurements and established DLBCL risk factors impacting outcome, including metabolic tumor volume, ctDNA level, and Cell-of-Origin. (a) The boxplots illustrate the two groups of patients stratified by their metabolic tumor volumes (>220 vs <220 mL; Wilcoxon P = 0.015). (b) Similar to panel a, but for the DLBCL Validation Cohort. (c) Concordance between EPIC-DLBCL scores and ctDNA mean allele fractions (from CAPP-Seq), evaluated using Spearman correlation (ρ = 0.66; P < 2E-16). (d) The EPIC-DLBCL model is applied to the cfDNA profiles of 13 samples from two DLBCL patients (DLBCL002 [ABC] and DLBCL007 [GCB]). The concordance between the resulting scores and the ctDNA mean allele fractions is evaluated by Spearman correlation (ρ = 0.79; P = 0.004). (e) Relationship between DLBCL cell-of-origin EPIC-Seq GCB scores and mutation-based GCB scores as measured by CAPP-Seq in the validation set (Spearman ρ = 0.64, P = 0.01). Each dot represents one sample (related to Fig. 6a). (f) Relationship between EPIC-Seq GCB scores from cfDNA and matched tumor tissue classification by routine Hans immunohistochemical algorithm in the validation set (Wilcoxon P = 0.001; related to Fig. 6b). (g) Relationship between EPIC-Seq GCB scores from cfDNA and tumor classification by RNA-seq of paired tumor tissue (Jonckheere’s trend test, P = 0.015). Box-and-whisker plots depict the EPIC-Seq GCB score in individual samples profiled by EPIC-Seq (dots), with boxes spanning the inter-quartile range; the median is horizontally marked with a line in each box, and whiskers span the 1.5 IQRs. (h) The Kaplan-Meier curves of EFS of the patients when labeled by the Hans algorithm. The non-GCB group contains both Non-GCB and Unknown. (i) The violin plot shows the distributions of Cox Proportional Hazard Model Z-scores when genes are grouped according to their effects on outcome (measured as EFS) in three prior tumor studies.
Extended Data Fig. 6 |
Extended Data Fig. 6 |. Pre-analytical factors and TSS GC-content correction effect on PFE.
Effect of preanalytical factors on fragment size entropy and effect of GC-content correction on expression model performance. (a) The concordance between PFE values for three healthy controls profiled by EPIC-Seq using paired Streck BCT and K2EDTA tubes. A Pearson correlation of 0.94 was observed between tube types. (b) Effect of time on the bench (that is, in days) on the PFEs in a cohort of plasma cfDNA samples. (c) Effect of additional PCR cycles on PFE. Here we profiled 4 healthy control cfDNA samples by the CAPP-Seq lung cancer selector when 3 additional PCR cycles were included to study their effect. A Pearson correlation of 0.95 was observed between standard conditions versus those incorporating additional PCR cycles. (d) Effect of correction for GC-content of TSS regions on gene expression model accuracy. Four scenarios were studied when correcting features using the GC values for NDR and PFE: PFE alone corrected, NDR alone corrected, both corrected, and neither corrected. The correction was performed using a LOESS function with a span of 0.5. Two healthy control cfDNA samples were profiled by deep whole genome sequencing. For these two subjects, we also profiled the matched PBMC by RNA-Sequencing. We then compared the predicted values from cfDNA against observed values from RNA-Seq for each of the different GC-correction scenarios and tested concordance. The concordance was evaluated using three metrics: Pearson correlation, Spearman correlation, and root-mean-square error (RMSE). When considering both cfDNA samples, none of the four GC-correction approaches seemed to consistently improve correlations or reduce associated error profiles. (e) Whole exome profiling of small-cell lung cancer samples in Fig. 2 are used to investigate association between PFEs and copy number aberrations. We first determined genes with PFE significantly higher in SCLC cfDNA samples (n = 11) compared with healthy control cfDNA samples (n = 28) (‘High’ PFE). Similarly, we determined genes with significantly lower PFEs in SCLC cfDNA samples (‘Low’ PFE). Then, the copy number states (CNS) corresponding to all genes were identified by overlapping copy number profiles from CNVkit with the genomic coordinates of the first exons. The CNS values were then dichotomized into (i) amplification vs no-amplification and (ii) deletion vs no-deletion. Next, we summarized these by contingency tables for (i) vs PFE levels (top table) and (ii) vs PFE levels (bottom table). Finally, the association between the two was examined via Fisher’s exact test, which showed insignificant associations in both tests (P = 0.97 and P = 0.17; for amplifications and deletions, respectively).
Extended Data Fig. 7 |
Mechanistic model and gene detection sensitivity with various parameters. (a) The cartoon shows four scenarios considered in our simulations: (i) protected, meaning that nucleosomes are well-positioned and are all present, (ii) one nucleosome-free position is present, (iii) two nucleosome-free positions are present and (iv) three nucleosome-free positions are present. (b) The density plots show the results of generating fragment lengths via the model described in panel a. Three panels correspond to scenarios (ii-iv) vs (i) in a. (c) A varying mixture parameters is considered and its effect on the entropy for three different coverages: 500x, 2500x and 5000x. (d) A summary of panel c for active gene detection sensitivity while achieving a specificity of 85%. The error bars are from the sensitivities calculated using the ‘ci.se’ function in R pROC package. The colors correspond to three different coverages in panel c.
Fig. 1 |
Fig. 1 |. Correlation of gene expression and cfDNA molecular features.
a, Chromatin accessibility footprints can be traced back to the tissue-of-origin. Open chromatin is subject to nuclease digestion resulting in decreased sequencing coverage depth, measured by NDR, and fragment length diversity, measured by PFE. In this cartoon, lung epithelial cells exhibit very low expression of MS4A1 (CD20) but high expression of NKX2-1 (TTF1). The cfDNA fragments of a patient with lung cancer consist of normal primarily hematopoietic cfDNA fragments mixed with fragments derived from LUAD cells undergoing apoptosis. Because the lung epithelial cell compartment has a lower NDR and higher PFE for NKX2-1 fragments, the resulting mixture shows similar changes with the net effect dependent on the total amount of circulating tumor-derived fragments. B cells, on the other hand, highly express MS4A1 with a very low expression level of NKX2-1. Accordingly, the cfDNA fragments of a patient with B cell lymphoma consist of normal cfDNA fragments admixed with B cell-derived ctDNA with overrepresentation of MS4A1 resulting in lower coverage and higher diversity of cfDNA fragment length values at the TSS. b, Heatmap depicting cfDNA fragment size densities at TSSs across the genome in an exemplar plasma sample profiled by high-depth WGS (roughly 250×). The x axis depicts cfDNA fragment size, while the rows of the heatmap capture fragment density as ordered by gene expression profile (GEP) in blood leukocytes assessed by RNA-seq using TPM (right). Each row corresponds to one meta-gene encompassing the TSSs of ten genes when ranked by a reference PBMC expression vector. The data are normalized column-wise for each cfDNA fragment size bin. Corresponding PFE, NDR and TPM levels are depicted for each bin in dot plots on the right. c, A scatterplot depicts the relationship between plasma cfDNA PFE versus leukocyte RNA expression levels (TPM), as in b. Both Pearson (r) and Spearman (ρ) correlation coefficients are reported. In both, P < 2.2 × 10⁻¹⁶. d, Pearson correlations between individual cfDNA fragment features and leukocyte gene expression levels. The error bars depict the 95% CIs resulted from 500 bootstrap replicates (resampling with replacement of gene groups). This analysis is performed by using the deep WGS profile used in b and c. e, The correlation between leukocyte gene expression and each of two leading cfDNA features as a function of distance to the TSS center. The dotted lines correspond to the concordance measure when evaluated on the shorn leukocyte DNA from a matched blood PBMC sample. f, Relationship between PFE of a NSCLC signature and cfDNA sample status and across stages. The PFE monotonically increases from noncancer to later stages patients with NSCLC (Jonckheere’s trend test P = 0.0005). g, Relationship between PFE of a gene set with low expression in NSCLC (and high in PBMC) and cfDNA sample status and across stages. The PFE of this set is not associated with disease status or disease stage (Jonckheere’s trend test P = 0.54). In box-and-whisker plots in f and g, the median is horizontally marked with a line in each box and whiskers span the 1.5 IQRs in each patient cohort. h, Effect of sequencing depth (x axis) on the correlation of cfDNA PFE and NDR with gene expression (y axis). For each down-sampled depth, three replicates were generated, and the shaded area illustrates three standard deviations above and below the mean.
Fig. 2 |
Fig. 2 |. Fragment size entropy in relation to gene structure informs expression inferences from whole-exome cfDNA profiling.
a, Heatmap depicting the mean normalized Shannon entropy of cfDNA fragment size distributions for 18,131 individual protein-coding genes when sorted by their expression in blood PBMC leukocytes, across a 20-kb region flanking each TSS. The heat illustrates the normalized entropy (normalization to the average entropy over the start to end of this 20-kb region). The underlying data are the deep whole-genome cfDNA profile from Fig. 1b. b, A summary representation of the heatmap in a. Each column reflects a window position across the TSS and is summarized by a histogram depicting the deviation of Shannon from the window centered at the TSS (position 0). c, Concordance analysis using a Pearson correlation between individual gene expression and PFEs when calculated in TSS, exon 1, intron 1 and so on. Each dot corresponds to one cfDNA sample profiled deeply by WGS (n = 3, Methods). d, Genes known to be highly expressed in SCLC tumors by RNA-seq (n = 118 genes from 81 tumors) exhibit significantly higher PFE in cfDNA samples from patients with SCLC (n = 11, pink dots) than healthy adult control participants (n = 28, brown dots; P = 3.94 × 10⁻⁵), as profiled by deep (roughly 2,000×) WES (Methods and Supplementary Fig. 1g). e, As in d, but showing significantly lower average PFE in cfDNA of patients with SCLC, when considering 20 genes known to be lowly expressed in SCLC tumors but highly expressed in PBMCs by RNA-seq (P = 0.02). f, DEGs associated with SCLC, identified directly from cfDNA using PFE analysis. Volcano plot depicts genes inferred to be more highly expressed in 11 cfDNA samples from SCLC cases (pink dots, n = 620), or in 28 cfDNA samples from healthy adult control participants (brown dots, n = 596). DEGs were determined by considering the magnitude of mean PFE difference between groups (x axis; |0.1|) and the false discovery rate (Q < 0.05) from t-tests between groups. These two sets of genes discovered noninvasively from cfDNA as differentially expressed in SCLC, were then assessed for expression in primary SCLC tumors in g and h. The box-and-whisker plots depict the median and IQR of the mean RNA expression levels (y axis, TPM) observed for the SCLC high (g) and SCLC low (h) gene sets, when comparing RNA-seq in SCLC tumors (n = 81, pink dots) versus healthy PBMCs (n = 13, brown dots). In all the box-and-whisker plots, the median is horizontally marked with a line in each box, and whiskers span the 1.5 IQRs in each patient cohort.
Fig. 3 |
Fig. 3 |. EPIC-seq design and workflow.
a, The schema depicts the general workflow of EPIC-seq, starting with cfDNA extraction from plasma, library preparation and capture of TSS of genes of interest, high-throughput sequencing of enriched regions and, finally, cfDNA fragmentation analysis followed by machine learning models for prediction of expression at each TSS and classification of the specimen. b,c, The volcano plots depict DEGs, as informative for histological classification in NSCLC subtypes (b) (LUAD versus LUSC from TCGA,) and in COO classification of DLBCL (c) (ABC versus GCB from Schmitz et al.). Genes highlighted in colors other than gray were selected for TSS capture in EPIC-seq, after censoring genes with high expression in blood leukocytes (Methods). d, NKX2-1, encoding TTF1, known to be highly expressed in NSCLC-LUAD tumors, exhibits significantly higher predicted expression in cfDNA of patients with LUAD by EPIC-seq (LUAD versus others Wilcoxon test P = 5.7 × 10⁻⁶). e, MS4A1, encoding CD20, known to be a marker of DLBCL tumors, exhibits significantly higher predicted expression in cfDNA of patients with DLBCL by EPIC-seq (DLBCL versus others Wilcoxon test P = 5.44 × 10⁻⁹). Box-and-whisker plots depict predicted expression levels in individual samples profiled by EPIC-seq (dots), with boxes spanning the IQR; the median is horizontally marked with a line in each box, and whiskers span the 1.5 IQRs in each patient cohort. In d and e, individual patients are shown as dots (noncancer, n = 91; LUAD, n = 50; LUSC, n = 37; B cell lymphoma, n = 114).
Fig. 4 |
Fig. 4 |. Application of EPIC-seq for lung cancer detection and histological classification.
a, ROC capturing performance of the EPIC-lung classifier for distinguishing lung cancers from others in leave-one-batch-out analyses (AUC = 0.91). The 95% CI of the AUC is calculated using 2,000 bootstrap replicates. b, Relationship between EPIC-lung scores and NSCLC disease stage, measured by Jonckheere’s trend test (P = 0.08). Box-and-whisker plots depict the EPIC-lung classifier score in individual samples profiled by EPIC-seq (dots), with boxes spanning the IQR; the median is horizontally marked with a line in each box, and whiskers span the 1.5 IQRs in each disease stage group. Sample sizes are as follows: noncancer (n = 71 training; n = 23 validation), stage I (n = 0 training; n = 3 validation), stage II (n = 7 training; n = 4 validation), stage III (n = 30 training; n = 5 validation) and stage IV (n = 30 training, n = 8 validation). c, Sensitivity analysis of the EPIC-lung classifier at 95% specificity. Patients are grouped based on bins of mean circulating tumor AF (<1% (n = 8 training; n = 17 validation), 1–5% (n = 25 training; n = 3 validation) and >5% (n = 34 training)), estimated by CAPP-seq on the same samples. Sensitivity improves as ctDNA AF increases with roughly 33% of patients detectable when AF < 1%. The error bars for the training set depict the 95% CI of the sensitivity values resulted from 500 bootstrap replicates. The error bars for the validation set depict the sensitivity in the set ±s.e.m. taking sample size into account. d, ROC curve of the LUAD versus LUSC classifier when tested in a leave-one-out framework (AUC = 0.90, 95% CI (0.83–0.97)). e, Coefficients of the NSCLC histology classifier, with positive and negative coefficients favoring LUAD and LUSC, respectively. The coefficients are significantly associated with previous knowledge when comparing their magnitude and polarity by t-test (P = 0.033). Box-and-whisker plots are defined as in b and are resulted from 67 coefficient sets from classifiers trained in the leave-one-out cross-validation step. f, Accuracy of the histology classifier as a function of tumor ctDNA fraction as measured by CAPP-seq. The error bars are defined as in a. g, Application of EPIC-seq in predicting response to ICI within 4 weeks of treatment initiation. h, ROC curve of the EPIC-seq lung dynamics score calculated in g distinguishes patients with DCB versus those with NDB within 6 months (AUC = 0.93, 95% CI (0.78–1.00)). i, Prognostic value of EPIC-seq lung dynamics scores in Kaplan–Meier analysis of progression-free survival in the patients treated with immune-checkpoint inhibitors (log-rank P = 0.0003; hazard ratio 11.86). Patients are stratified by the median dynamics score.
Fig. 5 |
Fig. 5 |. Application of EPIC-seq for DLBCL detection.
a, ROC analyses capture performance of the EPIC-DLBCL classifier for distinguishing lymphomas from others. Red and blue curves depict performance in the validation cohort (AUC = 0.96), versus leave-one-batch-out cross-validation analyses of the training cohort (AUC = 0.92), respectively. b, Relationship between EPIC-seq DLBCL classifier scores and clinical prognostic scores as measured by the R-IPI (Jonckheere’s trend test P = 4 × 10⁻⁴). Box-and-whisker plots depict the EPIC-DLBCL score in individual samples profiled by EPIC-seq (dots), with boxes spanning the IQR; the median is horizontally marked with a line in each box and whiskers span the 1.5 IQRs. Sample sizes are as follows: noncancer (n = 71 training; n = 23 validation); ‘very good’ (n = 7 training; n = 1 validation); ‘good’ (n = 38 training; n = 11 validation) and ‘poor’ (n = 46 training; n = 11 validation). c, Sensitivity analysis at 95% specificity for EPIC-DLBCL classifier. Similar to the EPIC-lung cancer classifier, sensitivity significantly improves as a function of ctDNA level (<1% (n = 16 training; n = 6 validation), 1–5% (n = 34 training; n = 9 validation) and >5% (n = 41 training; n = 8 validation). The error bars in the training set depict the 95% CI of the sensitivity values resulted from 500 bootstrap replicates. The error bars for the validation set depict the sensitivity in the set ±s.e.m. taking the sample size into account. d,e, Change of ctDNA disease burden in response to treatment and during clinical progression in two patients with DLBCL with GCB (d) and ABC (e) COO. Shown is the radiographic response as measured by PET/CT MTV (first row y axis), ctDNA mean AF measured by CAPP-seq (second row y axis) and the EPIC-seq lymphoma score (third row y axis) over serial, pre- and post-therapy time points (x axis).
Fig. 6 |
Fig. 6 |. Application of EPIC-seq for DLBCL Coo classification.
a, Relationship between DLBCL COO EPIC-seq GCB scores and mutation-based GCB scores as measured by CAPP-seq (Spearman ρ = 0.75, P = 1 × 10⁻⁵). Data were smoothed by three patient (nonoverlapping) bins after sorting by CAPP-seq scores before correlation analysis, and therefore there are 30 dots in the scatterplot. The grey region depicts the 95% CI around the smoothed line shown in blue. b, Relationship between EPIC-seq GCB scores from cfDNA and tumor tissue clinical classification by Hans immunohistochemical algorithm (GCB n = 33, non-GCB n = 33, Wilcoxon P = 0.001). Box-and-whisker plots depict the EPIC-seq GCB score in individual samples profiled by EPIC-seq (dots), with boxes spanning the IQR; the median is horizontally marked with a line in each box and whiskers span the 1.5 IQRs. c, Prognostic value of EPIC-seq COO scores in Kaplan–Meier analysis of EFS in DLBCL (log-rank P = 0.013). Patients are stratified by the median EPIC-COO score, with higher scores associated with GCB and lower levels with ABC subtype. d, Concordance analysis between EPIC-seq COO score and RNA-based scores (from matched tumor biopsy) for a cohort of 12 patients with DLBCL. Each dot represents one patient, with the x axis showing the GCB score from RNA-seq and y axis showing the EPIC-seq GCB score. The two scores exhibit reasonably strong correlation (r = 0.84, P = 0.0006). e, Prognostic value of individual genes profiled by EPIC-seq and EFS, as measured by Z-scores from univariate Cox proportional hazard models. For genes with multiple TSS regions, Z-scores were combined using Stouffer’s method. After correcting for multiple hypothesis testing, only LMO2 (red) remains significantly associated with favorable DLBCL outcome. Dotted lines represent the significance threshold for Bonferroni-corrected P values of 0.05. f, Forest plot depicts multivariable Cox proportional hazard model results for EFS. After adjusting for IPI and ctDNA AF, only the distal TSS for LMO2 remains significantly prognostic for EFS (P = 0.005).

Comment in

References

    1. Jahr S et al. DNA fragments in the blood plasma of cancer patients: quantitations and evidence for their origin from apoptotic and necrotic cells. Cancer Res. 61, 1659–1665 (2001). - PubMed
    1. Lo YM et al. Maternal plasma DNA sequencing reveals the genome-wide genetic and mutational profile of the fetus. Sci. Transl. Med. 2, 61ra91 (2010). - PubMed
    1. Heitzer E, Auinger L & Speicher MR Cell-free DNA and apoptosis: how dead cells inform about the living. Trends Mol. Med. 26, 519–528 (2020). - PubMed
    1. Newman AM et al. An ultrasensitive method for quantitating circulating tumor DNA with broad patient coverage. Nat. Med. 20, 548–554 (2014). - PMC - PubMed
    1. Phallen J et al. Direct detection of early-stage cancers using circulating tumor DNA. Sci. Transl. Med. 9, eaan2415 (2017). - PMC - PubMed

Publication types

LinkOut - more resources