. 2022 Apr 1;10(4):498-511.
doi: 10.1158/2326-6066.CIR-21-0853.

Overcoming CAR-Mediated CD19 Downmodulation and Leukemia Relapse with T Lymphocytes Secreting Anti-CD19 T-cell Engagers

Affiliations

Overcoming CAR-Mediated CD19 Downmodulation and Leukemia Relapse with T Lymphocytes Secreting Anti-CD19 T-cell Engagers

Belén Blanco et al. Cancer Immunol Res. .

Abstract

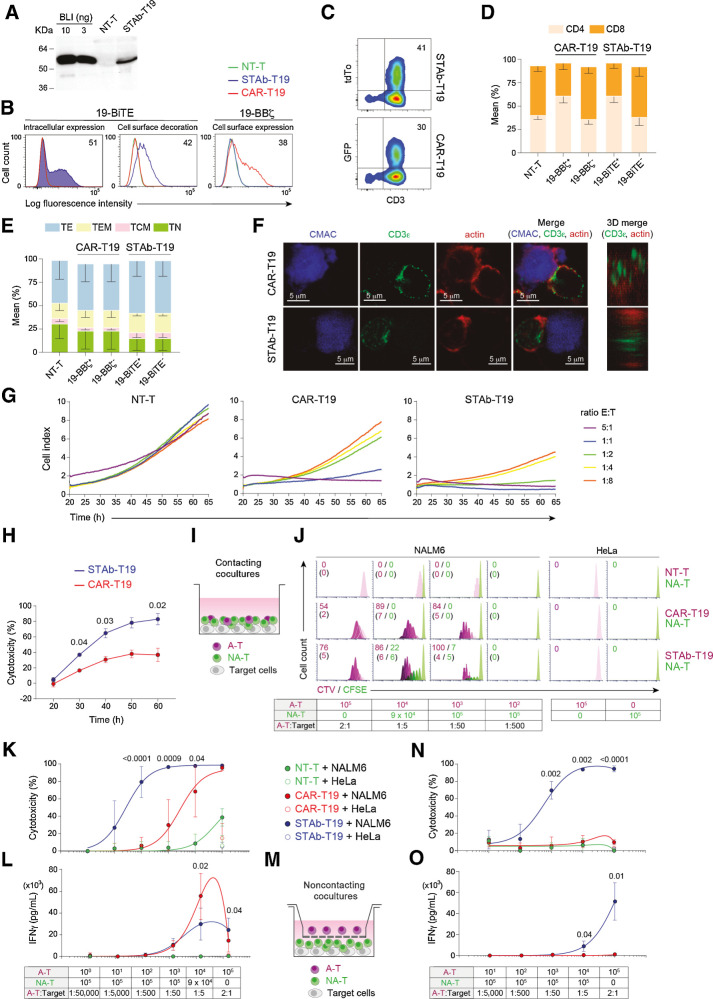
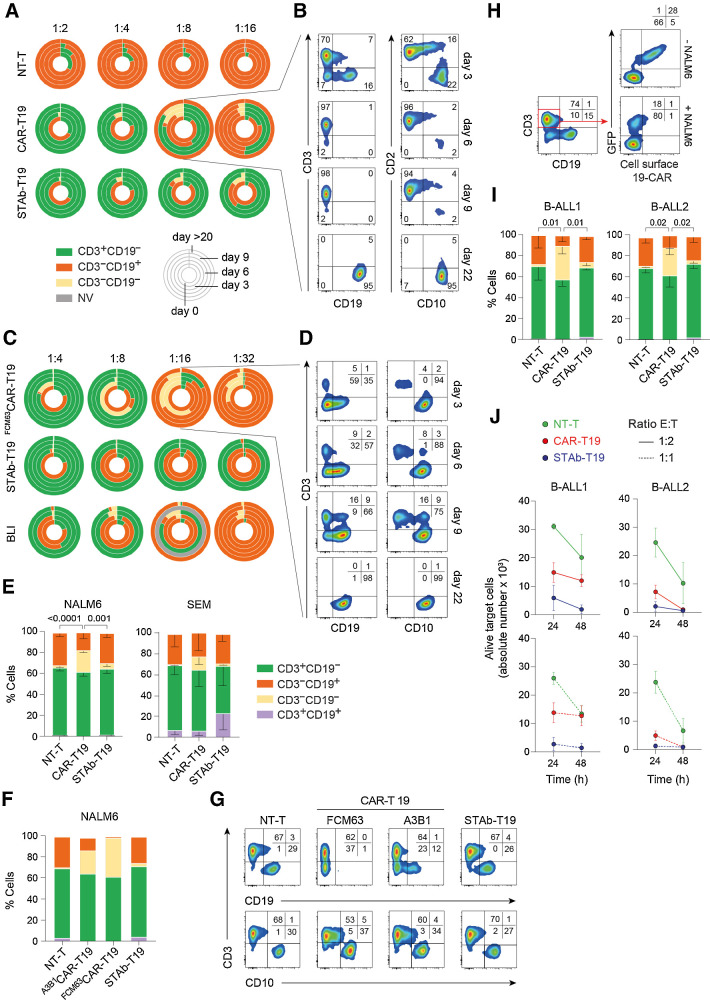
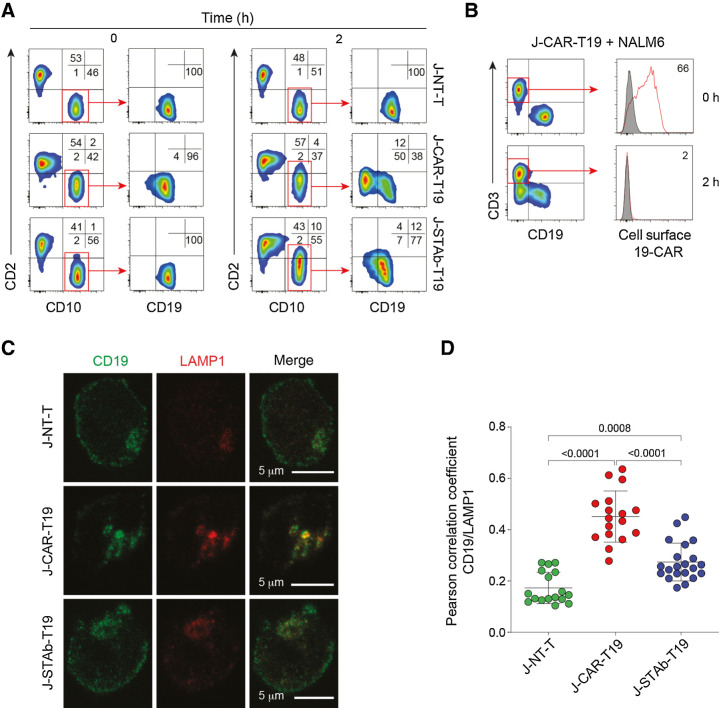
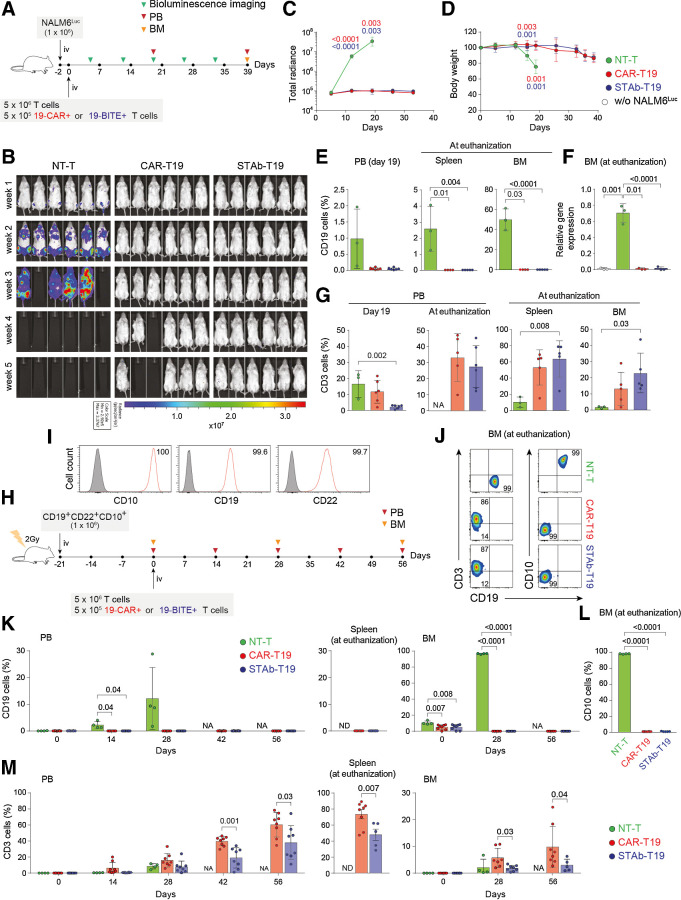
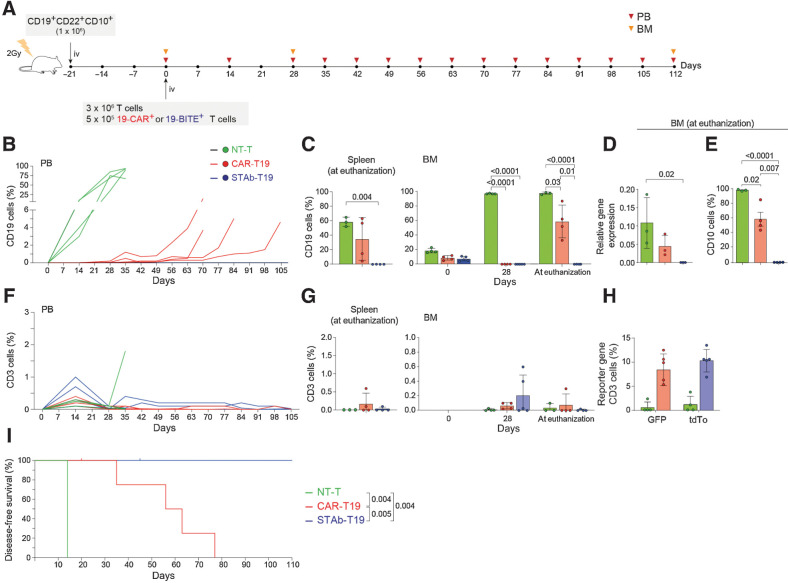
Chimeric antigen receptor (CAR)-modified T cells have revolutionized the treatment of CD19-positive hematologic malignancies. Although anti-CD19 CAR-engineered autologous T cells can induce remission in patients with B-cell acute lymphoblastic leukemia, a large subset relapse, most of them with CD19-positive disease. Therefore, new therapeutic strategies are clearly needed. Here, we report a comprehensive study comparing engineered T cells either expressing a second-generation anti-CD19 CAR (CAR-T19) or secreting a CD19/CD3-targeting bispecific T-cell engager antibody (STAb-T19). We found that STAb-T19 cells are more effective than CAR-T19 cells at inducing cytotoxicity, avoiding leukemia escape in vitro, and preventing relapse in vivo. We observed that leukemia escape in vitro is associated with rapid and drastic CAR-induced internalization of CD19 that is coupled with lysosome-mediated degradation, leading to the emergence of transiently CD19-negative leukemic cells that evade the immune response of engineered CAR-T19 cells. In contrast, engineered STAb-T19 cells induce the formation of canonical immunologic synapses and prevent the CD19 downmodulation observed in anti-CD19 CAR-mediated interactions. Although both strategies show similar efficacy in short-term mouse models, there is a significant difference in a long-term patient-derived xenograft mouse model, where STAb-T19 cells efficiently eradicated leukemia cells, but leukemia relapsed after CAR-T19 therapy. Our findings suggest that the absence of CD19 downmodulation in the STAb-T19 strategy, coupled with the continued antibody secretion, allows an efficient recruitment of the endogenous T-cell pool, resulting in fast and effective elimination of cancer cells that may prevent CD19-positive relapses frequently associated with CAR-T19 therapies.


Figures

Figure 1. Comparative in vitro study of engineered STAb-T19 and CAR-T19 cells. A, Western blot detection of secreted 19-BiTE in the conditioned media from lentivirus-transduced human primary T cells (STAb-T19). Conditioned media from nontransduced T cells (NT-T) and media containing blinatumomab (BLI) were used as negative and positive controls, respectively. One representative experiment of three is shown. B, Representative analysis of intracellular and cell surface–bound 19-BiTE (decoration), and cell surface–expressed 19-CAR in NT-T and engineered CAR-T19 and STAb-T19 cells by flow cytometry. One representative experiment out of three independent experiments is shown. The numbers represent the percentage of cells staining positive for the indicated marker. C, Percentage of reporter protein expression in STAb-T19 cells (tdTo) and CAR-T19 cells (GFP). One representative transduction out of three performed is shown. D and E, Percentage of CD4+ and CD8+ T cells (D) and naïve (TN), central memory (TCM), effector memory (TEM), and effector (TE) T cells (E) among NT-T, CAR-T19, or STAb-T19 cells 7 days after transduction (means ± SD of three independent experiments are shown). F, Representative images of immunologic synapse (IS) assembly by primary CAR-T19 and STAb-T19 cells stimulated for 15 minutes with CMAC (blue)-labeled CD19+ cells, stained for CD3ε and actin at the mature IS, with IS topology obtained from 3D reconstructions of regions of interest in confocal stacks. G and H, Real-time cell cytotoxicity assay with HEK-293CD19 target cells cocultured with NT-T, CAR-T19, or STAb-T19 cells at the indicated E:T ratios, and cell index values determined every 15 minutes for 65 hours using an impedance-based method (G) and percentage lysis normalized to NT-T cells (E:T ratio = 0.5:1; H), presented from one representative experiment performed in duplicate. I, Schematic representation of the direct contact coculture system used to study the ability of secreted 19-BiTE to induce bystander T-cell proliferation. J, Bystander T-cell proliferation after 5 days of coculture, with percentage of dividing cells and the number of cell divisions in parentheses. The total E:T ratio was constant (2:1), but the ratios A-T:target and A-T:NA-T varied as indicated. One representative experiment from three independent experiments is shown. K, Cytotoxicity induced by varying numbers of A-T and NA-T cells from the same donor cocultured with NALM6Luc or HeLaLuc target cells for 48 hours, maintaining a constant 2:1 E:T ratio, measured by adding D-luciferin to detect bioluminescence. Data are shown as mean ± SD from four replicates. Significance was calculated by an unpaired Student t test. L, IFNγ secretion was determined by ELISA. Data are mean ± SD of three independent experiments. Significance was calculated by an unpaired Student t test. M, Cocultures were performed in a noncontacting transwell system; NALM6Luc or HeLaLuc target cells and NA-T cells were plated in the bottom well and A-T cells (NT-T, CAR-T19, or STAb-T19) in the insert well. N and O, After 48 hours, the percentage of cytotoxicity (N) was determined by luciferase assay, and IFNγ secretion (O) was determined by ELISA. Data are shown as mean ± SD from three and four replicates, respectively. Significance was calculated by an unpaired Student t test.
Figure 1.
Comparative in vitro study of engineered STAb-T19 and CAR-T19 cells. A, Western blot detection of secreted 19-BiTE in the conditioned media from lentivirus-transduced human primary T cells (STAb-T19). Conditioned media from nontransduced T cells (NT-T) and media containing blinatumomab (BLI) were used as negative and positive controls, respectively. One representative experiment of three is shown. B, Representative analysis of intracellular and cell surface–bound 19-BiTE (decoration), and cell surface–expressed 19-CAR in NT-T and engineered CAR-T19 and STAb-T19 cells by flow cytometry. One representative experiment out of three independent experiments is shown. The numbers represent the percentage of cells staining positive for the indicated marker. C, Percentage of reporter protein expression in STAb-T19 cells (tdTo) and CAR-T19 cells (GFP). One representative transduction out of three performed is shown. D and E, Percentage of CD4+ and CD8+ T cells (D) and naïve (TN), central memory (TCM), effector memory (TEM), and effector (TE) T cells (E) among NT-T, CAR-T19, or STAb-T19 cells 7 days after transduction (means ± SD of three independent experiments are shown). F, Representative images of immunologic synapse (IS) assembly by primary CAR-T19 and STAb-T19 cells stimulated for 15 minutes with CMAC (blue)-labeled CD19+ cells, stained for CD3ε and actin at the mature IS, with IS topology obtained from 3D reconstructions of regions of interest in confocal stacks. G and H, Real-time cell cytotoxicity assay with HEK-293CD19 target cells cocultured with NT-T, CAR-T19, or STAb-T19 cells at the indicated E:T ratios, and cell index values determined every 15 minutes for 65 hours using an impedance-based method (G) and percentage lysis normalized to NT-T cells (E:T ratio = 0.5:1; H), presented from one representative experiment performed in duplicate. I, Schematic representation of the direct contact coculture system used to study the ability of secreted 19-BiTE to induce bystander T-cell proliferation. J, Bystander T-cell proliferation after 5 days of coculture, with percentage of dividing cells and the number of cell divisions in parentheses. The total E:T ratio was constant (2:1), but the ratios A-T:target and A-T:NA-T varied as indicated. One representative experiment from three independent experiments is shown. K, Cytotoxicity induced by varying numbers of A-T and NA-T cells from the same donor cocultured with NALM6Luc or HeLaLuc target cells for 48 hours, maintaining a constant 2:1 E:T ratio, measured by adding D-luciferin to detect bioluminescence. Data are shown as mean ± SD from four replicates. Significance was calculated by an unpaired Student t test. L, IFNγ secretion was determined by ELISA. Data are mean ± SD of three independent experiments. Significance was calculated by an unpaired Student t test. M, Cocultures were performed in a noncontacting transwell system; NALM6Luc or HeLaLuc target cells and NA-T cells were plated in the bottom well and A-T cells (NT-T, CAR-T19, or STAb-T19) in the insert well. N and O, After 48 hours, the percentage of cytotoxicity (N) was determined by luciferase assay, and IFNγ secretion (O) was determined by ELISA. Data are shown as mean ± SD from three and four replicates, respectively. Significance was calculated by an unpaired Student t test.
Figure 2. Leukemia escape from immune pressure. A and B, NALM6 cells were cocultured with NT-T, CAR-T19, or STAb-T19 cells at the indicated E:T ratios, and the relative percentage of CD3+CD19−, CD3−CD19+, and CD3−CD19− cells were measured by FACS. A, Results are shown as the mean of three independent experiments. B, Representative FACS dot plots of the CAR-T19 1:8 E:T ratio sample. Gray, nonviable (NV), in which number of cells in the culture was <500. C and D, NALM6 coculture as in A–B, with CAR-T19 bearing the anti-CD19 FMC63 scFv (FMC63CAR-T19), STAb-T19, or with NT-T cells in the presence of 100 ng/mL blinatumomab (BLI). One representative experiment out of two is shown. Dot plots (D) showing the cell populations cocultured at a 1:16 E:T ratio. E, The percentages of CD3+CD19−, CD3−CD19+, and CD3−CD19− and CD3+CD19+ NALM6 or SEM cell lines after 2 hours of coculture with A-T cells at a 2:1 E:T ratio. The results are means of 3 ± SD similar experiments. F and G, The percentages of CD3+CD19−, CD3−CD19+, CD3−CD19−, and CD3+CD19+ NALM6 cells after coculture with NT-T cells, CAR-T19 cells bearing the anti-CD19 FMC63 scFv (FMC63CAR-T19) or the anti-CD19 A3B1 (A3B1CAR-T19), or STAb-T19 cells. H, Representative dot plots showing the downmodulation of 19-CAR in A3B1CAR-T19 cells after 2 hours of coculture with NALM6 cells. One representative experiment out of three independent experiments is shown. I, The percentage of CD3+CD19−, CD3−CD19+, CD3−CD19−, and CD3+CD19+ primary human B-ALL cells from two different patients (B-ALL1 and B-ALL2, >90% of CD19+ B-ALL blasts) after coculture with primary A-T cells at a 2:1 E:T ratio. The results are means ± SD of 3 similar experiments. J, The number of alive (7AAD−) target B-ALL1 and B-ALL2 cells determined after 24- and 48-hour coculture with primary NT-T, CAR-T19, or STAb-T19 cells at 1:2 and 1:1 E:T ratios. Results are shown as mean ± SD from 3 experiments. Significance was calculated by an unpaired Student t test.
Figure 2.
Leukemia escape from immune pressure. A and B, NALM6 cells were cocultured with NT-T, CAR-T19, or STAb-T19 cells at the indicated E:T ratios, and the relative percentage of CD3+CD19, CD3CD19+, and CD3CD19 cells were measured by FACS. A, Results are shown as the mean of three independent experiments. B, Representative FACS dot plots of the CAR-T19 1:8 E:T ratio sample. Gray, nonviable (NV), in which number of cells in the culture was <500. C and D, NALM6 coculture as in A–B, with CAR-T19 bearing the anti-CD19 FMC63 scFv (FMC63CAR-T19), STAb-T19, or with NT-T cells in the presence of 100 ng/mL blinatumomab (BLI). One representative experiment out of two is shown. Dot plots (D) showing the cell populations cocultured at a 1:16 E:T ratio. E, The percentages of CD3+CD19, CD3CD19+, and CD3CD19 and CD3+CD19+ NALM6 or SEM cell lines after 2 hours of coculture with A-T cells at a 2:1 E:T ratio. The results are means of 3 ± SD similar experiments. F and G, The percentages of CD3+CD19, CD3CD19+, CD3CD19, and CD3+CD19+ NALM6 cells after coculture with NT-T cells, CAR-T19 cells bearing the anti-CD19 FMC63 scFv (FMC63CAR-T19) or the anti-CD19 A3B1 (A3B1CAR-T19), or STAb-T19 cells. H, Representative dot plots showing the downmodulation of 19-CAR in A3B1CAR-T19 cells after 2 hours of coculture with NALM6 cells. One representative experiment out of three independent experiments is shown. I, The percentage of CD3+CD19, CD3CD19+, CD3CD19, and CD3+CD19+ primary human B-ALL cells from two different patients (B-ALL1 and B-ALL2, >90% of CD19+ B-ALL blasts) after coculture with primary A-T cells at a 2:1 E:T ratio. The results are means ± SD of 3 similar experiments. J, The number of alive (7AAD) target B-ALL1 and B-ALL2 cells determined after 24- and 48-hour coculture with primary NT-T, CAR-T19, or STAb-T19 cells at 1:2 and 1:1 E:T ratios. Results are shown as mean ± SD from 3 experiments. Significance was calculated by an unpaired Student t test.
Figure 3. CAR-T19 cells induced CD19 downmodulation and degradation. NALM6 cells were cocultured for 2 hours at a 1:1 E:T ratio with nontransduced Jurkat cells (J-NT), J-CAR-T19, or J-STAb-T19 cells. A, Representative dot plots showing CD2, CD19, and CD10 expression. B, Analysis of 19-CAR expression. C, Representative images of CD19 and LAMP1 cellular localization in NALM6 cells cocultured with J-NT-T, J-CAR-T19, or J-STAb-T19 cells. D, Pearson coefficients' for CD19 and LAMP1 colocalization assessment in NALM6 cells in the indicated cocultures. Dots represent the analyzed cells in one experiment representative of two performed. Mean ± SD values are shown. The P values were calculated with one-way ANOVA with Tukey multiple comparison tests.
Figure 3.
CAR-T19 cells induced CD19 downmodulation and degradation. NALM6 cells were cocultured for 2 hours at a 1:1 E:T ratio with nontransduced Jurkat cells (J-NT), J-CAR-T19, or J-STAb-T19 cells. A, Representative dot plots showing CD2, CD19, and CD10 expression. B, Analysis of 19-CAR expression. C, Representative images of CD19 and LAMP1 cellular localization in NALM6 cells cocultured with J-NT-T, J-CAR-T19, or J-STAb-T19 cells. D, Pearson coefficients' for CD19 and LAMP1 colocalization assessment in NALM6 cells in the indicated cocultures. Dots represent the analyzed cells in one experiment representative of two performed. Mean ± SD values are shown. The P values were calculated with one-way ANOVA with Tukey multiple comparison tests.
Figure 4. In vivo antitumor efficacy of STAb-T19 cells. A, Timeline of cell line–derived xenograft murine model of NSG mice (n = 6/group) receiving i.v. NALM6Luc cells followed by NT-T, CAR-T19, or STAb-T19 cells. B, Bioluminescence images showing disease progression. C, Total radiance quantification at the indicated time points. D, Change in body weight over time. E, Detection by FACS of B-ALL cells (CD19+) cells in PB at day 19, and in spleen and BM at euthanization. F, Relative mRNA expression of CD19 in BM at euthanization. G, T-cell (CD3+) persistence in PB at days 19 and 39, and in spleen and BM at euthanization. Data are shown as mean ± SD. H, Timeline of PDX murine model of NSG mice receiving i.v. CD19+ CD22+ CD10+ B-ALL blasts followed NT-T (n = 4), CAR-T19 (n = 8), or STAb-T19 (n = 8) cells. I, CD10, CD19, and CD22 expression in primary human B-ALL cells with the percentage of positive cells. J, Representative dot plots showing human T cells and B-ALL cells in BM of mice at day 56 after infusion. K, Percentage of CD19+ leukemic cells in PB, spleen, and BM at indicated time points. L, Percentage of CD10+ leukemic cells in BM at euthanization. M, Human T-cell persistence over time in PB, spleen, and BM at the indicated time points. Data are shown as mean ± SD; each dot represents an independent mouse. Significance was calculated by an unpaired Student t test. NA, not applicable; ND, not determined.
Figure 4.
In vivo antitumor efficacy of STAb-T19 cells. A, Timeline of cell line–derived xenograft murine model of NSG mice (n = 6/group) receiving i.v. NALM6Luc cells followed by NT-T, CAR-T19, or STAb-T19 cells. B, Bioluminescence images showing disease progression. C, Total radiance quantification at the indicated time points. D, Change in body weight over time. E, Detection by FACS of B-ALL cells (CD19+) cells in PB at day 19, and in spleen and BM at euthanization. F, Relative mRNA expression of CD19 in BM at euthanization. G, T-cell (CD3+) persistence in PB at days 19 and 39, and in spleen and BM at euthanization. Data are shown as mean ± SD. H, Timeline of PDX murine model of NSG mice receiving i.v. CD19+ CD22+ CD10+ B-ALL blasts followed NT-T (n = 4), CAR-T19 (n = 8), or STAb-T19 (n = 8) cells. I, CD10, CD19, and CD22 expression in primary human B-ALL cells with the percentage of positive cells. J, Representative dot plots showing human T cells and B-ALL cells in BM of mice at day 56 after infusion. K, Percentage of CD19+ leukemic cells in PB, spleen, and BM at indicated time points. L, Percentage of CD10+ leukemic cells in BM at euthanization. M, Human T-cell persistence over time in PB, spleen, and BM at the indicated time points. Data are shown as mean ± SD; each dot represents an independent mouse. Significance was calculated by an unpaired Student t test. NA, not applicable; ND, not determined.
Figure 5. STAb-T19 cells, but not CAR-T19, prevent relapse in a PDX murine model. A, Timeline of NSG mice transplanted with human primary CD19+ CD22+ CD10+ B-ALL blasts followed by NT-T (n = 4), CAR-T19 (n = 5), or STAb-T19 (n = 5) cells. B, Percentage of B-ALL cells (CD19+) in PB over time; each line represents an independent mouse. C, Percentage of human B-ALL cells in spleens and BM of NT-T, CAR-T19, and STAb-T19–treated mice at the indicated time points post-infusion. D, Relative mRNA expression of CD19 in BM at euthanization, and (E) percentage of CD10+ leukemic cells in BM at euthanization. F, Human T-cell (CD3+) persistence over time in PB of each individual mouse. G, Percentage of human T cells (CD3+) in spleen and BM at the indicated time points, and (H) percentage of human CD3+ cells expressing reporter genes (GFP or tdTo). Data are shown as mean ± SD; each dot represents an independent mouse. Significance was calculated by an unpaired Student t test. I, Disease-free survival curve according to the percentage of CD19+ B-ALL cells in PB. Significance was calculated by a log-rank test.
Figure 5.
STAb-T19 cells, but not CAR-T19, prevent relapse in a PDX murine model. A, Timeline of NSG mice transplanted with human primary CD19+ CD22+ CD10+ B-ALL blasts followed by NT-T (n = 4), CAR-T19 (n = 5), or STAb-T19 (n = 5) cells. B, Percentage of B-ALL cells (CD19+) in PB over time; each line represents an independent mouse. C, Percentage of human B-ALL cells in spleens and BM of NT-T, CAR-T19, and STAb-T19–treated mice at the indicated time points post-infusion. D, Relative mRNA expression of CD19 in BM at euthanization, and (E) percentage of CD10+ leukemic cells in BM at euthanization. F, Human T-cell (CD3+) persistence over time in PB of each individual mouse. G, Percentage of human T cells (CD3+) in spleen and BM at the indicated time points, and (H) percentage of human CD3+ cells expressing reporter genes (GFP or tdTo). Data are shown as mean ± SD; each dot represents an independent mouse. Significance was calculated by an unpaired Student t test. I, Disease-free survival curve according to the percentage of CD19+ B-ALL cells in PB. Significance was calculated by a log-rank test.

References

    1. Blanco B, Compte M, Lykkemark S, Sanz L, Alvarez-Vallina LT. Cell-redirecting strategies to ‘STAb’ tumors: beyond CARs and bispecific antibodies. Trends Immunol 2019;40:243–57. - PubMed
    1. Frigault MJ, Maus MV. State of the art in CAR T cell therapy for CD19+ B cell malignancies. J Clin Invest 2020;130:1586–94. - PMC - PubMed
    1. Romero D. Haematological cancer: blinatumomab facilitates complete responses. Nat Rev Clin Oncol 2018;15:200. - PubMed
    1. Xu X, Sun Q, Liang X, Chen Z, Zhang X, Zhou X, et al. Mechanisms of relapse after CD19 CAR T-cell therapy for acute lymphoblastic leukemia and its prevention and treatment strategies. Front Immunol 2019;10:2664. - PMC - PubMed
    1. Blanco B, Ramirez-Fernandez A, Alvarez-Vallina L. Engineering immune cells for in vivo secretion of tumor-specific T cell-redirecting bispecific antibodies. Front Immunol 2020;11:1792. - PMC - PubMed

Publication types