. 2022 Apr 1;135(7):jcs259456.
doi: 10.1242/jcs.259456. Epub 2022 Apr 11.

The histone variant macroH2A1.1 regulates RNA polymerase II-paused genes within defined chromatin interaction landscapes

Affiliations

The histone variant macroH2A1.1 regulates RNA polymerase II-paused genes within defined chromatin interaction landscapes

Ludmila Recoules et al. J Cell Sci. .

Abstract

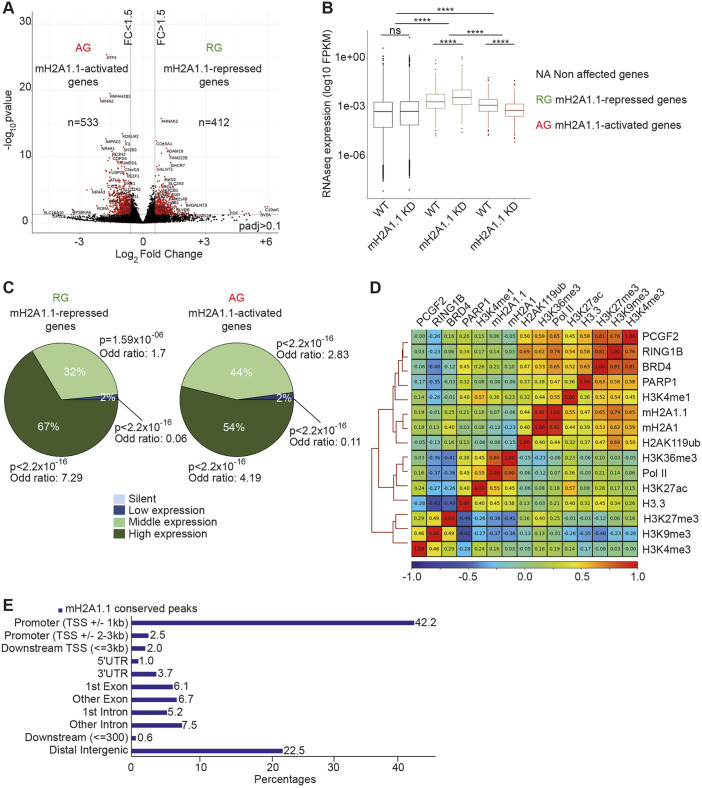
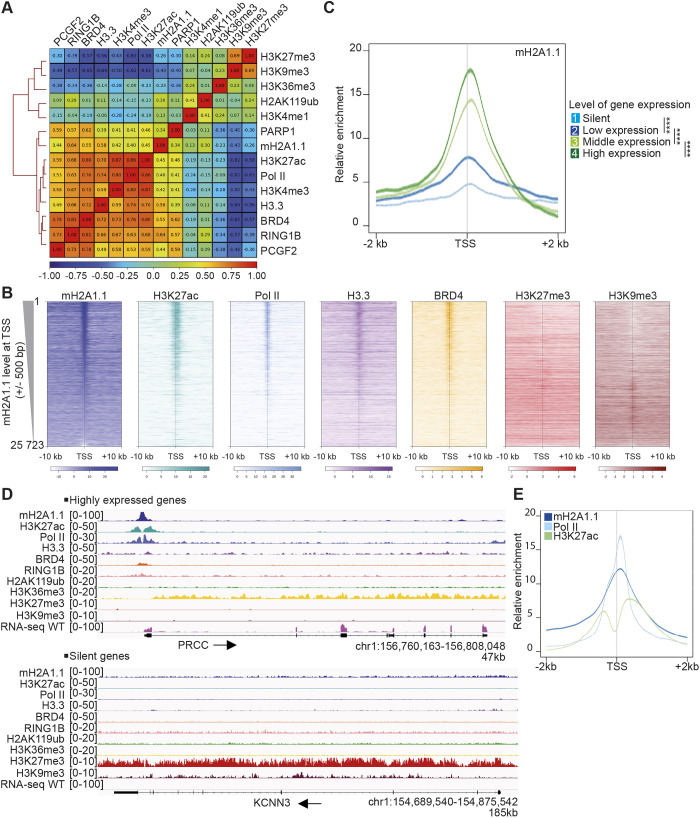
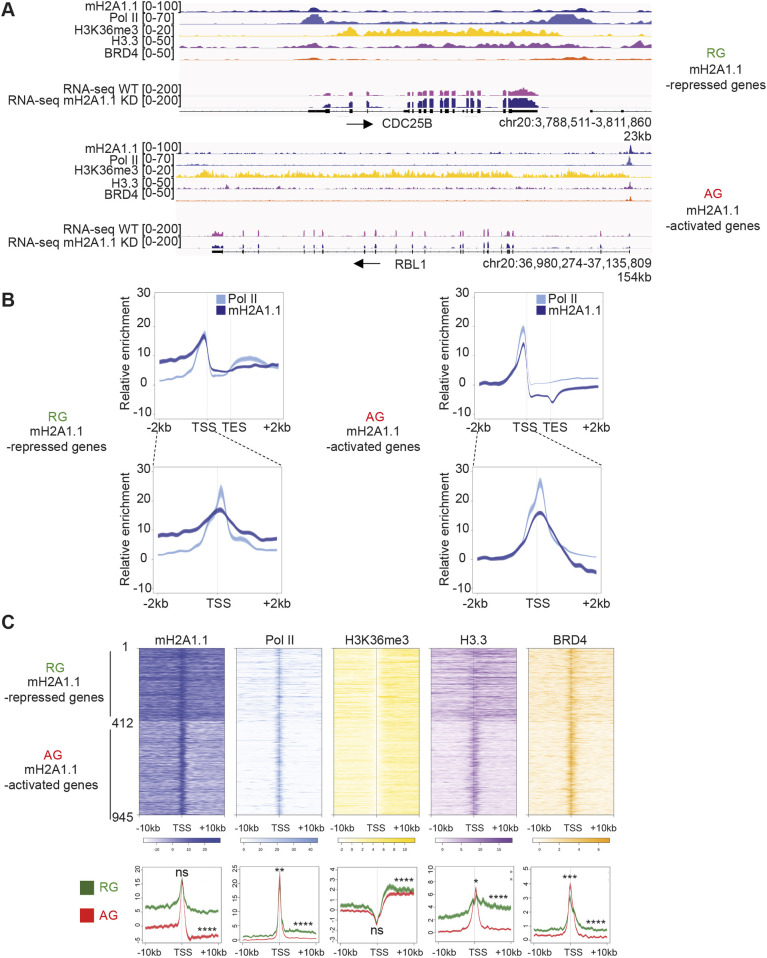
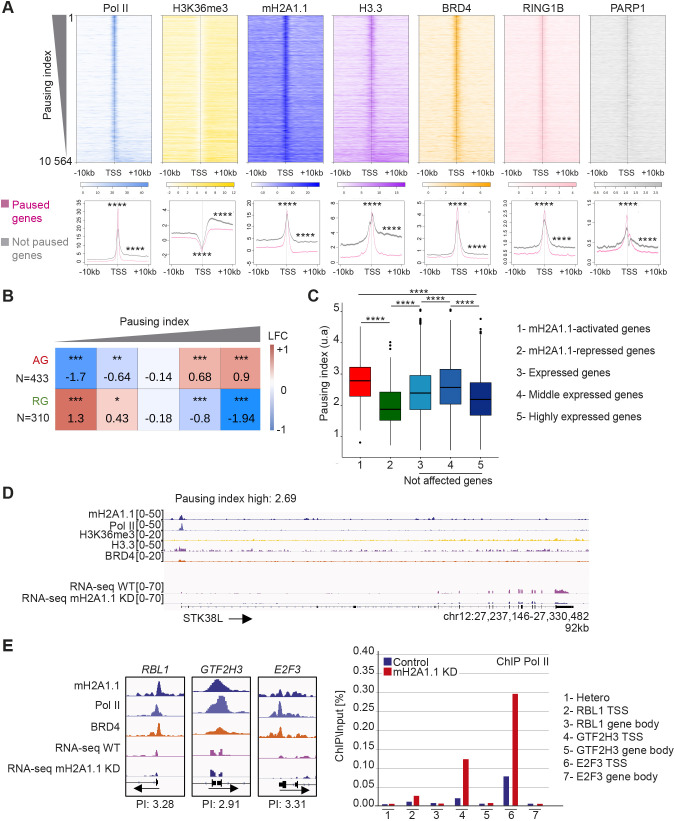
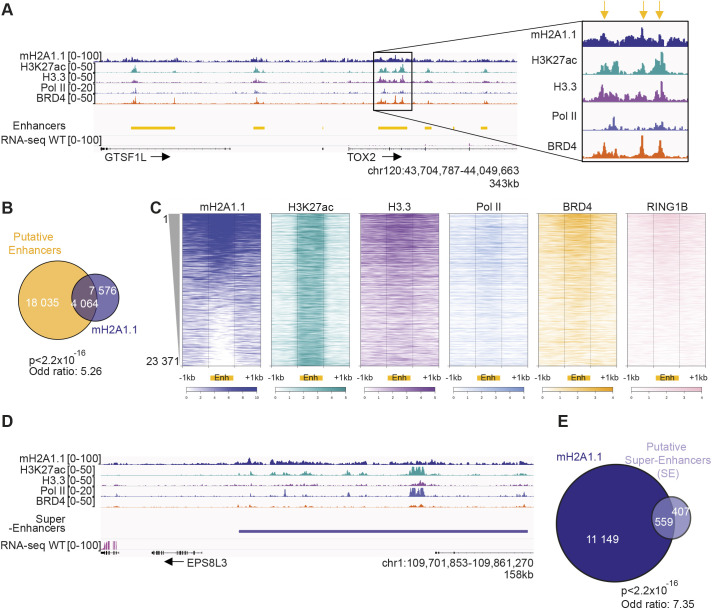
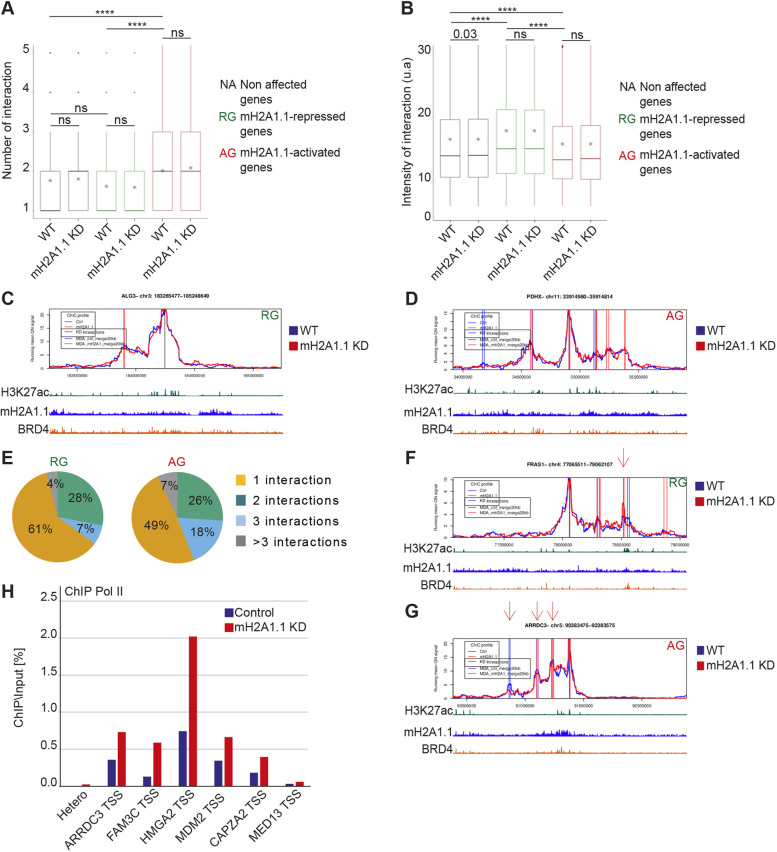
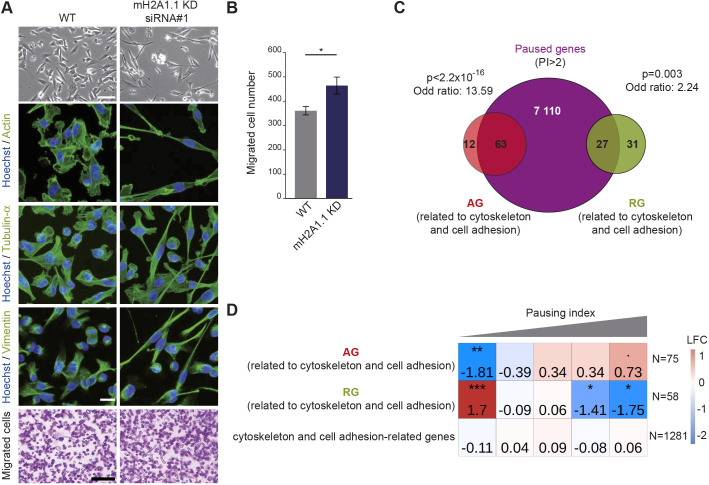
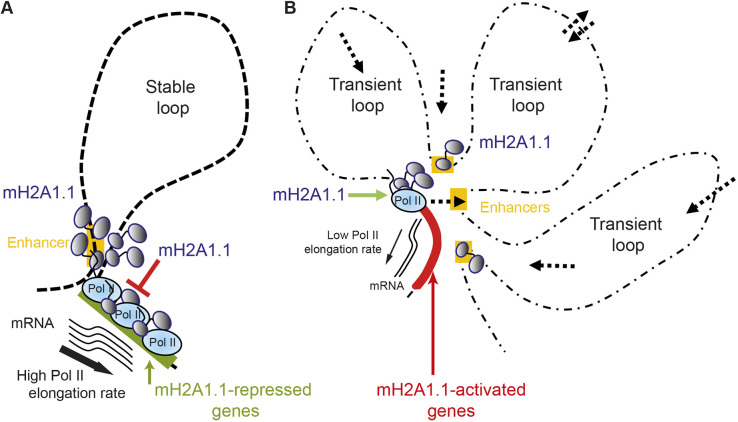
The histone variant macroH2A1.1 plays a role in cancer development and metastasis. To determine the underlying molecular mechanisms, we mapped the genome-wide localization of endogenous macroH2A1.1 in the human breast cancer cell line MDA-MB-231. We demonstrate that macroH2A1.1 specifically binds to active promoters and enhancers in addition to facultative heterochromatin. Selective knock down of macroH2A1.1 deregulates the expression of hundreds of highly active genes. Depending on the chromatin landscape, macroH2A1.1 acts through two distinct molecular mechanisms. The first mitigates excessive transcription by binding over domains including the promoter and the gene body. The second stimulates expression of RNA polymerase II (Pol II)-paused genes, including genes regulating mammary tumor cell migration. In contrast to the first mechanism, macroH2A1.1 specifically associates with the transcription start site of Pol II-paused genes. These processes occur in a predefined local 3D genome landscape, but do not require rewiring of enhancer-promoter contacts. We thus propose that macroH2A1.1 serves as a transcriptional modulator with a potential role in assisting the conversion of promoter-locked Pol II into a productive, elongating Pol II.

Keywords: Breast cancer; Cellular migration; Chromatin structure; Gene expression; Histone variants; RNA polymerase II-paused genes.


Conflict of interest statement

Competing interests The authors declare no competing or financial interests.

Figures

Fig. 1.
Fig. 1.
The histone variant mH2A1.1 regulates expression of hundreds of genes in MDA-MB 231 cells. (A) Volcano plot showing fold change of gene expression in mH2A1.1 KD compared with WT MDA-MB-231 cells. Red dots represent significantly deregulated genes with a fold change >1.5 and P-adj<0.1. (B) Boxplot comparing gene expression (FPKM) of the indicated genes between control (WT) and mH2A1.1 KD conditions. The box represents the 25–75th percentiles, and the median is indicated. Whiskers extend to 25th percentile minus 1.5× IQR and 75th percentile plus 1.5× IQR. Wilcoxon tests were used to compare conditions. ****P<2.2×10⁻¹⁶; ns, non-significant. (C) Pie charts showing proportion of mH2A1.1-regulated genes in four groups categorized by gene expression levels in control cells, as indicated. Enrichment of mH2A1.1 target genes with categories of genes was measured using Fisher exact tests. P-values and the odds ratios are shown. (D) Whole-genome Spearman correlation heatmap of mH2A1.1, mH2A1 and a series of histone modifications and chromatin-associated factor ChIP-seq data, as indicated. Pearson coefficient correlations (PCC, r) are given. Red and blue colors denote high correlation (r close to 1) and anti-correlation (r close to −1), respectively. (E) Proportions of different genomic features associated with mH2A1.1 conserved peaks. mH2A1.1 ‘conserved’ peaks correspond to the common peaks between mH2A1.1 specific ChIP-seq and mH2A1 ChIP-seq and were used for further analysis.
Fig. 2.
Fig. 2.
mH2A1.1 is recruited to promoters of active genes. (A) TSS (±1 kb)-centered Spearman correlation heatmap of ChIP-seq data. Correlations shown as in Fig. 1D. (B) Profiles of relative enrichment around the TSS (±10 kb) of the indicated ChIP-seq data at human annotated genes (n=25,723) ranked according to the mH2A1.1 level at the TSS (±500 bp). Color intensity reflects the level of ChIP-seq enrichment. Heatmaps are oriented with gene bodies placed on the right of the heatmap. (C) Metagene profiles of the average (±s.e.m.) of mH2A1.1 enrichment at TSSs (±2 kb) categorized in four groups according to gene expression levels measured using RNA-seq data. Results of statistical difference analysis between indicated groups are shown on the TSS (±500 bp). Wilcoxon tests were used to compare conditions. ****P<2.2×10⁻¹⁶. (D) Genome browser views of indicated ChIP-seq illustrating the binding of mH2A1.1 to the promoter region of a transcribed gene in an open chromatin state (top) and its absence on a silent gene in a closed chromatin state (bottom). Unstranded RNA-seq signal is also shown. Black arrows indicate direction of transcription. (E) Metagene profile of average (±s.e.m.) of mH2A1.1, Pol II and H3K27ac enrichment at the TSS (±2 kb) of transcribed genes (see C, groups 2-4).
Fig. 3.
Fig. 3.
The chromatin landscapes of mH2A1.1-regulated genes. (A) Genome browser views of ChIP-seq of an mH2A1.1-repressed gene (top) and an mH2A1.1-activated gene (bottom). Unstranded RNA-seq signals in control and mH2A1.1 KD are also shown. Black arrows indicate direction of transcription. (B) Metagene profiles of average (±s.e.m.) of mH2A1.1 and Pol II enrichment at mH2A1.1-regulated genes (TSS-TES±2 kb) and at the TSS of mH2A1.1-regulated genes (TSS±2 kb). (C) Top: Heatmap profiles showing the relative enrichment of the indicated proteins and histone modifications around the TSS (±10 kb) of mH2A1.1-regulated genes (see Fig. 1A). The top half shows mH2A1.1-repressed genes (1-412, n=412), and the bottom half mH2A1.1-activated genes (412-945, n=533). Color intensity reflects the level of ChIP-seq enrichment. Heatmaps are oriented. Bottom: Metagene profiles of average (±s.e.m.) of the indicated ChIP-seq data around the TSS (±10 kb) of mH2A1.1-regulated genes. Average profiles around the TSS of mH2A1.1-repressed genes are shown in green whereas average profiles around the TSS of mH2A1.1-activated genes are shown in red. Results of statistical difference analysis between these two groups are shown, either on the TSS (±50 bp) or on the gene body (+50 bp – TES). Wilcoxon tests were used to compare conditions. ns, not significant. *P<0.05, **P<0.01, ***P<0.001, ****P<2.2×10⁻¹⁶.
Fig. 4.
Fig. 4.
mH2A1.1-activated genes are regulated by Pol II pausing. (A) Top: Heatmap profiles showing enrichment of indicated factors and modifications around the TSS (±10 kb) of transcribed genes (n=10,198) ranked by their PI. Color intensity reflects the level of ChIP-seq enrichment. Heatmaps are oriented. Bottom: Metagene profiles of average (±s.e.m.) of the indicated ChIP-seq data around the TSS (±10 kb) of paused and not paused genes, as indicated in pink and gray, respectively. Genes are considered as paused if their PI is >2 (n=7208). Genes are considered as ‘not paused’ if PI<2 (n=3356). Results of statistical difference analysis between these two groups are shown, either on the TSS (±50 bp) or on the gene body (+50 bp – TES). Wilcoxon tests were used to compare conditions. ****P<2.2×10⁻¹⁶. (B) Fisher test heatmap showing enrichment of indicated mH2A1.1-target genes with genes divided into five equal-sized categories as a function of their PI. Asterisks indicate the significance of the Fisher exact tests; color map and values present in each square highlight the log2 odds ratio (LOR) of the Fisher exact test. N indicates the number of genes used for the analysis. (C) Boxplot comparing the PI of the indicated groups of genes. (Gene number in each group: 1, n=433; 2, n= 310; 3, n= 9 645; 4, n=5 176; 5, n=4.469). The box represents the 25–75th percentiles, and the median is indicated. Whiskers extend to 25th percentile minus 1.5× IQR and 75th percentile plus 1.5× IQR. Wilcoxon tests were used to compare conditions. ****P<2.2×10⁻¹⁶. Only genes characterized by a PI were used. (D) Genome browser view of the indicated ChIP-seq on a paused gene. Unstranded RNA-seq signals in control and mH2A1.1 KD conditions are shown. Black arrows indicate direction of transcription. Only genes characterized by a PI were used. (E) Left: Genome browser view of ChIP-seq of three mH2A1.1-activated genes (RBL1, GTF2H3, E2F3). These genes are considered as paused genes with PIs of 3.28, 2.9 and 3.2, respectively. Right: ChIP-qPCR of Pol II on WT and mH2A1.1-depleted cells. ‘Hetero’ corresponds to a negative position. For each gene, Pol II enrichment was evaluated on the TSS and a gene body region. Results from additional biological replicates are given in Fig. S4D.
Fig. 5.
Fig. 5.
mH2A1.1 associates with enhancers and SEs. (A) Genome browser view of the indicated ChIP-seq illustrating occupancy of mH2A1.1 with ‘putative’ enhancers. The black box shows a magnification of one enhancer. Yellow arrows highlight the maximum signal of ChIP-seq data on this enhancer. (B) Overlap of ‘putative’ enhancers with mH2A1.1 peaks. Enrichment of mH2A1.1 peaks with enhancers were measured using Fisher exact tests. P-values and the odds ratios are shown. (C) Heatmap profiles showing the indicated ChIP-seq data relative enrichment around the enhancers (±1 kb). Color intensity reflects the level of ChIP-seq enrichment. Each line represents an enhancer (from 1 to 23,371 enhancers). Enhancers are ranked according to the level of mH2A1.1 on enhancers, as indicated. (D) Genome browser view of the indicated ChIP-seq illustrating occupancy of mH2A1.1 at ‘putative’ SEs. (E) Overlap of ‘putative’ SEs with mH2A1.1 peaks. Enrichment of mH2A1.1 peaks with SEs were measured using Fisher exact tests. P-values and the odds ratios are shown. ‘Putative’ enhancers and SEs are based on H3K27ac signal outside promoter regions using the ROSE package (Blinka et al., 2017).
Fig. 6.
Fig. 6.
mH2A1.1 regulates gene expression within predefined 3D chromatin domains. (A) Boxplot showing the average number of PCHiC significant interactions per gene with adjacent genomic regions between genes not affected by mH2A1.1, mH2A1.1-repressed genes (n=181) and mH2A1.1-activated genes (n=282) in control and mH2A1.1 KD conditions. PCHiC significant interactions were determined using ChiCMaxima (Ben Zouari et al., 2019). The box represents the 25–75th percentiles, and the median is indicated (middle line). Whiskers extend to 25th percentile minus 1.5× IQR and 75th percentile plus 1.5× IQR. * represents the mean. Paired Wilcoxon tests were used to compare control and mH2A1.1 KD conditions whereas unpaired Wilcoxon tests were used to compare gene categories. ns, not significant. ****P<2.2×10⁻¹⁶. (B) Boxplot showing the mean of intensity of PCHiC interactions per gene between genes not affected by mH2A1.1, mH2A1.1-repressed genes (n=181) and mH2A1.1-activated genes (n=282) in control and mH2A1.1 KD conditions. Features of the boxplot and statistical tests as for A. (C,D) Snapshot of PCHiC dataset on the mH2A1.1-repressed ALG3 gene (C) and the mH2A1.1-activated PDHX gene (D) in control and mH2A1.1 KD conditions. Interaction intensity between the target gene and the associated genomic region are plotted over a 2 Mb gene domain around the promoter bait. Control (blue line) and mH2A1.1 KD (red line) are shown. The vertical bars correspond to PCHiC significant interactions conserved between the two biological replicates in each condition. (E) Pie charts showing the percentage of mH2A1.1-target genes having one, two, three or more than three PCHiC significant interactions. (F) As in C, but this mH2A1.1-repressed gene, FRAS1, shows a reproducible gain of interaction with a specific genomic region (red arrow). (G) As in D, but this mH2A1.1-activated gene, ARRDC3, shows a reproducible reduction of interaction with specific genomic regions (red arrows). (H) ChIP-qPCR of Pol II on WT and mH2A1.1-depleted cells on six genes that show significative loss of interactions with adjacent genomic regions. Snapshots of PCHiC data set are shown in Fig. S6C. ‘Hetero’ corresponds to a negative position. For each gene, Pol II enrichment was evaluated only on the TSS. Results from additional biological replicates are given in Fig. S4E. For the snapshots of PCHiC data, only results from replicate number 1 are shown here; see Fig. S6A,B for replicate number 2.
Fig. 7.
Fig. 7.
mH2A1.1 inhibits cell migration by favoring expression of paused genes involved in cytoskeleton and cell adhesion in MDA-MB-231 cells. (A) Top: Representative differential interference contrast microscopy images of WT and mH2A1.1 KD MDA-MB-231 cells. Scale bar: 100 µm. Center: Immunofluorescence labeling of actin, tubulin-α and vimentin. Nuclei are stained with Hoechst 33342. Scale bar: 20 µm. Bottom: Representative images of cells during the Boyden chamber migration assay. Only migrated cells are labeled in purple. Scale bar: 200 µm. (B) Quantification of the Boyden chamber assay presented in A. Error bars represent s.d from n=3 independent biological experiments as illustrated in A. Wilcoxon tests were used to compare conditions. *P<0.05. (C) Overlap of paused genes (n=7208) with mH2A1.1-regulated genes related to cytoskeleton and cell adhesion. Enrichment of this subgroup of mH2A1.1-regulated genes with paused genes was measured with Fisher exact tests; P-values and the odds ratios are shown. (D) Fisher test heatmap showing enrichment of indicated mH2A1.1-target genes with genes divided in five equal-sized categories as a function of their PI. Asterisks indicate the significatively of the Fisher exact tests; color map and values present in each square highlight the log2 odds ratio (LOR) of the Fisher exact test. N indicates the number of genes used for the analysis.
Fig. 8.
Fig. 8.
Schematic of the two molecular mechanisms by which mH2A1.1 regulates transcription. (A) mH2A1.1-repressed genes display a small number of stable interactions with enhancers or adjacent genomic regions characterized by bivalent chromatin marks. Pol II is enriched at the TSS and the gene body in this group of genes with a high Pol II elongation rate. The presence of mH2A1.1 all along the gene and associated enhancers slows Pol II elongation, perhaps by favoring recruitment of repressors. (B) mH2A1.1-activated genes display a large number of transient interactions. Some of them are established with enhancers bound by BRD4 and possess a specific chromatin landscape. Pol II is mainly paused in this group of genes, with a reduced Pol II elongation rate. Transient interactions between enhancers and promoters may promote Pol II pausing release, favored by mH2A1.1.

References

    1. Adelman, K. and Lis, J. T. (2012). Promoter-proximal pausing of RNA polymerase II: emerging roles in metazoans. Nat. Rev. Genet. 13, 720-731. 10.1038/nrg3293 - DOI - PMC - PubMed
    1. Angelov, D., Molla, A., Perche, P.-Y., Hans, F., Côté, J., Khochbin, S., Bouvet, P. and Dimitrov, S. (2003). The histone variant macroH2A interferes with transcription factor binding and SWI/SNF nucleosome remodeling. Mol. Cell 11, 1033-1041. 10.1016/S1097-2765(03)00100-X - DOI - PubMed
    1. Baranello, L., Wojtowicz, D., Cui, K., Devaiah, B. N., Chung, H.-J., Chan-Salis, K. Y., Guha, R., Wilson, K., Zhang, X., Zhang, H.et al. (2016). RNA polymerase II regulates topoisomerase 1 activity to favor efficient transcription. Cell 165, 357-371. 10.1016/j.cell.2016.02.036 - DOI - PMC - PubMed
    1. Bejjani, F., Tolza, C., Boulanger, M., Downes, D., Romero, R., Maqbool, M. A., Zine El Aabidine, A., Andrau, J.-C., Lebre, S., Brehelin, L.et al. (2021). Fra-1 regulates its target genes via binding to remote enhancers without exerting major control on chromatin architecture in triple negative breast cancers. Nucleic Acids Res. 49, 2488-2508. 10.1093/nar/gkab053 - DOI - PMC - PubMed
    1. Ben Zouari, Y., Molitor, A. M., Sikorska, N., Pancaldi, V. and Sexton, T. (2019). ChiCMaxima: a robust and simple pipeline for detection and visualization of chromatin looping in Capture Hi-C. Genome Biol. 20, 102. 10.1186/s13059-019-1706-3 - DOI - PMC - PubMed

Publication types