. 2022 Apr 13;144(14):6154-6162.
doi: 10.1021/jacs.2c01384. Epub 2022 Apr 1.

μMap-Red: Proximity Labeling by Red Light Photocatalysis

Affiliations

μMap-Red: Proximity Labeling by Red Light Photocatalysis

Benito F Buksh et al. J Am Chem Soc. .

Abstract

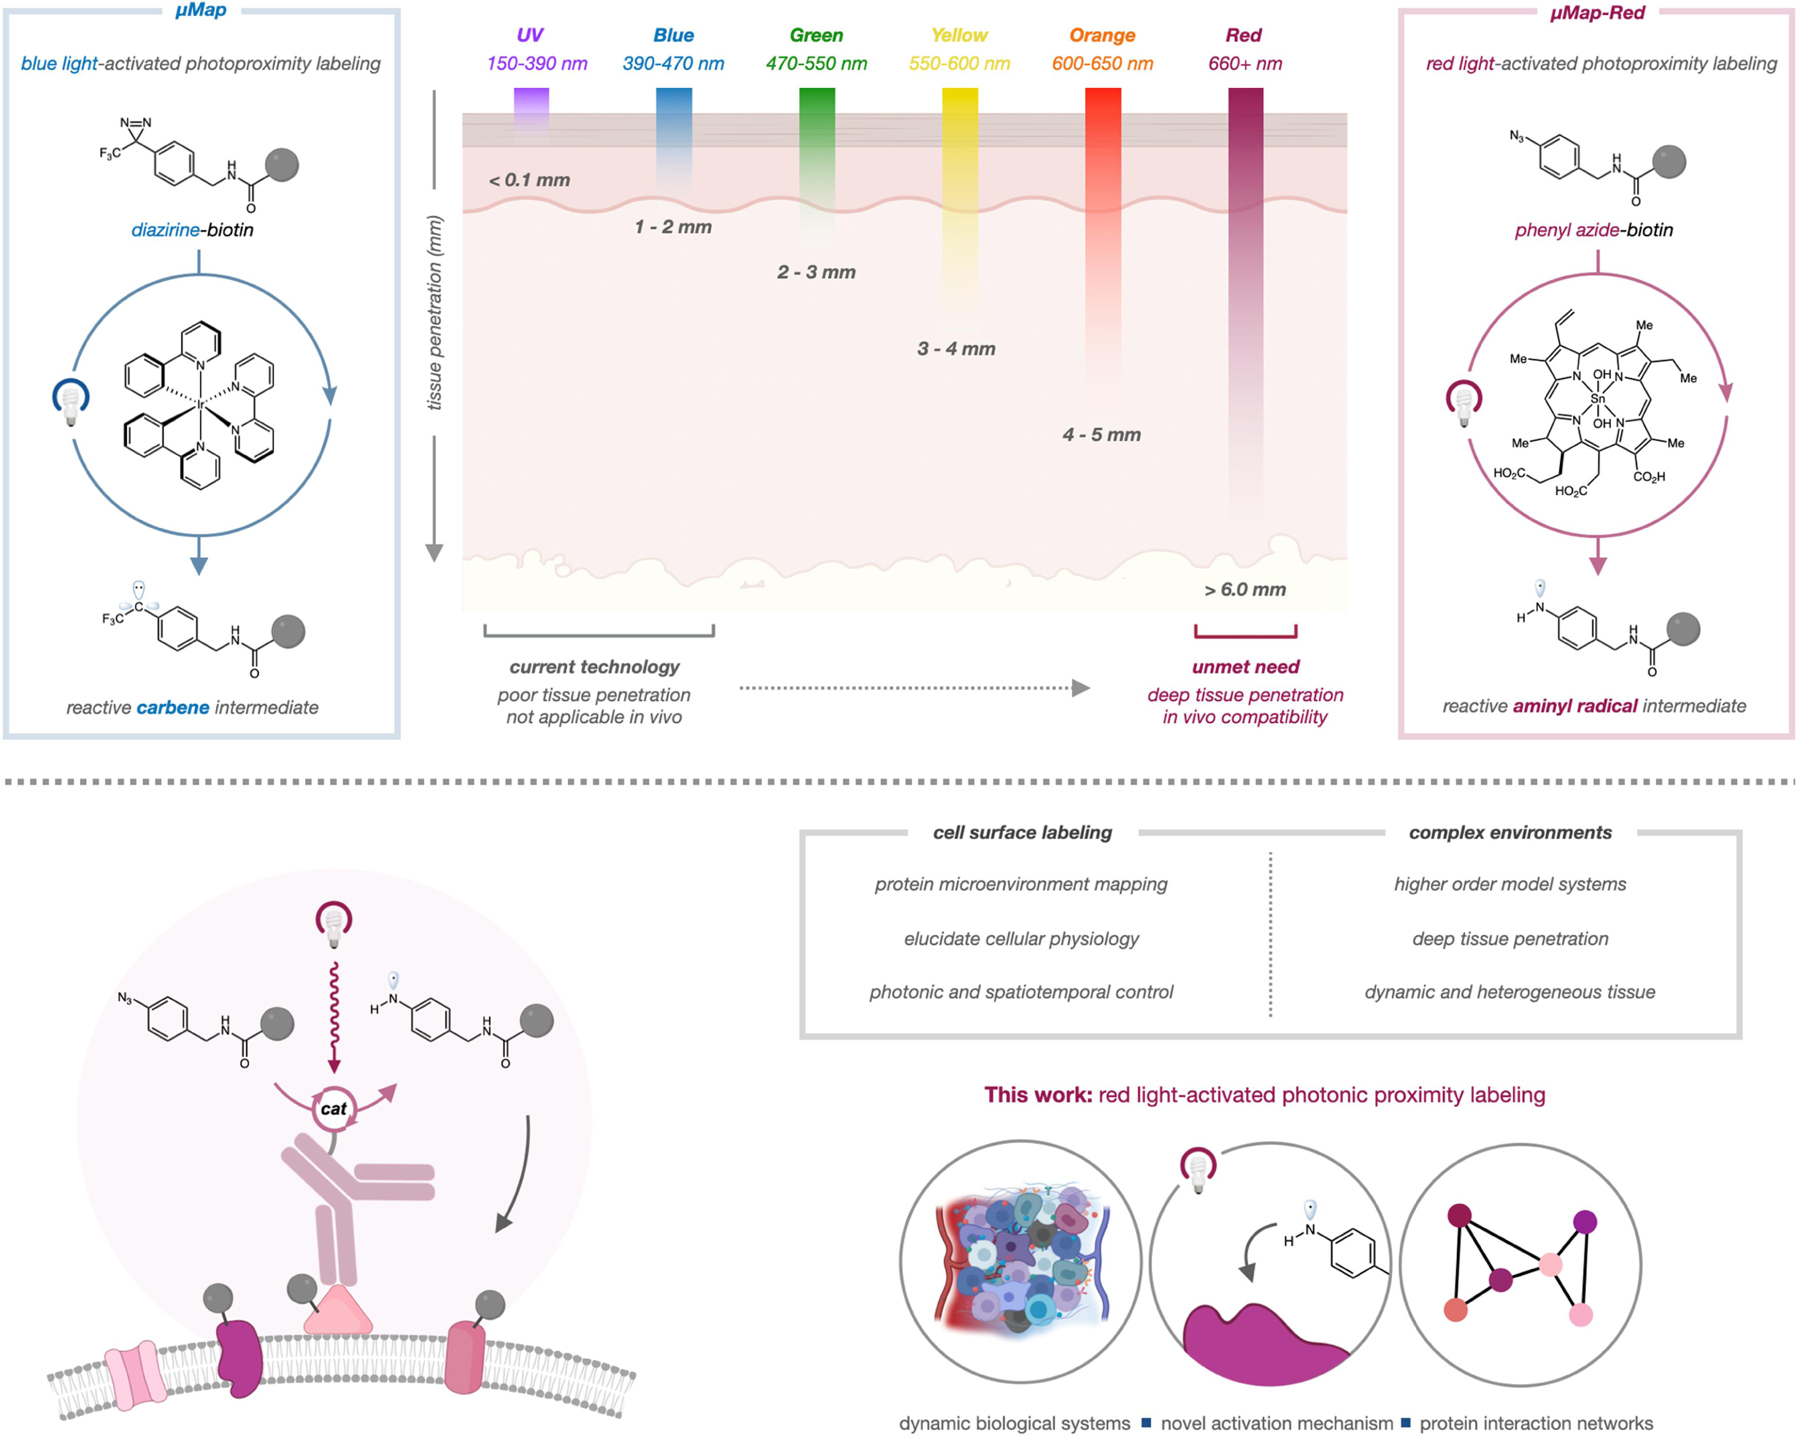
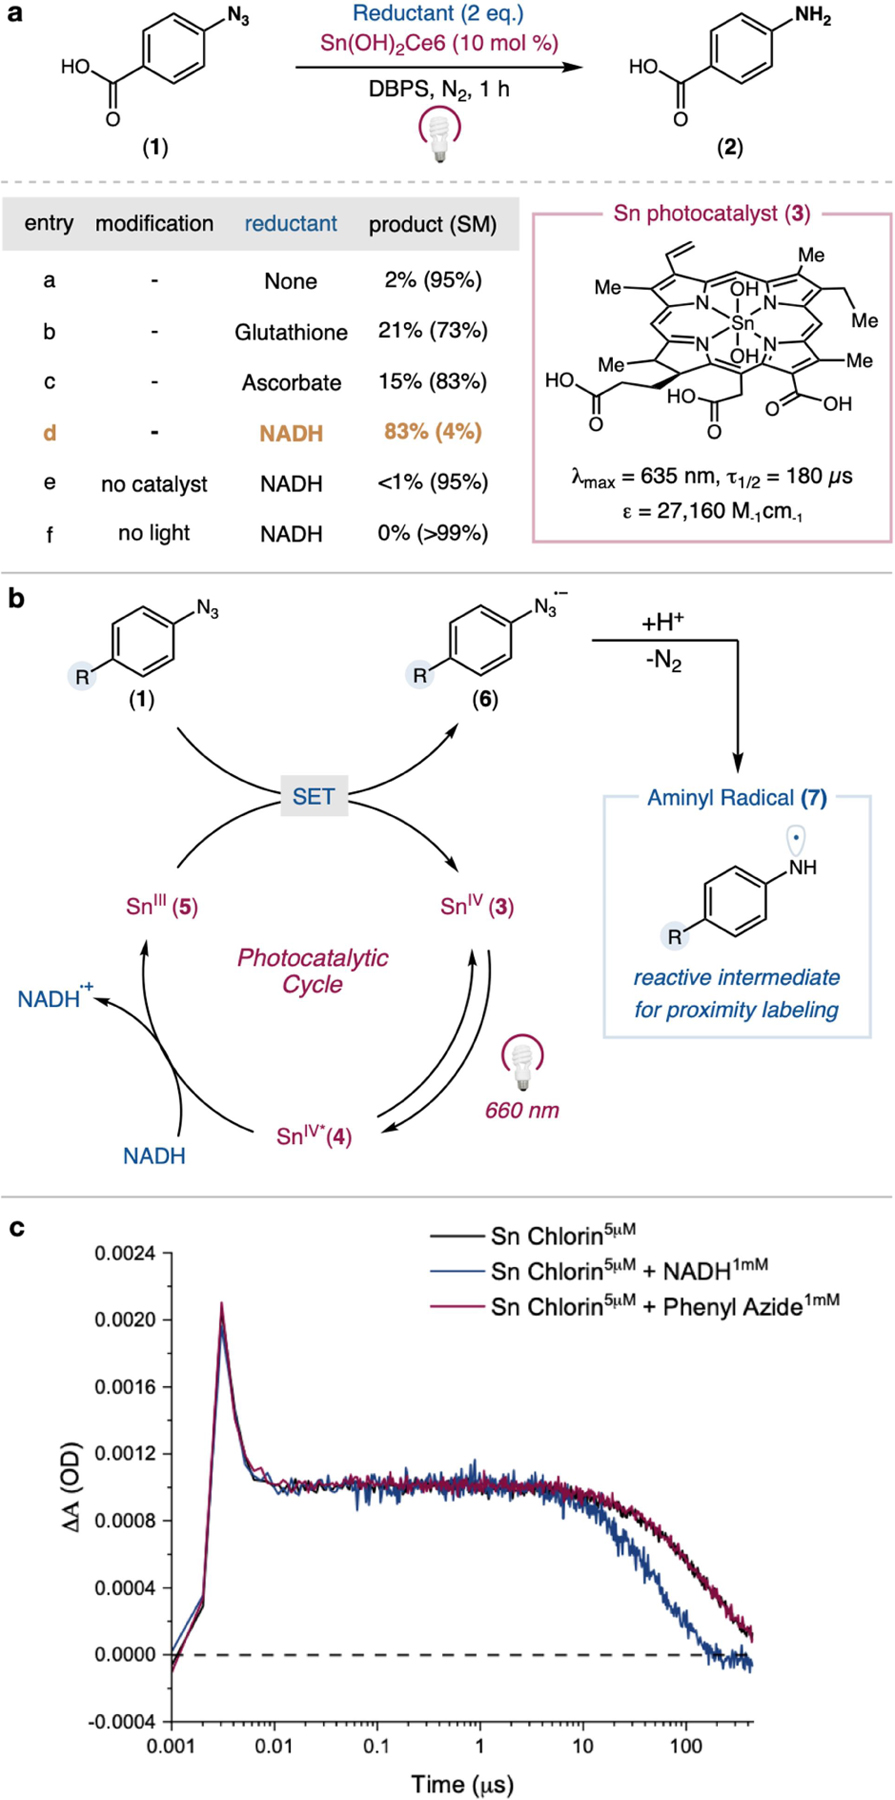
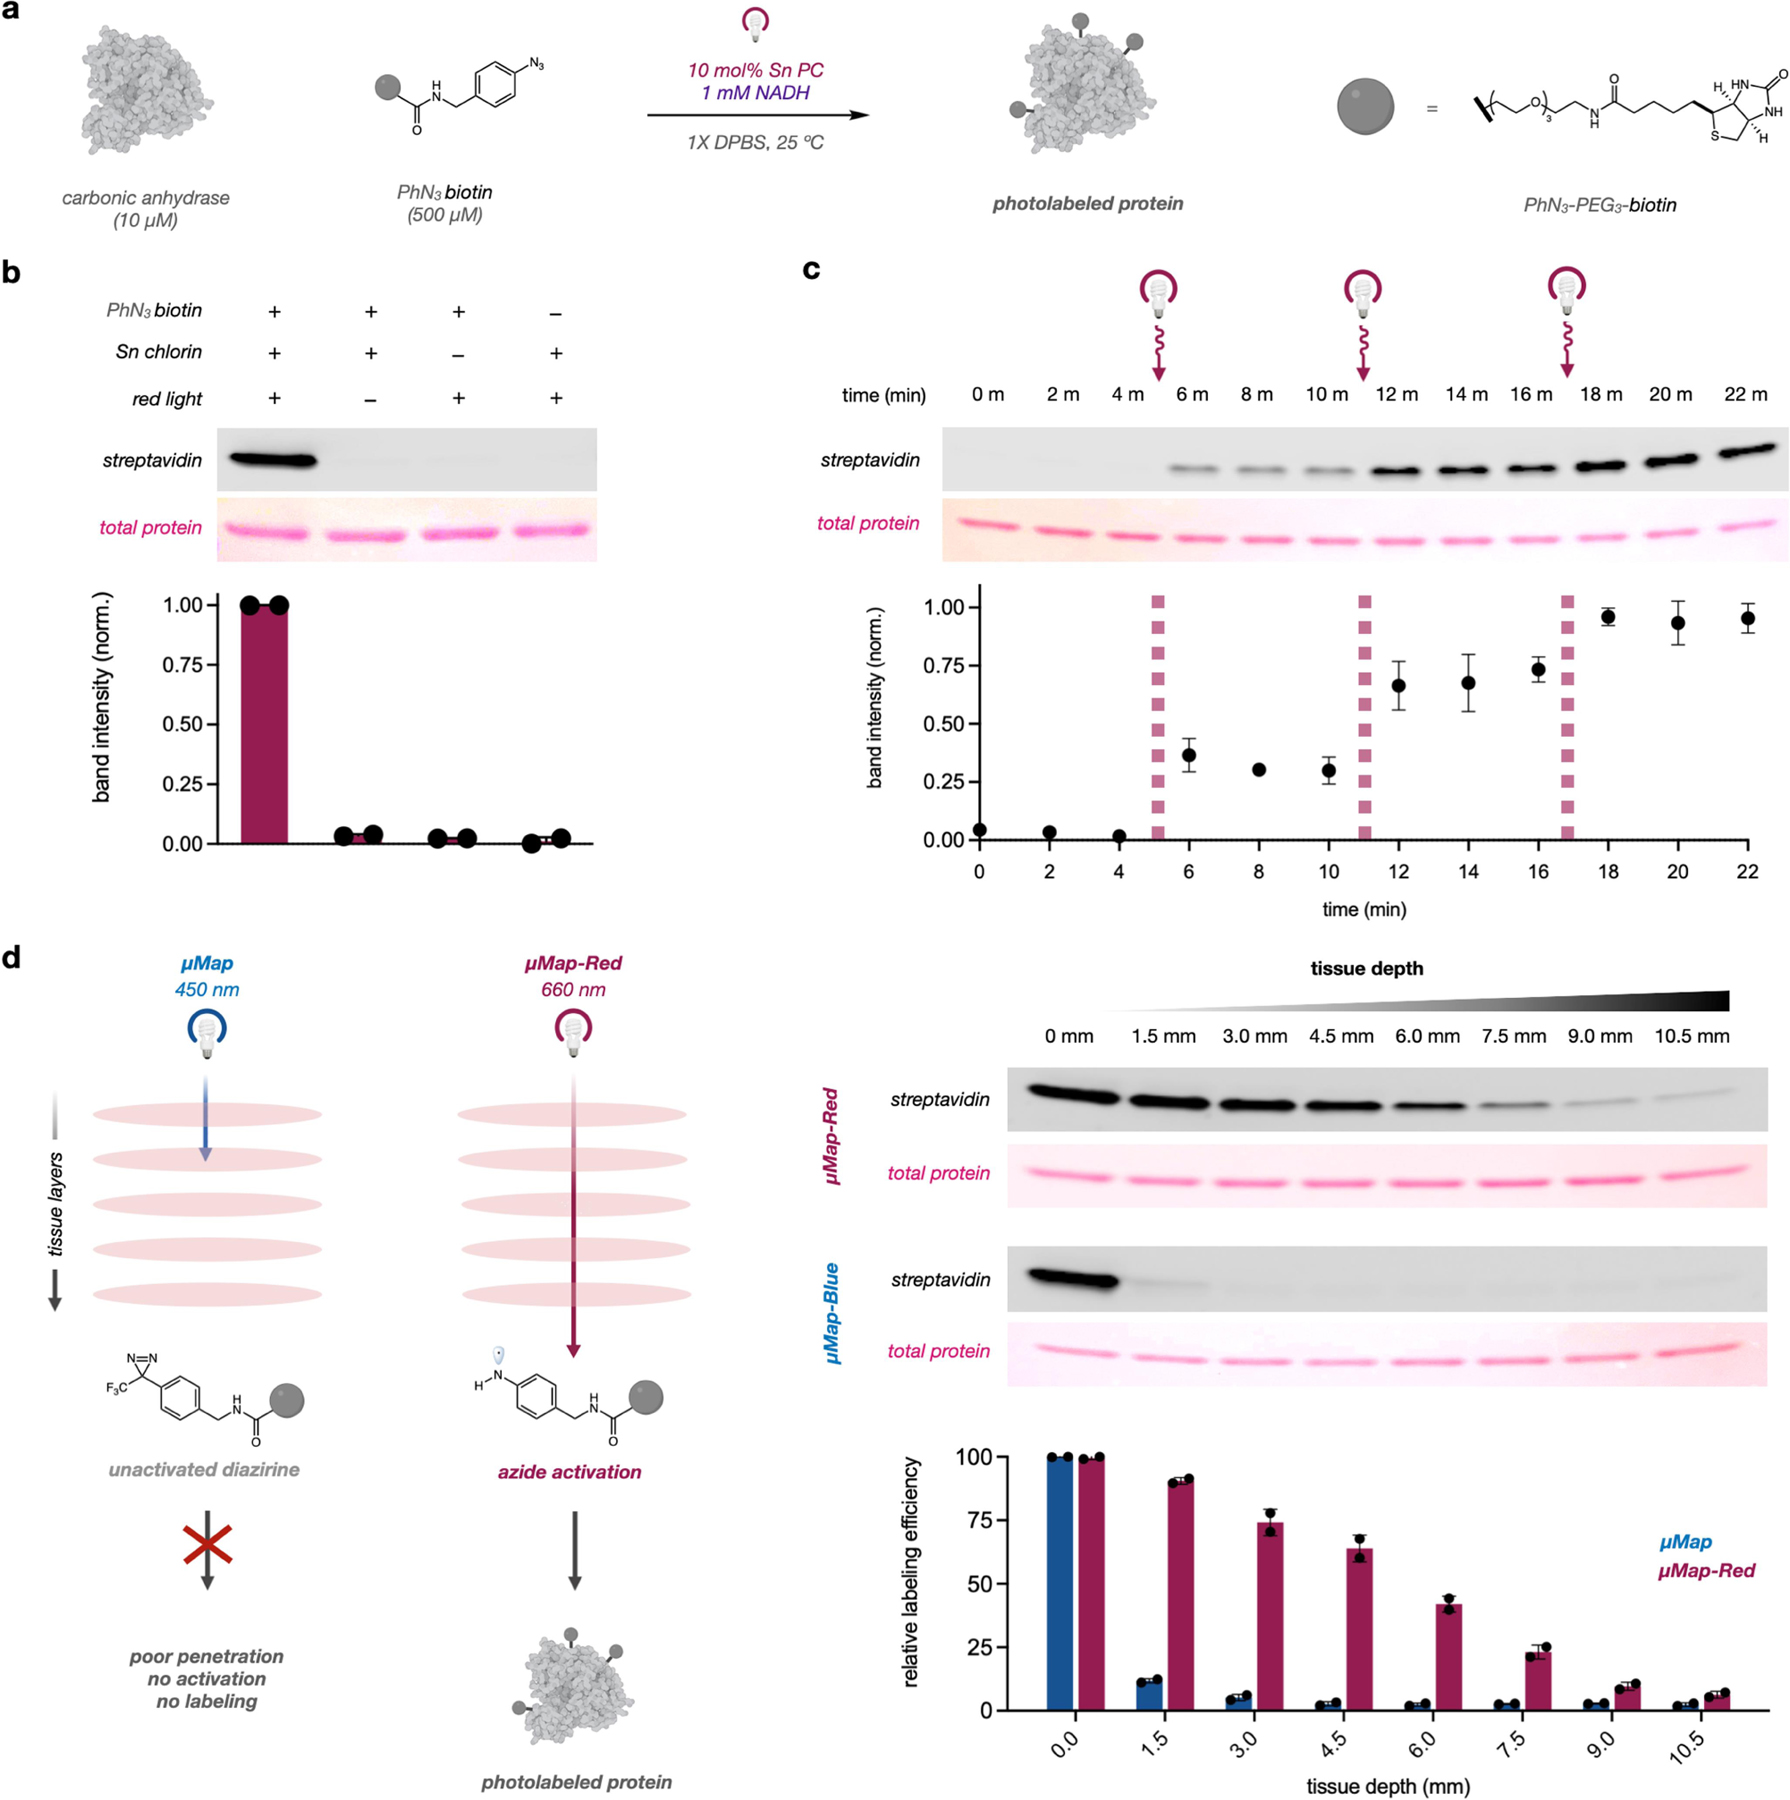
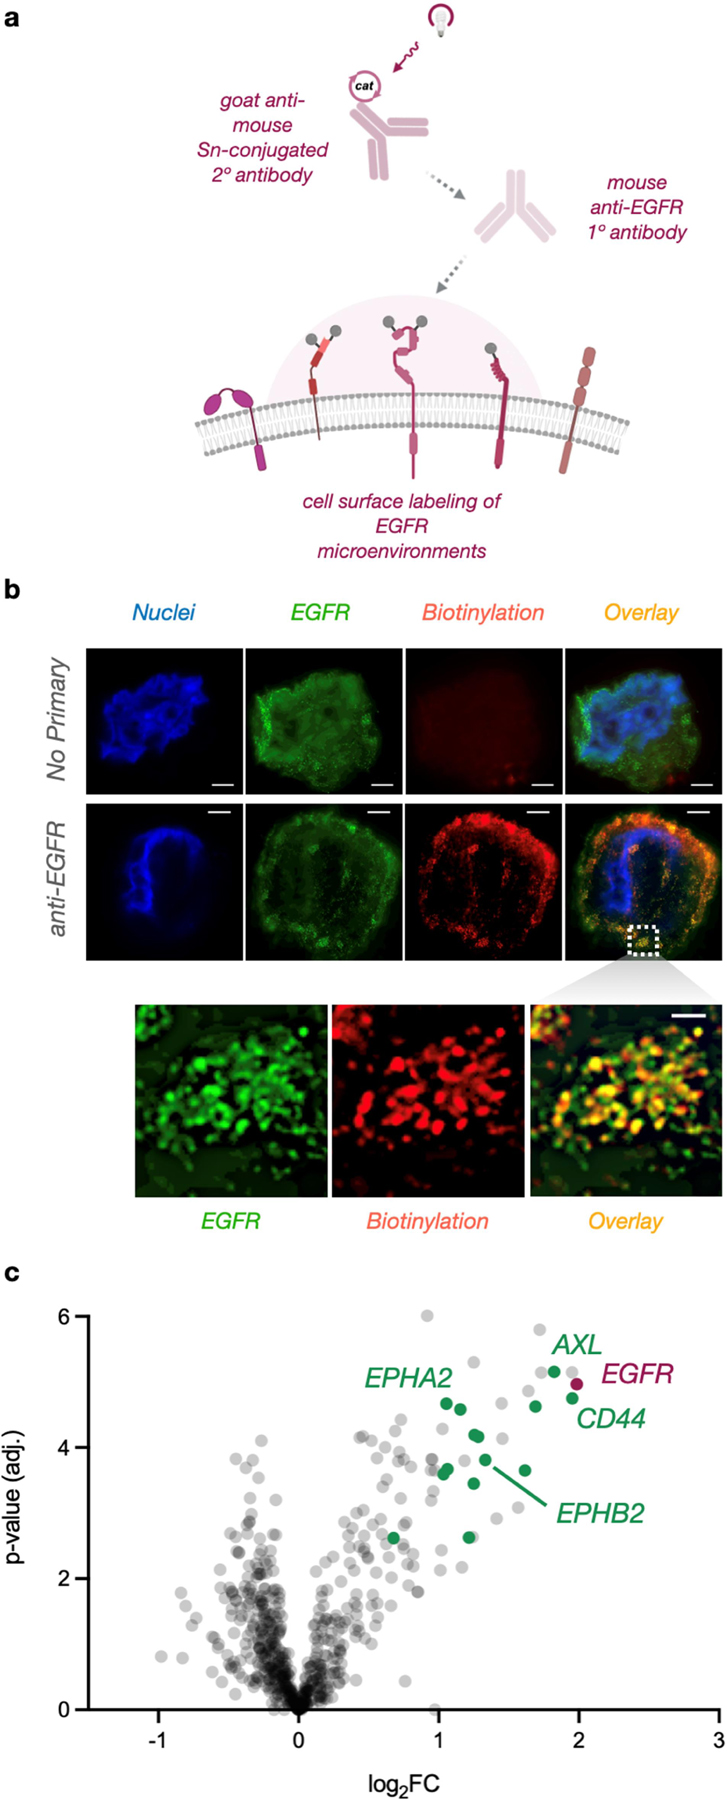
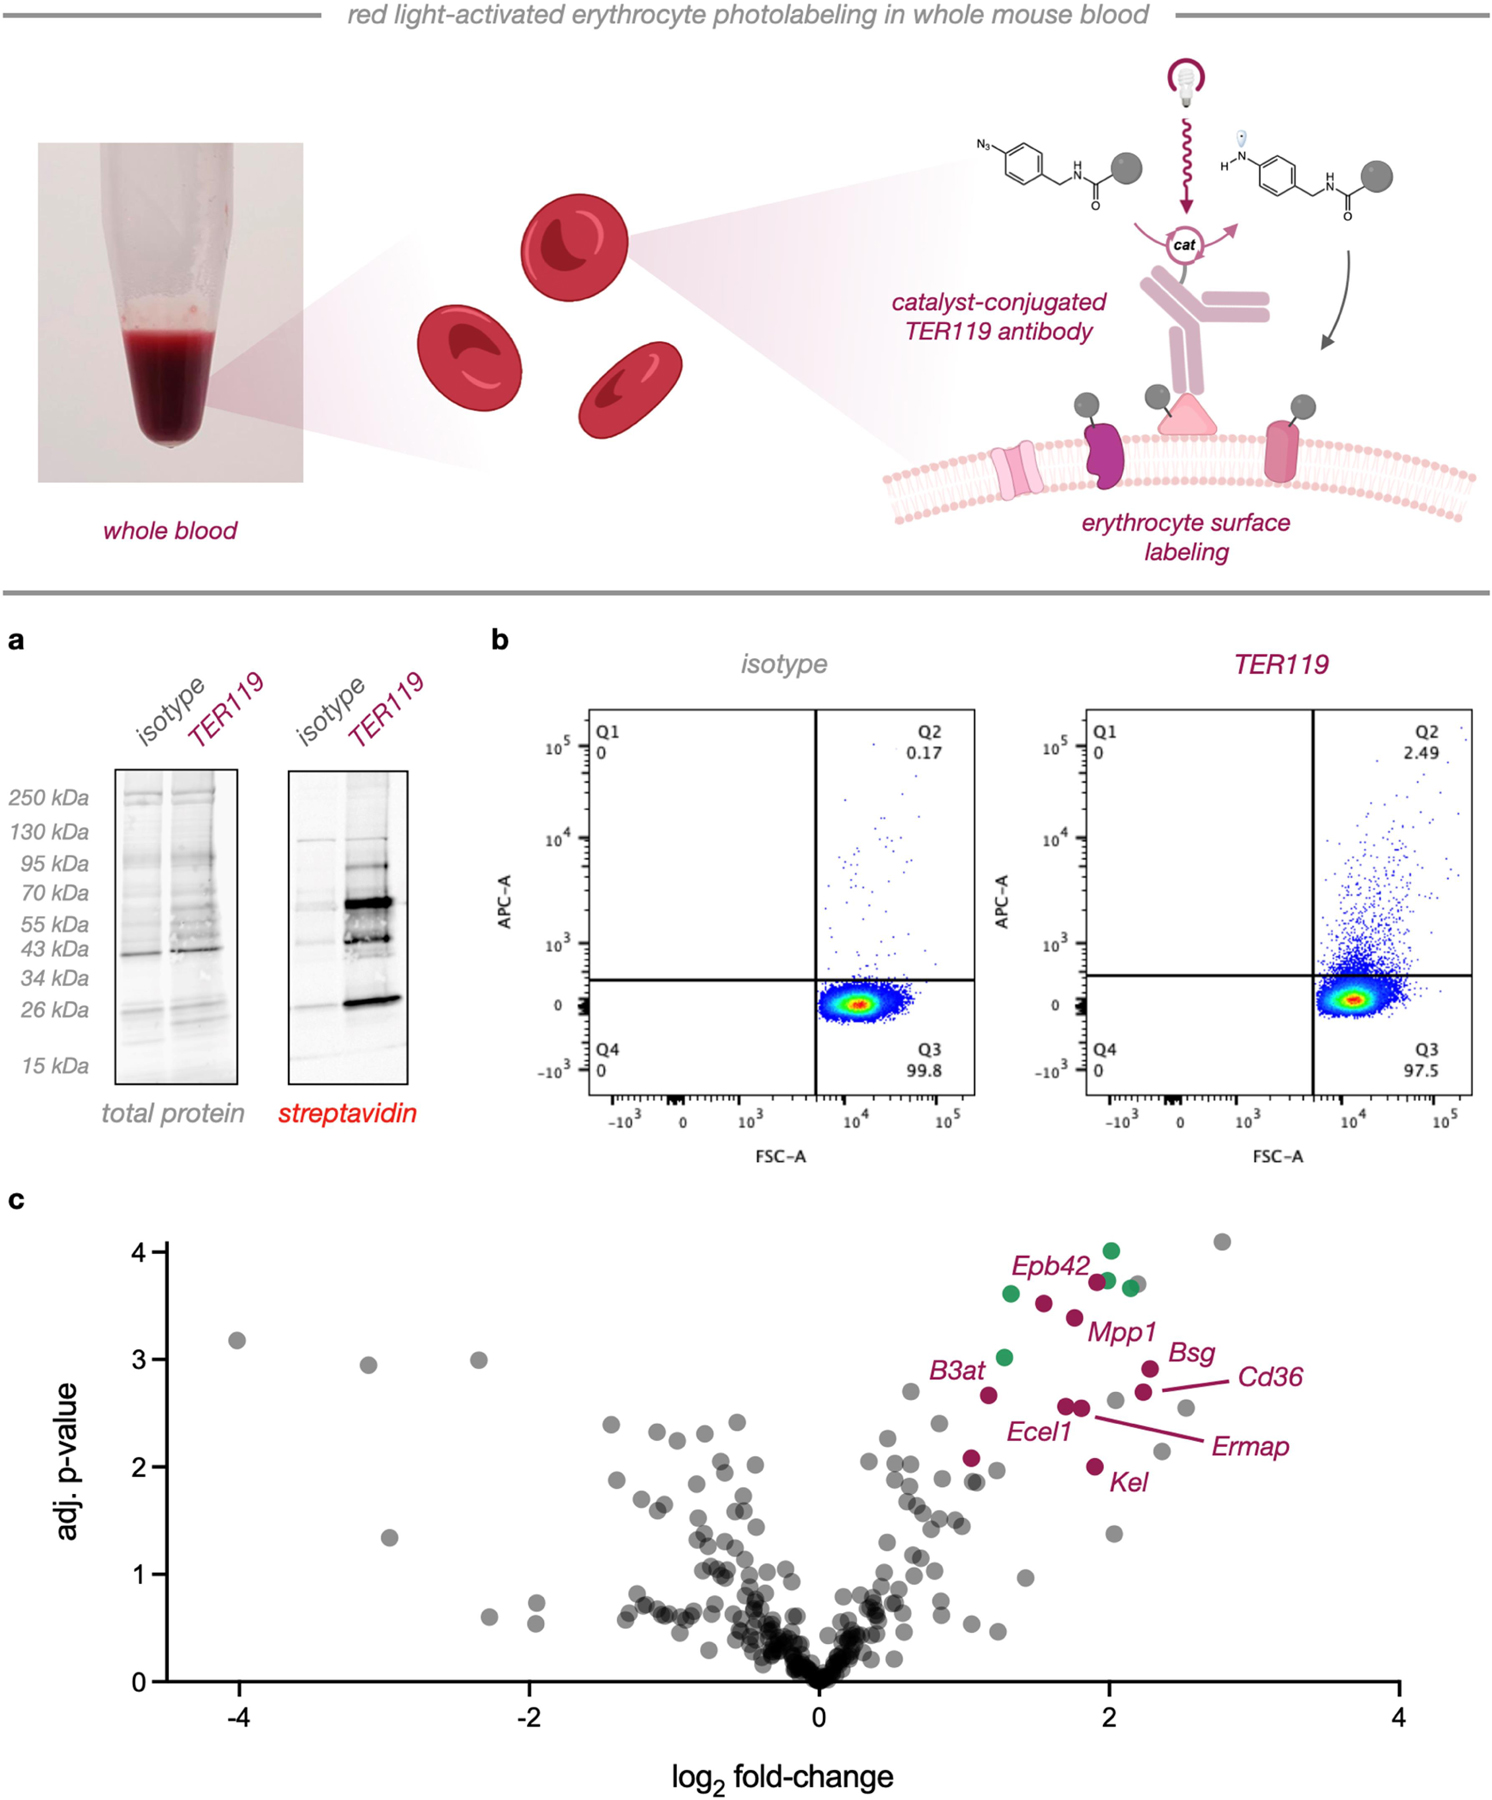
Modern proximity labeling techniques have enabled significant advances in understanding biomolecular interactions. However, current tools primarily utilize activation modes that are incompatible with complex biological environments, limiting our ability to interrogate cell- and tissue-level microenvironments in animal models. Here, we report μMap-Red, a proximity labeling platform that uses a red-light-excited SnIV chlorin e6 catalyst to activate a phenyl azide biotin probe. We validate μMap-Red by demonstrating photonically controlled protein labeling in vitro through several layers of tissue, and we then apply our platform in cellulo to label EGFR microenvironments and validate performance with STED microscopy and quantitative proteomics. Finally, to demonstrate labeling in a complex biological sample, we deploy μMap-Red in whole mouse blood to profile erythrocyte cell-surface proteins. This work represents a significant methodological advance toward light-based proximity labeling in complex tissue environments and animal models.


Figures

Figure 1.
Figure 1.. Proximity labeling by red light photoredox catalysis.
High-energy light is unable to penetrate tissue, while longer wavelength light exhibits better penetration. Red-light excitation of Sn chlorin catalysts can generate reactive aminyl radicals from aryl azides (µMap-Red).
Figure 2.
Figure 2.. Reaction optimization, proposed mechanism, and transient absorption spectroscopy.
a) Effect of reductant on phenyl azide conversion using catalyst 3, b) Proposed reaction mechanism, c) Time-resolved transient absorption spectroscopy of Sn(OH)2 Chlorin e6 in the presence of phenyl azide 1 or NADH.
Figure 3.
Figure 3.. µMap-Red enables photonically-controlled protein labeling and penetrates tissue layers.
a) Scheme for protein biotinylation and b) relevant reaction controls. Bars and data points represent normalized densitometric measurements from two separate experiments, and error bars denote standard error. c) Photonic control over protein biotinylation. A labeling reaction was prepared and aliquots taken every 2 minutes. Samples were irradiated with red light for two minutes at 4, 10, and 16-minute time points. d) µMap-Red and µMap labeling through tissue. Labeling reactions were illuminated under red or blue light and increasing slices of raw meat were inserted between reactions and light sources. All in vitro reactions were analyzed via western blot.
Figure 4.
Figure 4.. µMap-Red photolabels cell-surface receptor microenvironments on living cells.
a) primary anti-EGFR antibodies and Sn-conjugated secondary antibodies were used to label microenvironments on living A549 cells. b) STED microscopy of photolabeled cells with and without anti-EGFR primary antibodies. Inset represents a magnified region of interest illustrating radial labeling clusters overlaying with individual EGFR protein microenvironments. Depicted scale bar is 2 µm for no primary, 3 µm for anti-EGFR, and 1 µm for zoomed inset. 3 c) Quantitative proteomics volcano plot of enriched proteins. Green datapoints represent known EGFR interactors from the BioGrid database.
Figure 5.
Figure 5.. µMap-Red profiles erythrocyte surface proteins in whole mouse blood.
Top, scheme for biotinylation of erythrocyte surfaces in whole blood. a) Western blot analysis of erythrocyte membrane lysate from isotype and TER119-directed photolabeling. b) Flow cytometry of isotype or TER119 photolabeled cells. c) Quantitative proteomics volcano plot of identified proteins after whole blood photolabeling. Red datapoints represent known erythrocyte membrane proteins while green points denote integral membrane-associated proteins.

References

    1. Keskin O; Tuncbag N; Gursoy A, Predicting protein–protein interactions from the molecular to the proteome level. Chem. Rev, 2016, 116 (8), 4884–4909. - PubMed
    1. Hentze MW; Castello A; Schwarzl T; Preiss T, A brave new world of RNA-binding proteins. Nat. Rev. Mol. Cell. Biol, 2018, 19 (5), 327–341. - PubMed
    1. Qin W; Cho KF; Cavanagh PE; Ting AY, Deciphering molecular interactions by proximity labeling. Nat. Methods, 2021, 18 (2), 133–143. - PMC - PubMed
    1. Seath CP; Trowbridge AD; Muir TW; MacMillan DW, Reactive intermediates for interactome mapping. Chem. Soc. Rev, 2021, 50,2911–2926. - PubMed
    1. Rees JS; Li XW; Perrett S; Lilley KS; Jackson AP, Selective proteomic proximity labeling assay using tyramide (SPPLAT): a quantitative method for the proteomic analysis of localized membrane‐bound protein clusters. Curr. Protoc. Protein Sci, 2017, 88 (1), 19.27. 1–19.27. 18. - PubMed

Publication types