. 2022 Apr;8(13):eabm8446.
doi: 10.1126/sciadv.abm8446. Epub 2022 Apr 1.

Loss of geomorphic diversity in shallow tidal embayments promoted by storm-surge barriers

Affiliations

Loss of geomorphic diversity in shallow tidal embayments promoted by storm-surge barriers

Davide Tognin et al. Sci Adv. 2022 Apr.

Abstract

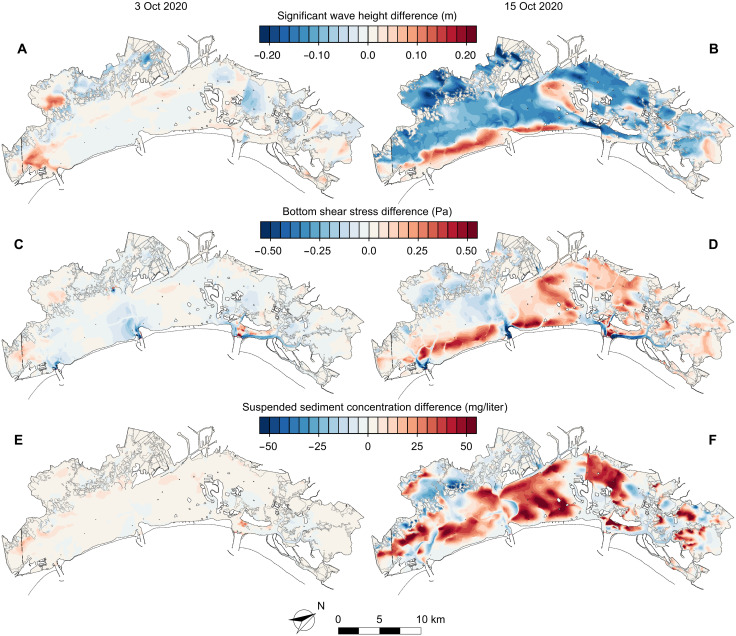
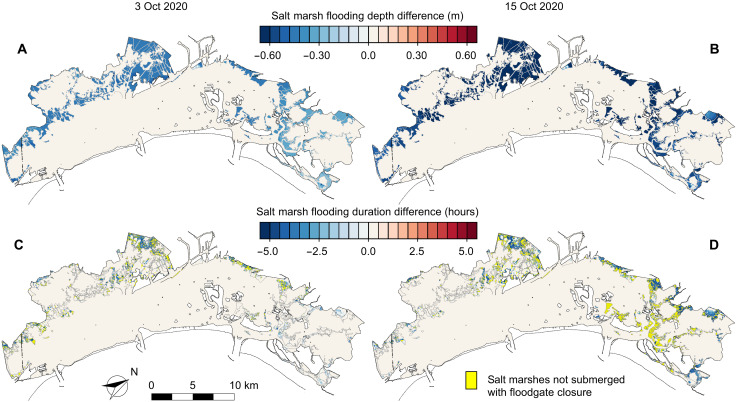
Coastal flooding prevention measures, such as storm-surge barriers, are being widely adopted globally because of the accelerating rise in sea levels. However, their impacts on the morphodynamics of shallow tidal embayments remain poorly understood. Here, we combine field data and modeling results from the microtidal Venice Lagoon (Italy) to identify short- and long-term consequences of flood regulation on lagoonal landforms. Artificial reduction of water levels enhances wave-induced sediment resuspension from tidal flats, promoting in-channel deposition, at the expense of salt marsh vertical accretion. In Venice, we estimate that the first 15 closures of the recently installed mobile floodgates operated between October 2020 and January 2021 contributed to a 12% reduction in marsh deposition, simultaneously promoting a generalized channel infilling. Therefore, suitable countermeasures need to be taken to offset these processes and prevent significant losses of geomorphic diversity due to repeated floodgate closures, whose frequency will increase as sea levels rise further.


Figures

Fig. 1.
Fig. 1.. Geomorphological setting and floodgates.
(A) Bathymetry of the Venice Lagoon located in northeastern Italy (inset). MSL, mean sea level. Salt marshes are indicated by the gray contour. Chioggia inlet (360 m wide, 12 m deep, 18 gates) (B), Malamocco inlet (380 m wide, 14 m deep, 19 gates) (C), and Lido inlet (D), divided into the San Nicolò barrier (400 m wide, 12 m deep, 20 gates) and the Treporti barrier (420 m wide, 6 m deep, 21 gates; still submerged during the test in the satellite image), during the closure test on 9 October 2020, 10:00 UTC (Landsat 8 NASA). (E) Wind rose for the period 2000–2019 measured in Chioggia; arrows highlight the two morphologically significant winds [Bora, northeast (NE); Sirocco, southeast (SE)]. (F) The Mo.S.E. barrier during a closure at the Chioggia inlet [photo position indicated in (B); photo credits: www.mosevenezia.eu/].
Fig. 2.
Fig. 2.. Effect of floodgate closure on the lagoon hydrodynamics.
Water level and wind conditions for the 3 October (A) and 15 October 2020 (B) events. Solid circles represent water level measurements in three different stations [Punta della Salute (PS), Laguna Nord–Saline (LN-S), and Chioggia Vigo (ChV)] represented in the inset, and solid and dashed lines represent water levels modeled in closed and open barrier scenarios, respectively. Wind roses show wind conditions grouped by 6-hour-long intervals and measured in the Laguna Nord–Saline station. Gray background indicates the time span of Mo.S.E. closures. Difference between maximum modeled water level in the closed and open barrier scenarios for the 3 October (C) and 15 October 2020 (D) events.
Fig. 3.
Fig. 3.. Effect of floodgate closure on sediment resuspension within tidal flats and channels.
Difference between maximum modeled significant wave height in the closed and open barrier scenarios for the 3 October (A) and 15 October 2020 (B) events. Difference between maximum modeled bottom shear stress in the closed and open barrier scenarios for the 3 October (C) and 15 October 2020 (D) events. Difference between maximum modeled SSC in the closed and open barrier scenarios for the 3 October (E) and 15 October 2020 (F) events. All these maps were obtained by subtracting, for each of the parameters of interest, the maximum values observed in the closed and open barrier scenarios over the whole simulation horizon. Salt marshes are highlighted by gray lines.
Fig. 4.
Fig. 4.. Effect of floodgate closure on salt marsh flooding.
Difference between maximum modeled salt marsh flooding depth in the closed and open barrier scenario for the 3 October (A) and 15 October 2020 (B) events. Difference between maximum salt marsh flooding duration in the closed and open barrier scenario for the 3 October (C) and 15 October 2020 (D) events. All these maps were obtained by subtracting, for each of the parameters of interest, the maximum values observed in the closed and open barrier scenarios over the whole simulation horizon. Salt marshes are highlighted by gray lines.
Fig. 5.
Fig. 5.. Effect of floodgates closure on the sediment budget.
Sediment volume changes through time for different morphological units (salt marshes, tidal flats, and channels), suspended sediment, and import/export through inlets for the 3 October event (A), the 15 October event (C), and the period October 2020–January 2021 (E). Continuous lines refer to the open barrier scenario, and dashed lines refer to the closed barrier one. Gray background indicates the time span of Mo.S.E. closures. Net sediment volume changes at the end of the events, when suspended sediment volume returns negligible (B, D, and F). The time instants t* considered for the net volume change represented are indicated in (A), (C), and (E). Percentages indicated the relative change in the closed barrier scenario with respect to the open barrier one.
Fig. 6.
Fig. 6.. Effect of floodgate closure on the suspended sediment fate.
Particle position at the end of the 3 October (A and C) and 15 October (B and D) events for two different salt marsh areas, one in the northern lagoon (red diamond) and one in the southern lagoon (blue diamond). A total of 10,000 particles are released at the source point (diamond) at the beginning of the closure in both open and closed barrier scenarios. Pie charts show the percentage of particle that reaches the salt marsh in the scenario with (darker yellow) and without (darker purple) barrier closure. Water levels modeled in front of the two marshes (E and F).

References

    1. R. J. Nicholls, P. P. Wong, V. Burkett, J. O. Codignotto, J. E. Hay, R. F. McLean, S. Ragoonaden, C. D. Woodroffe, in Climate Change 2007: Impacts, Adaptation and Vulnerability. Contribution of Working Group II to the Fourth Assessment Report of the Intergovernmental Panel on Climate Change, M. L. Parry, O. F. Canziani, J. P. Palutikof, P. J. van der Linden, C. E. Hanson, Eds. (Cambridge Univ. Press, 2007), pp. 315–356.
    1. Kirezci E., Young I. R., Ranasinghe R., Muis S., Nicholls R. J., Lincke D., Hinkel J., Projections of global-scale extreme sea levels and resulting episodic coastal flooding over the 21st Century. Sci. Rep. 10, 1–12 (2020). - PMC - PubMed
    1. Nicholls R. J., Lincke D., Hinkel J., Brown S., Vafeidis A. T., Meyssignac B., Hanson S. E., Merkens J.-L., Fang J., A global analysis of subsidence, relative sea-level change and coastal flood exposure. Nat. Clim. Chang. 11, 338–342 (2021).
    1. M. Oppenheimer, B. C. Glavovic, J. Hinkel, R. van de Wal, A. K. Magnan, A. Abd-Elgawad, R. Cai, M. Cifuentes-Jara, R. M. DeConto, T. Ghosh, J. Hay, F. Isla, B. Marzeion, B. Meyssignac, Z. Sebesvari, Sea level rise and implications for low-lying islands, coast and communitites, in Intergovernmental Panel on Climate Change (IPCC) Special Report on the Ocean and Cryosphere in a Changing Climate. H. O. Portner, D. C. Roberts, V. Masson-Delmotte, P. Zhai, M. Tignor, E. Poloczanska, K. Mintenbeck, A. Alegria, M. Nicolai, A. Okem, J. Petzold, B. Rama, N. M. Weyer, eds. (Cambridge Univ. Press, Cambridge, UK, 2019). pp. 321–445.
    1. Vousdoukas M. I., Mentaschi L., Hinkel J., Ward P. J., Mongelli I., Ciscar J.-C., Feyen L., Economic motivation for raising coastal flood defenses in Europe. Nat. Commun. 11, 2119 (2020). - PMC - PubMed