. 2022 Apr;8(13):eabm5504.
doi: 10.1126/sciadv.abm5504. Epub 2022 Apr 1.

Coordinated regulation of RNA polymerase II pausing and elongation progression by PAF1

Affiliations

Coordinated regulation of RNA polymerase II pausing and elongation progression by PAF1

Zhenning Wang et al. Sci Adv. 2022 Apr.

Abstract

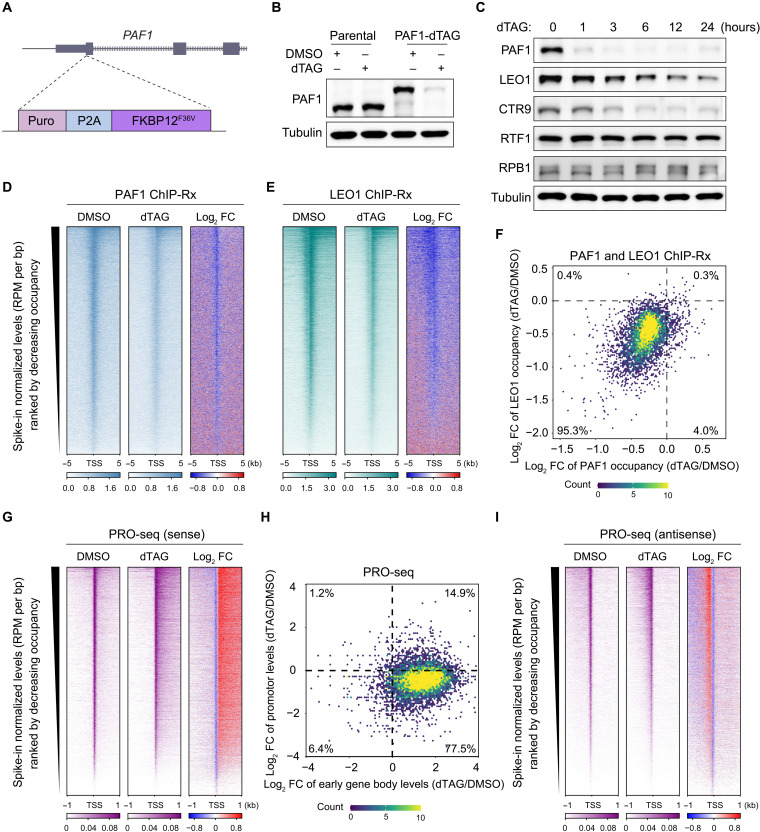
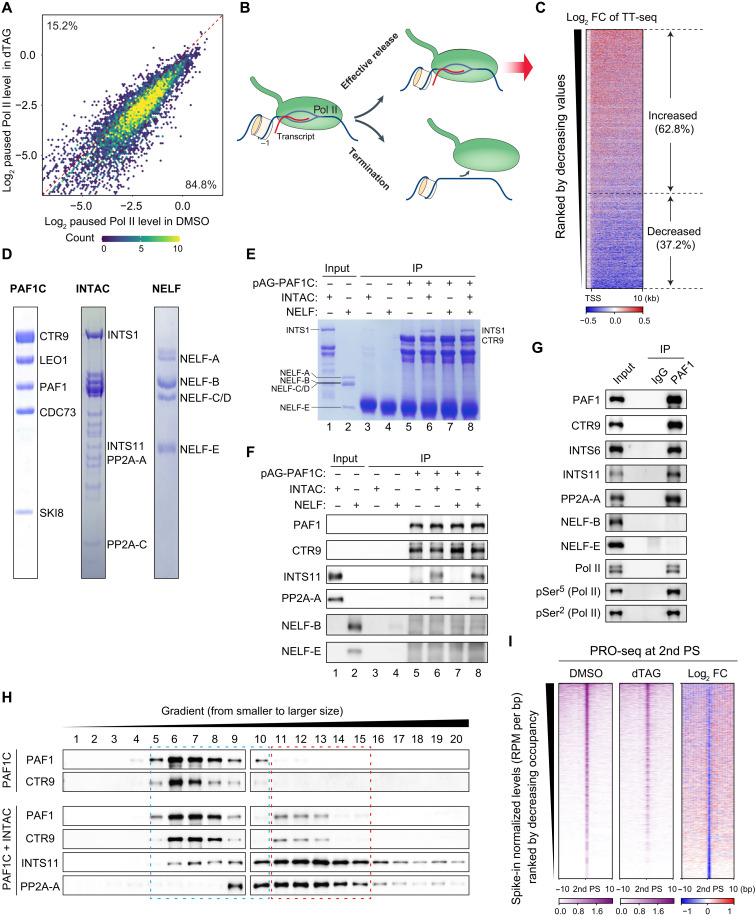
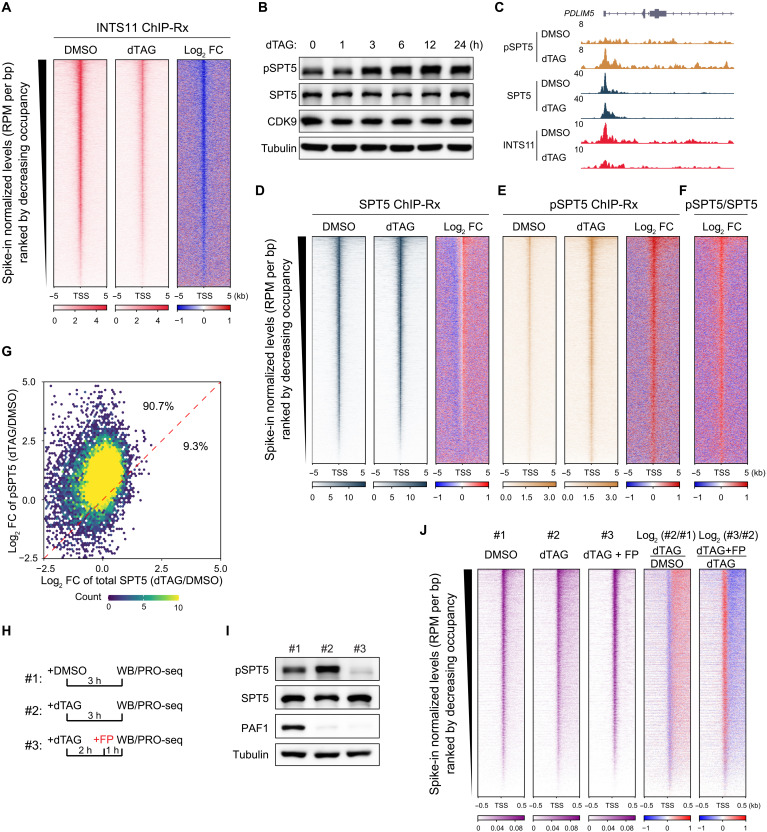
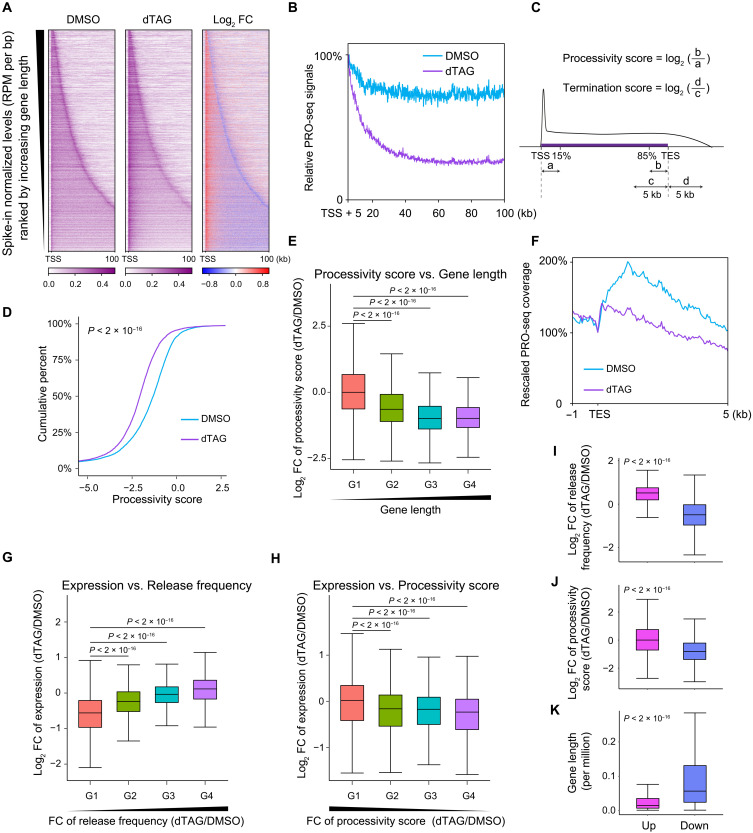
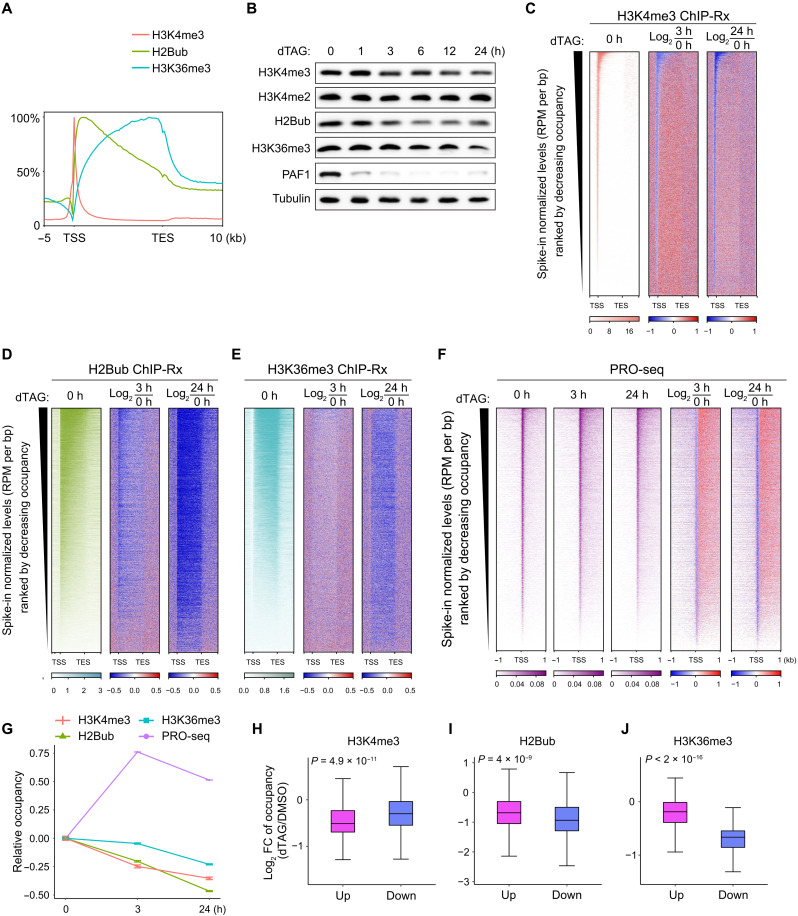
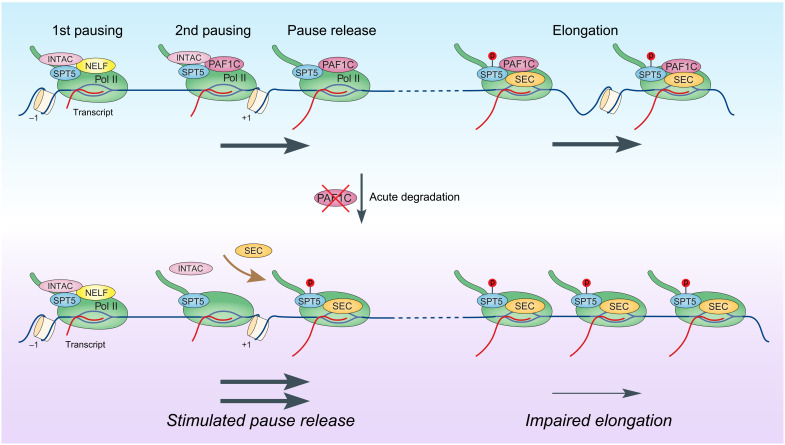
Pleiotropic transcription regulator RNA polymerase II (Pol II)-associated factor 1 (PAF1) governs multiple transcriptional steps and the deposition of several epigenetic marks. However, it remains unclear how ultimate transcriptional outcome is determined by PAF1 and whether it relates to PAF1-controlled epigenetic marks. We use rapid degradation systems and reveal direct PAF1 functions in governing pausing partially by recruiting Integrator-PP2A (INTAC), in addition to ensuring elongation. Following acute PAF1 degradation, most destabilized polymerase undergoes effective release, which presumably relies on skewed balance between INTAC and P-TEFb, resulting in hyperphosphorylated substrates including SPT5. Impaired Pol II progression during elongation, along with altered pause release frequency, determines the final transcriptional outputs. Moreover, PAF1 degradation causes a cumulative decline in histone modifications. These epigenetic alterations in chromatin likely further influence the production of transcripts from PAF1 target genes.


Figures

Fig. 1.
Fig. 1.. Acute PAF1 degradation compromises PAF1C stability and induces the redistribution of transcriptionally engaged Pol II.
(A) Schematic of the generation of PAF1-dTAG DLD-1 cells. (B) Western blotting of whole-cell extracts of PAF1-dTAG or parental DLD-1 cells treated with DMSO or 100 nM dTAG for 3 hours. Tubulin is a loading control. (C) Western blotting of PAF1-dTAG cells with time-course treatment of 100 nM dTAG. (D and E) Heatmaps of PAF1 (D) and LEO1 (E) occupancy [reads per million mapped reads (RPM) per bp, log2 fold change of dTAG versus DMSO] measured by ChIP-Rx in PAF1-dTAG cells treated with DMSO or 100 nM dTAG for 3 hours. The plots were generated by rep1 data and verified by ChIP-qPCR. See tables S1 and S2 for detailed dataset information. (F) Two-dimensional density plot showing log2 fold change (dTAG versus DMSO) of PAF1 occupancy (x axis) and LEO1 occupancy (y axis) in PAF1-dTAG cells treated with DMSO or dTAG. The plot was generated by rep1 data and verified by ChIP-qPCR. (G) Heatmaps of PRO-seq signals (RPM per bp, log2 fold change of dTAG versus DMSO) for sense transcription in PAF1-dTAG cells treated with DMSO or dTAG. The plot was generated by two replicates. (H) Two-dimensional density plot showing log2 fold change (dTAG versus DMSO) of PRO-seq signals at promoters (x axis) and early gene body regions (100 to 1000 bp) (y axis) in PAF1-dTAG cells treated with DMSO or dTAG. The plot was generated by two replicates. (I) Heatmaps of PRO-seq signals (RPM per bp, log2 fold change of dTAG versus DMSO) for antisense transcription in PAF1-dTAG cells treated with DMSO or dTAG. The plot was generated by two replicates.
Fig. 2.
Fig. 2.. PAF1 regulates pausing duration and release frequency and directly interacts with INTAC.
(A) The comparison of PRO-seq signals within pausing window between DMSO- and dTAG-treated cells. The plot was generated by two replicates. (B) Schematic showing the two fates following promoter-proximal Pol II pausing. (C) Heatmaps showing log2 fold change of TT-seq signals within the 10-kb window (dTAG versus DMSO) in PAF1-dTAG cells. The plot was generated by rep1 data. (D) The purified PAF1C, INTAC, and NELF complexes were subjected to SDS–polyacrylamide gel electrophoresis (SDS-PAGE) followed by Coomassie blue staining. (E and F) In vitro pull-down assays using immobilized PAF1C as the bait incubated with INTAC and/or NELF. The bound proteins were subjected to SDS-PAGE followed by Coomassie blue staining (E) and Western blotting (F). (G) Co-IP of endogenous PAF1 followed by Western blotting. (H) Gradient centrifugation using purified PAF1C alone (top) or PAF1C incubated with INTAC (bottom). The fractionated samples were subjected to SDS-PAGE followed by Western blotting. (I) Heatmaps of PRO-seq signals at the second pausing sites in PAF1-dTAG cells treated with DMSO or dTAG. The plot was generated by rep1 data.
Fig. 3.
Fig. 3.. Acute PAF1 loss diminishes INTAC recruitment and perturbs the balance between P-TEFb and INTAC.
(A) Heatmaps of INTS11 occupancy (RPM per bp, log2 fold change) of dTAG versus DMSO measured by ChIP-Rx in PAF1-dTAG cells treated with DMSO or dTAG for 3 hours. The plot was generated by rep1 data and verified by ChIP-qPCR. (B) Western blotting of PAF1-dTAG cells with time-course dTAG treatment. (C) Track examples showing the occupancy of total SPT5, pSPT5, and INTS11 in DMSO or dTAG-treated cells. (D and E) Heatmaps of total SPT5 (D) and pSPT5 occupancy (E) (RPM per bp, log2 fold change of dTAG versus DMSO) in PAF1-dTAG cells treated with DMSO or dTAG. The plots were generated by rep1 data and verified by ChIP-qPCR. (F) Heatmaps showing the ratio of pSPT5 in total SPT5. The plot was generated by rep1 data and verified by ChIP-qPCR (RPM per bp, log2 fold change of dTAG versus DMSO). (G) Two-dimensional density plot showing log2 fold change of total SPT5 (x axis) and pSPT5 (y axis) occupancy in PAF1-dTAG cells treated with DMSO or dTAG. The plot was generated by rep1 data and verified by ChIP-qPCR. (H and I) Schematic (H) and Western blotting (I) of dTAG treatment with or without T-TEFb inhibition by 500 nM flavopiridol (FP). (J) Heatmaps of PRO-seq signals (RPM per bp, log2 fold change) in PAF1-dTAG cells treated with dTAG and/or FP as in (I). The plot was generated by rep1 data.
Fig. 4.
Fig. 4.. Combinatory regulation of pausing and elongation determines transcriptional output of PAF1 targets.
(A) Heatmaps of PRO-seq signals (RPM per bp, log2 fold change of dTAG versus DMSO) in PAF1-dTAG cells treated with DMSO or dTAG for 3 hours. Genes are ranked by increasing gene length. The plot was generated by two replicates. (B) Metaplots of relative PRO-seq signals at gene bodies (5 to 100 kb downstream of TSS) for genes longer than 100 kb in PAF1-dTAG cells treated with DMSO or dTAG. The plot was generated by two replicates. (C) Schematic of processivity score and termination score calculation using PRO-seq signals. (D) Empirical cumulative distribution function plots of the processivity score in PAF1-dTAG cells treated with DMSO or dTAG. The plot was generated by two replicates. (E) Box plots showing the correlation of the log2 fold change of processivity score (dTAG versus DMSO) and gene length (four equal groups based on gene length) in PAF1-dTAG cells treated with DMSO or dTAG. The plot was generated by two replicates. (F) Metaplots of rescaled PRO-seq coverage at termination zone [1 kb upstream to 5 kb downstream of transcription end site (TES)] in PAF1-dTAG cells treated with DMSO or dTAG. The plot was generated by two replicates. (G) Box plots showing the correlation of log2 fold change of expression (dTAG versus DMSO of RNA-seq) and release frequency (four equal groups based on release frequency) in PAF1-dTAG cells treated with DMSO or dTAG. The plot was generated by two replicates of RNA-seq and rep1 data of TT-seq. (H) Box plots showing the correlation of log2 fold change of expression (dTAG versus DMSO of RNA-seq) and processivity score (four equal groups based on release frequency) in PAF1-dTAG cells treated with DMSO or dTAG. The plot was generated by two replicates. (I and J) Box plots showing log2 fold change of release frequency (I) and processivity score (J) (dTAG versus DMSO) for the top 500 up- and down-regulated genes by PAF1 loss. The plots were generated by two replicates of RNA-seq, PRO-seq, and rep1 data of TT-seq. (K) Comparison of gene length between the top 500 up- and down-regulated genes by PAF1 loss. The plot was generated by two replicates.
Fig. 5.
Fig. 5.. Dynamic regulation of histone marks and transcription by PAF1.
(A) Metaplots of H3K4me3, H2Bub, and H3K36me3 occupancy measured by ChIP-Rx in DLD-1 cells. The plot was generated by rep1 data and verified by ChIP-qPCR. (B) Western blotting of PAF1-dTAG cells with time-course dTAG treatment. (C to E) Heatmaps showing the occupancy of H3K4me3 (C), H2Bub (D), and H3K36me3 (E) measured by ChIP-Rx (RPM per bp, log2 fold change) in PAF1-dTAG cells treated with100 nM dTAG for 0, 3, and 24 hours. The plots were generated by rep1 data and verified by ChIP-qPCR. (F) Heatmaps of PRO-seq signals (RPM per bp, log2 fold change) in PAF1-dTAG cells treated with dTAG for 0, 3, and 24 hours. The plot was generated by rep1 data. (G) Relative levels of histone modifications (H3K4me3, H2Bub, H3K36me3) and PRO-seq gene body signals in PAF1-dTAG cells treated with dTAG for 0, 3, and 24 hours. The plot was generated by rep1 data of PRO-seq and ChIP-Rx with verification by ChIP-qPCR. (H to J) Box plots showing log2 fold change of H3K4me3 (H), H2Bub (I), and H3K36me3 (J) (dTAG versus DMSO) for the top 500 up- and down-regulated genes by PAF1 loss. The plots were generated by two replicates of RNA-seq and rep1 data of ChIP-Rx with verification by ChIP-qPCR.
Fig. 6.
Fig. 6.. Schematic of functions of PAF1 in regulating pausing and elongation.
Acute depletion of PAF1 leads to destabilization of paused Pol II, most of which undergoes effective pause release presumably driven by decreased INTAC occupancy and thus skewed INTAC–P-TEFb balance. The widespread defects in elongation upon PAF1 loss, along with changed release frequency of paused Pol II, collectively shape the ultimate transcriptional output of PAF1 target genes.

Similar articles

Cited by

References

    1. Jonkers I., Lis J. T., Getting up to speed with transcription elongation by RNA polymerase II. Nat. Rev. Mol. Cell Biol. 16, 167–177 (2015). - PMC - PubMed
    1. Chen F. X., Smith E. R., Shilatifard A., Born to run: Control of transcription elongation by RNA polymerase II. Nat. Rev. Mol. Cell Biol. 19, 464–478 (2018). - PubMed
    1. Core L., Adelman K., Promoter-proximal pausing of RNA polymerase II: A nexus of gene regulation. Genes Dev. 33, 960–982 (2019). - PMC - PubMed
    1. Cramer P., Organization and regulation of gene transcription. Nature 573, 45–54 (2019). - PubMed
    1. Noe Gonzalez M., Blears D., Svejstrup J. Q., Causes and consequences of RNA polymerase II stalling during transcript elongation. Nat. Rev. Mol. Cell Biol. 22, 3–21 (2021). - PubMed