. 2022 Apr;8(13):eabm0320.
doi: 10.1126/sciadv.abm0320. Epub 2022 Apr 1.

Climate change increases risk of extreme rainfall following wildfire in the western United States

Affiliations

Climate change increases risk of extreme rainfall following wildfire in the western United States

Danielle Touma et al. Sci Adv. 2022 Apr.

Abstract

Post-wildfire extreme rainfall events can have destructive impacts in the western United States. Using two climate model large ensembles, we assess the future risk of extreme fire weather events being followed by extreme rainfall in this region. By mid-21st century, in a high warming scenario (RCP8.5), we report large increases in the number of extreme fire weather events followed within 1 year by at least one extreme rainfall event. By 2100, the frequency of these compound events increases by 100% in California and 700% in the Pacific Northwest in the Community Earth System Model v1 Large Ensemble. We further project that more than 90% of extreme fire weather events in California, Colorado, and the Pacific Northwest will be followed by at least three spatially colocated extreme rainfall events within five years. Our results point to a future with substantially increased post-fire hydrologic risks across much of the western United States.


Figures

Fig. 1.
Fig. 1.. Change in the annual frequency of extreme fire weather (FWI99.9) and extreme rainfall (R99.9) events using CESM1-LE.
Ensemble mean percent change in annual frequency of FWI99.9 (A and C) and R99.9 (D to F) in 2006–2040 (A and D), 2041–2070 (B and E), and 2071–2100 (C and F) relative to the historic (1980–2005) frequency. Consecutive days that exceed the FWI99.9 threshold are considered as one event, dated on the first consecutive day. Gray areas are locations where fewer than two-thirds of the ensemble members agree on the sign of change, and gray stippling shows locations that do not have significant (P > 0.05) differences in the ensemble distribution of frequency compared to 1980–2005 calculated using the Kolmogorov-Smirnov (KS) test. If both cases are true, the grid box will be shaded gray. White areas are desert, ocean, or surface water. (Results for CanESM2, CSIRO-Mk3-6-0, EC-Earth, and GFDL-CM3 are shown in figs. S1 and S3.)
Fig. 2.
Fig. 2.. Joint frequency of extreme rainfall and extreme fire weather events using CESM1-LE.
Distributions of changes in the annual frequency of R99.9 (y axis) and FWI99.9 (x axis) events for 2006–2040, 2041–2070, and 2071–2100 for (A) California, (B) Colorado, and (C) PNW. Each data point indicates the change in an individual ensemble member. The gray horizontal and vertical bands show the minimum and maximum boundaries of the ensemble 1980–2005 variability. The regional annual frequency is calculated by averaging the frequency of R99.9 and FWI99.9 over all grid points in the region for each year and each ensemble member. Consecutive days that exceed the FWI99.9 threshold are considered as one event, dated on the first consecutive day.
Fig. 3.
Fig. 3.. Historical and future frequency of extreme rainfall, extreme fire weather, and temporally compounding events using CESM1-LE.
Thirty-year moving average of annual frequency per 105 km2 of (A) extreme fire weather (FWI99.9) events, (B) extreme rainfall events (R99.9), (C) FWI99.9 events that are followed by R99.9 within 1 year, and (D) R99.9 events that follow FWI99.9 events within 1 year from 1935 to 2085 for California (red dashed line), Colorado (blue dotted line), and the PNW (green solid line). (E) The fraction of FWI99.9 events that are followed by R99.9 events and (F) the fraction of R99.9 events for that occur 1 year after an FWI99.9 event within 1 year from 1935 to 2085 for California, Colorado, and PNW. Regional averages are calculated for the region boundaries shown in Fig. 1 and normalized by the total area of the state—for reference, California is approximately 420,000 km2. The lines represent the ensemble mean, and the shading is ±1 SD of the 30-year moving average ensemble spread. (Results for CanESM2, CSIRO-Mk3-6-0, EC-Earth, and GFDL-CM3 are shown in figs. S2 and S4.)
Fig. 4.
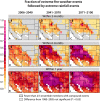
Fig. 4.. If an extreme fire weather event occurs, what fraction are followed by extreme rainfall on subannual time frames using CESM1-LE?
Fraction of extreme fire weather events (FWI99.9) followed by extreme rainfall events (R99.9) within (A to C) 3 months, (D to F) 6 months, and (G to I) 1 year in 2006–2040 (A, D, and G), 2041–2070 (B, E, and H), and 2071–2100 (C, F, and I). Consecutive days that exceed the FWI99.9 threshold are considered as one event, dated on the first consecutive day. Gray areas show where fewer than two-thirds of the ensemble members show at least one compound event occurring. Stippled regions do not have significant (P > 0.05) differences in the ensemble distribution of likelihood compared to 1980–2005 (shown in fig. S5) calculated using the KS test. White areas are desert, ocean, or surface water. (Results for CanESM2 are shown in fig. S6.)
Fig. 5.
Fig. 5.. Frequency of extreme fire weather events that are followed by extreme rainfall events using CESM1-LE.
The number of compound events per year per grid point that occur within (A to C) 3 months, (D to F) 6 months, and (G to I) 1 year in 2006–2040 (A, D, and G), 2041–2070 (B, E, and H), and 2071–2100 (C, F, and I). Consecutive days that exceed the FWI99.9 threshold are considered as one event, dated on the first consecutive day. Gray areas show where fewer than two-thirds of the ensemble members show at least one compound event occurring. Stippled regions do not have significant (P > 0.05) differences in the ensemble distribution of the annual frequency compared to 1980–2005 (shown in fig. S5) calculated using the KS test. White areas are desert, ocean, or surface water. (Results for CanESM2 are shown in fig. S7.)
Fig. 6.
Fig. 6.. Seasonality of changes in extreme rainfall, extreme fire weather, and subannual compounding events using CESM1-LE.
(A, C, and E) Ensemble average change in the annual frequency of extreme rainfall events (R99.9, left axis, solid blues) and extreme fire weather events (FWI99.9, right axis, dashed reds) per 105 km2 between 1980–2005 and 2006–2040 (light hues), 2041–2070 (medium hues), and 2071–2100 (dark hues) in (A) California, (C) Colorado, and (E) the PNW. A 15-day moving window is used to average values on a given day. (B, D, and F) Ensemble average change in the annual number of R99.9 events that occur 3 months (dark teal), 6 months (light teal), and 12 months (pale turquoise) after an FWI99.9 event for each month per 105 km2 in (B) California, (D) Colorado, and (F) the PNW. The bars show the ensemble average of the change in 2006–2040, 2041–2070, and 2071–2100 from left to right, respectively, compared to 1980–2005. The 6-month events are shown as a subset of the 12-month events, and the 3-month events are shown as a subset of the 6-month events. For reference, California is approximately 420,000 km2.
Fig. 7.
Fig. 7.. How many extreme fire weather events are followed by extreme rainfall using CESM1-LE?
(A, D, and G) Annual frequency per 105 km2 of extreme fire weather (FWI99.9) events followed by extreme rainfall (R99.9) events, (B, E, and H) fraction of FWI99.9 events followed by R99.9 events, and (C, F, and I) number of R99.9 events that follow FWI99.9 events within (A to C) 6 months, (D to F) 1 year, and (G to I) 5 years in 1980–2005 (gray), 2006–2040 (peach), 2041–2070 (orange), and 2071–2100 (red) for California, Colorado, and the PNW. The box boundary represents the interquartile range (IQR) across the ensemble, the horizontal line in the box represents the median of the ensemble, and the tails are approximately three times the IQR. The light gray boundaries of boxes show that the ensemble distribution is not significantly different (P > 0.01) than the historic period calculated using the KS test.

References

    1. Kean J. W., Staley D. M., Forecasting the frequency and magnitude of postfire debris flows across Southern California. Earths Future 9, e2020EF001735 (2021).
    1. Ebel B. A., Martin D. A., Meta-analysis of field-saturated hydraulic conductivity recovery following wildland fire: Applications for hydrologic model parameterization and resilience assessment. Hydrol. Process. 31, 3682–3696 (2017).
    1. Oakley N. S., Cannon F., Munroe R., Lancaster J. T., Gomberg D., Martin Ralph F., Brief communication: Meteorological and climatological conditions associated with the 9 January 2018 post-fire debris flows in Montecito and Carpinteria, California, USA. Nat. Hazards Earth Syst. Sci. 18, 3037–3043 (2018).
    1. J. Kershner, Carlton Complex Fire. HistoryLink.org (2014); www.historylink.org/File/10989.
    1. D. M. Staley, E. G. Joseph, J. W. Kean, Objective definition of rainfall intensity- duration thresholds for post-fire flash floods and debris flows in the area burned by the Waldo Canyon fire, Colorado, USA, in Engineering Geology for Society and Territory—Volume 2: Landslide Processes, G. Lollino, D. Giordan, G. B. Crosta, J. Corominas, R. Azzam, J. Wasowski, N. Sciarra, Eds. (Springer International Publishing, 2015), vol. 2, pp. 621–624.