. 2022 Apr 5;119(14):e2119671119.
doi: 10.1073/pnas.2119671119. Epub 2022 Apr 1.

Layered evolution of gene expression in "superfast" muscles for courtship

Affiliations

Layered evolution of gene expression in "superfast" muscles for courtship

James B Pease et al. Proc Natl Acad Sci U S A. .

Abstract

Identifying the molecular process of complex trait evolution is a core goal of biology. However, pinpointing the specific context and timing of trait-associated changes within the molecular evolutionary history of an organism remains an elusive goal. We study this topic by exploring the molecular basis of elaborate courtship evolution, which represents an extraordinary example of trait innovation. Within the behaviorally diverse radiation of Central and South American manakin birds, species from two separate lineages beat their wings together using specialized “superfast” muscles to generate a “snap” that helps attract mates. Here, we develop an empirical approach to analyze phylogenetic lineage-specific shifts in gene expression in the key snap-performing muscle and then integrate these findings with comparative transcriptomic sequence analysis. We find that rapid wing displays are associated with changes to a wide range of molecular processes that underlie extreme muscle performance, including changes to calcium trafficking, myocyte homeostasis and metabolism, and hormone action. We furthermore show that these changes occur gradually in a layered manner across the species history, wherein which ancestral genetic changes to many of these molecular systems are built upon by later species-specific shifts that likely finalized the process of display performance adaptation. Our study demonstrates the potential for combining phylogenetic modeling of tissue-specific gene expression shifts with phylogenetic analysis of lineage-specific sequence changes to reveal holistic evolutionary histories of complex traits.

Keywords: behavioral physiology; manakin; molecular evolution; phylogenomics; transcriptomics.


Conflict of interest statement

The authors declare no competing interest.

Figures
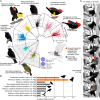
Fig. 1.
Fig. 1.
Comparison of SH-PEC muscle tissue differential gene expression in manakin species. (A) The three species with rapid wing-snaps (orange starbursts; C. cornuta [Cc], C. mentalis [Cm], M. vitellinus [Mv]) and their two closest relatives in the M5 clade (L. coronata [Lc] and P. pipra [Pp]) have more differentially expressed genes between the SH and PEC muscles compared to more distant relatives (X. atronitens [Xa] and M. oleaginous [Mo]). Points increase in size with distance from the origin for emphasis of highly differentially expressed genes. The M5 clade contains the vast majority of differentially expressed genes at both P < 10−5 (dashed line) and P < 0.01 (pie charts). Illustrations by J.B.P. (B) The maximum wingbeat frequencies for the SH-based displays (orange) in M. vitellinus and C. mentalis are up to twice as fast as the maximum PEC wingbeat (gray) in M. vitellinus and other birds of similar size (body weight ranges given in parentheses; see SI Appendix, Table S2 for sources). (C) Time series of still frames from a high-speed video of M. vitellinus showing rapid wing motion behavior with orange bursts added to highlight wing snaps ∼18 ms apart. Original video by L. Fusani and B. A. Schlinger (9).
Fig. 2.
Fig. 2.
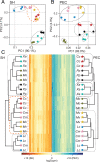
Species with rapid wing movements cluster in SH, but not PEC expression profiles. (A and B) PC analysis of expression levels across all genes in the SH and PEC tissues shows that individuals from snap-performing species (stars) and nonsnap species (circles) form a cluster in SH but not PEC. Dashed circles show clusters. (C) SH (orange, Left) and PEC (Right, blue) expression levels for genes for each of the 21 individuals. A clustering topology is shown for each tissue based on their cpm expression values with k groups shown (dotted boxes). Abbreviations: Cc, Ceratopipra cornuta; Cm, Ceratopipra mentalis; Lc, Lepidothrix coronata; Mo, Mionectes oleaginous; Mv, Manacus vitellinus; Pp, Pseudopipra pipra; Xa, Xenopipo atronitens.
Fig. 3.
Fig. 3.
Layered evolution of gene expression in manakins. (A) PhyDGET detects genes with branch-specific shifts in expression level by comparing alternative models where target branches can have a faster rate of change in expression level against a null model where expression levels change under a single rate category for all branches. Many genes show significantly improved alternative model fit (BF ≥ 1.5) for expression levels in the SH muscle (blue), PEC (green), or both (magenta). (B) Seven focal alternative models are shown with target branches highlighted, underneath which are example gene expression profiles showing cpm reads in SH and PEC. The mean value (horizontal line), ± SE (shaded box), and individual data points (open circles), and BF values (corner numbers) are shown for each species. Below those, a plot shows PEC and SH BF scores for each gene (with the example gene circled), and gene counts for each quadrant in the corners. (C) Several genes for each model show strong shifts in expression, high peak expression levels, and function related to enhanced muscle contraction–relaxation. Signs before the gene names indicate increase (+) or decrease (−) in expression for the target branches. Square brackets indicate BF was between 0.3 and the 1.5 threshold, but the gene has a known role in muscle contraction. An asterix (*) indicates genes with substantially stronger BF in the SH over PEC. Subscript L (L) indicates genes not reference-annotated as a consensus vertebrate gene symbol but are a “-like” nearest-match paralog.
Fig. 4.
Fig. 4.
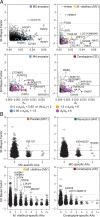
Gene sequence changes and SH expression changes are not positively correlated. (A) Comparison of branch-specific positive selection on gene sequences (dN and dN/dS from PAML) and branch-specific shift in gene expression (BF from PhyDGET) for 8,809 genes in SH (Left) and PEC (Right) muscles. Shift in expression and positive selection on sequence are uncorrelated, consistent with a model of sequence shifts in regulators creating expression changes separately in their target molecules. (B) Counts of amino acids (AAs) per gene for specific taxa compared to changes in expression level (BF) for the SH show that, even with a nonphylogenetic measure of amino acid change that ignores gene length, changes in sequence and changes in expression are not positively correlated. Normally distributed “jitter” was added to x coordinates to show the BF-frequency distribution.

References

    1. Colosimo P. F., et al. , Widespread parallel evolution in sticklebacks by repeated fixation of ectodysplasin alleles. Science 307, 1928–1933 (2005). - PubMed
    1. Jarvis E. D., et al. , Whole-genome analyses resolve early branches in the tree of life of modern birds. Science 346, 1320–1331 (2014). - PMC - PubMed
    1. Lamichhaney S., et al. , Evolution of Darwin’s finches and their beaks revealed by genome sequencing. Nature 518, 371–375 (2015). - PubMed
    1. Fontaine M. C., et al. , Mosquito genomics. Extensive introgression in a malaria vector species complex revealed by phylogenomics. Science 347, 1258524 (2015). - PMC - PubMed
    1. Pease J. B., Haak D. C., Hahn M. W., Moyle L. C., Phylogenomics reveals three sources of adaptive variation during a rapid radiation. PLoS Biol. 14, e1002379 (2016). - PMC - PubMed

LinkOut - more resources