. 2022 Apr 5;119(14):e2111786119.
doi: 10.1073/pnas.2111786119. Epub 2022 Apr 1.

Matrix Inversion and Subset Selection (MISS): A pipeline for mapping of diverse cell types across the murine brain

Affiliations

Matrix Inversion and Subset Selection (MISS): A pipeline for mapping of diverse cell types across the murine brain

Christopher Mezias et al. Proc Natl Acad Sci U S A. .

Abstract

The advent of increasingly sophisticated imaging platforms has allowed for the visualization of the murine nervous system at single-cell resolution. However, current experimental approaches have not yet produced whole-brain maps of a comprehensive set of neuronal and nonneuronal types that approaches the cellular diversity of the mammalian cortex. Here, we aim to fill in this gap in knowledge with an open-source computational pipeline, Matrix Inversion and Subset Selection (MISS), that can infer quantitatively validated distributions of diverse collections of neural cell types at 200-μm resolution using a combination of single-cell RNA sequencing (RNAseq) and in situ hybridization datasets. We rigorously demonstrate the accuracy of MISS against literature expectations. Importantly, we show that gene subset selection, a procedure by which we filter out low-information genes prior to performing deconvolution, is a critical preprocessing step that distinguishes MISS from its predecessors and facilitates the production of cell-type maps with significantly higher accuracy. We also show that MISS is generalizable by generating high-quality cell-type maps from a second independently curated single-cell RNAseq dataset. Together, our results illustrate the viability of computational approaches for determining the spatial distributions of a wide variety of cell types from genetic data alone.

Keywords: cell-type maps; deconvolution; neuroanatomy; transcriptomics.


Conflict of interest statement

The authors declare no competing interest.

Figures
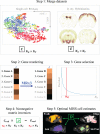
Fig. 1.
Fig. 1.
A visual outline of the MISS pipeline for mapping cell-type clusters. Step 1 consists of finding appropriate scRNAseq cell cluster expression data and combining the data with spatial gene expression data, such as the AIBS gene expression atlas (23) used here. In step 2, the MRx3 algorithm (Algorithm) posed here is used to reorder the genes according to information content relevant to the mapping problem at hand. Step 3 chooses a cutoff point in the reordered gene list, and only genes ranked at or above the selected index value, nG, are used for inversion. This subset selection is accomplished by plotting subset size vs. the residual and then choosing an elbow, defined as the point on the curve closest to the origin. The inversion using only the chosen genes and the MISS-inferred maps produced are steps 4 and 5, respectively.
Fig. 2.
Fig. 2.
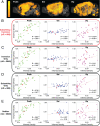
Matrix inversion after MRx3 gene subset selection produces Pvalb+, Sst+, and Vip+ generally outperforms inversion without subset selection and correlation-based mapping. (A) Sagittal axis views of whole-brain MISS maps of Pvalb+, Sst+, and Vip+ interneurons in the mouse CCF (26). Scatterplots depicting correlations between empirical measurements of Pvalb+, Sst+, and Vip+ interneuron densities across neocortical regions (7) and (B) MISS estimates, (C) matrix inversion without gene subsetting, (D) correlation-based mapping using the chosen MRx3 gene subset, and (E) correlation-based mapping using all the genes. Red asterisks indicate sampled regions in the scRNAseq dataset (12). *P < 0.05; **P < 0.01; ***P < 0.001.
Fig. 3.
Fig. 3.
MISS with MRx3 produces laminar glutamatergic projection neuron maps that generally outperform those produced with inversion without gene subset selection and correlation-based maps. (A) The τadj value for MISS projection neuron maps (Left) is better than inversion using all available genes (Center) as well as correlation-based mapping using the MRx3-based subset (Right). In general, the MISS maps produce clear bands for each projection neuron class in the appropriate cortical layer, which are less clear the correlation-based maps, while there is more significant off-target signal when there is no prior gene subset selection. (B) Within a range of about 100 genes on either side of the chosen elbow, both the interneuron R values and the laminar excitatory neuron ordering metric τadj jointly achieve peak or close to peak performance, indicating that the elbow of the residual curve is a suitable ground-truth–independent metric on which we choose gene subset size, nG.
Fig. 4.
Fig. 4.
MISS facilitates the spatial characterization of cell types with unclear functional annotations. (A) Axial and sagittal views of the LGd-derived glutamatergic neuron, Slc17a6, with pronounced and specific localization in caudal thalamic nuclei. (B) Regions most enriched in Slc17a6 neurons (red spheres) connect most strongly with neocortical regions in both outgoing (yellow spheres) and incoming (green spheres) directions, suggesting that its functionality is likely in constructing or maintaining thalamocortical loops. (C) Axial and sagittal views of Gad1 and Gad2 expression from the AGEA (23), showing that GABAergic neurons are widely distributed throughout the mouse brain. (D) The GABAergic neuron, Meis2, in contrast to Gad1 and Gad2 is almost exclusively limited to olfactory areas, parts of the pallidum and amygdala, and several neocortical regions.
Fig. 5.
Fig. 5.
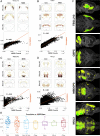
MISS maps of cell classes using data from a more widely sampled scRNAseq dataset with 200 cell classes sampled from a more comprehensive set of brain regions (8) produce maps that agree with those produced by the original authors. We show comparisons between the two approaches for four distinct cell types: (A) TEGLU12, (B) CBPC (cerebellar Purkinje neurons), (C) MBDOP2, and (D) MOL3. There is strong visual agreement between the approach taken by Zeisel et al. (8) and MISS throughout the brain (Left and Right, respectively, in A–D) as well as strong quantitative agreement at a per-voxel level (scatterplots). Further, the neuronal cell types exhibit enrichment within the regions from which they were sampled. (E) Box plots of correlations between the two approaches per cell type grouped by major cell class. The overall mean and median R values across all 200 cell classes from Zeisel et al. (8) were 0.54 and 0.56, respectively.(F) Axial and sagittal views of the MISS maps of each of the cell types in BE. Glut. - glutamatergic; GABA - GABAergic; Nmd. & Pep. - neuromodulatory and peptidergic; Oligo. - oligodendrocytes; Astro. - astrocytes; Micro. - microglia.

Similar articles

  • Computational solutions for spatial transcriptomics.
    Kleino I, Frolovaitė P, Suomi T, Elo LL. Kleino I, et al. Comput Struct Biotechnol J. 2022 Sep 1;20:4870-4884. doi: 10.1016/j.csbj.2022.08.043. eCollection 2022. Comput Struct Biotechnol J. 2022. PMID: 36147664 Free PMC article. Review.
  • DNA methylation atlas of the mouse brain at single-cell resolution.
    Liu H, Zhou J, Tian W, Luo C, Bartlett A, Aldridge A, Lucero J, Osteen JK, Nery JR, Chen H, Rivkin A, Castanon RG, Clock B, Li YE, Hou X, Poirion OB, Preissl S, Pinto-Duarte A, O'Connor C, Boggeman L, Fitzpatrick C, Nunn M, Mukamel EA, Zhang Z, Callaway EM, Ren B, Dixon JR, Behrens MM, Ecker JR. Liu H, et al. Nature. 2021 Oct;598(7879):120-128. doi: 10.1038/s41586-020-03182-8. Epub 2021 Oct 6. Nature. 2021. PMID: 34616061 Free PMC article.
  • Morphological diversity of single neurons in molecularly defined cell types.
    Peng H, Xie P, Liu L, Kuang X, Wang Y, Qu L, Gong H, Jiang S, Li A, Ruan Z, Ding L, Yao Z, Chen C, Chen M, Daigle TL, Dalley R, Ding Z, Duan Y, Feiner A, He P, Hill C, Hirokawa KE, Hong G, Huang L, Kebede S, Kuo HC, Larsen R, Lesnar P, Li L, Li Q, Li X, Li Y, Li Y, Liu A, Lu D, Mok S, Ng L, Nguyen TN, Ouyang Q, Pan J, Shen E, Song Y, Sunkin SM, Tasic B, Veldman MB, Wakeman W, Wan W, Wang P, Wang Q, Wang T, Wang Y, Xiong F, Xiong W, Xu W, Ye M, Yin L, Yu Y, Yuan J, Yuan J, Yun Z, Zeng S, Zhang S, Zhao S, Zhao Z, Zhou Z, Huang ZJ, Esposito L, Hawrylycz MJ, Sorensen SA, Yang XW, Zheng Y, Gu Z, Xie W, Koch C, Luo Q, Harris JA, Wang Y, Zeng H. Peng H, et al. Nature. 2021 Oct;598(7879):174-181. doi: 10.1038/s41586-021-03941-1. Epub 2021 Oct 6. Nature. 2021. PMID: 34616072 Free PMC article.
  • EASI-FISH for thick tissue defines lateral hypothalamus spatio-molecular organization.
    Wang Y, Eddison M, Fleishman G, Weigert M, Xu S, Wang T, Rokicki K, Goina C, Henry FE, Lemire AL, Schmidt U, Yang H, Svoboda K, Myers EW, Saalfeld S, Korff W, Sternson SM, Tillberg PW. Wang Y, et al. Cell. 2021 Dec 22;184(26):6361-6377.e24. doi: 10.1016/j.cell.2021.11.024. Epub 2021 Dec 6. Cell. 2021. PMID: 34875226
  • Methods and tools for spatial mapping of single-cell RNAseq clusters in Drosophila.
    Mohr SE, Tattikota SG, Xu J, Zirin J, Hu Y, Perrimon N. Mohr SE, et al. Genetics. 2021 Apr 15;217(4):iyab019. doi: 10.1093/genetics/iyab019. Genetics. 2021. PMID: 33713129 Free PMC article. Review.

Cited by

References

    1. Fu H., Hardy J., Duff K. E., Selective vulnerability in neurodegenerative diseases. Nat. Neurosci. 21, 1350–1358 (2018). - PMC - PubMed
    1. Fu H., et al. , A tau homeostasis signature is linked with the cellular and regional vulnerability of excitatory neurons to tau pathology. Nat. Neurosci. 22, 47–56 (2019). - PMC - PubMed
    1. Arneson D., et al. , Single cell molecular alterations reveal target cells and pathways of concussive brain injury. Nat. Commun. 9, 3894 (2018). - PMC - PubMed
    1. Skene N. G., et al. , Major Depressive Disorder Working Group of the Psychiatric Genomics Consortium, Genetic identification of brain cell types underlying schizophrenia. Nat. Genet. 50, 825–833 (2018). - PMC - PubMed
    1. Rama Rao K. V., et al. , A single primary blast-induced traumatic brain injury in a rodent model causes cell-type dependent increase in nicotinamide adenine dinucleotide phosphate oxidase isoforms in vulnerable brain regions. J. Neurotrauma 35, 2077–2090 (2018). - PMC - PubMed