. 2022 Apr 5;119(14):e2121133119.
doi: 10.1073/pnas.2121133119. Epub 2022 Apr 1.

Protective role of chaperone-mediated autophagy against atherosclerosis

Affiliations

Protective role of chaperone-mediated autophagy against atherosclerosis

Julio Madrigal-Matute et al. Proc Natl Acad Sci U S A. .

Abstract

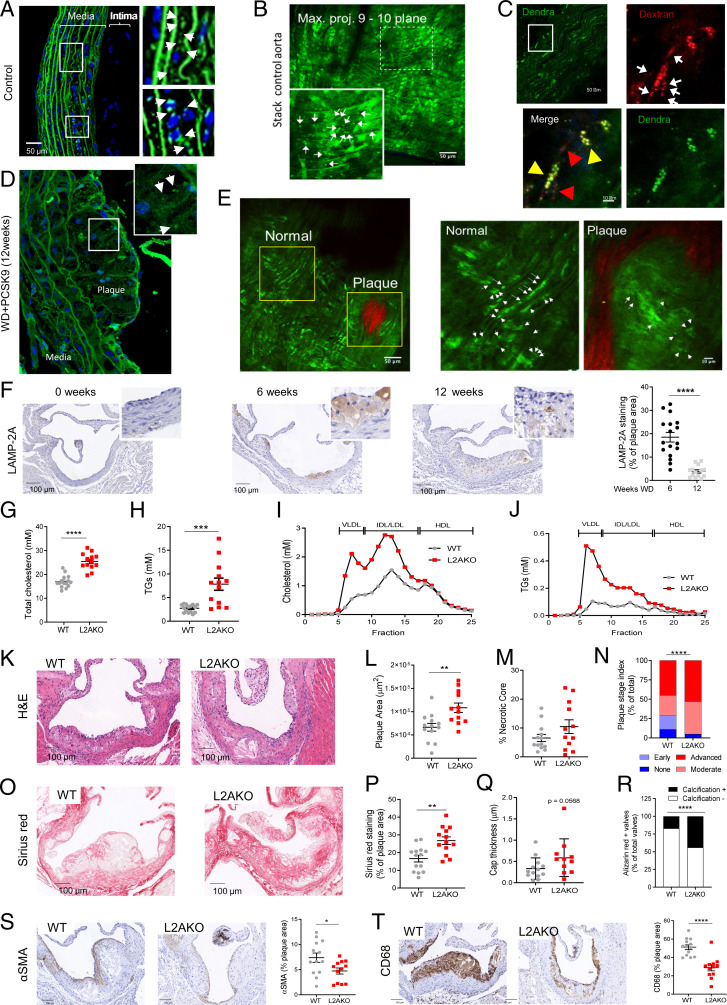
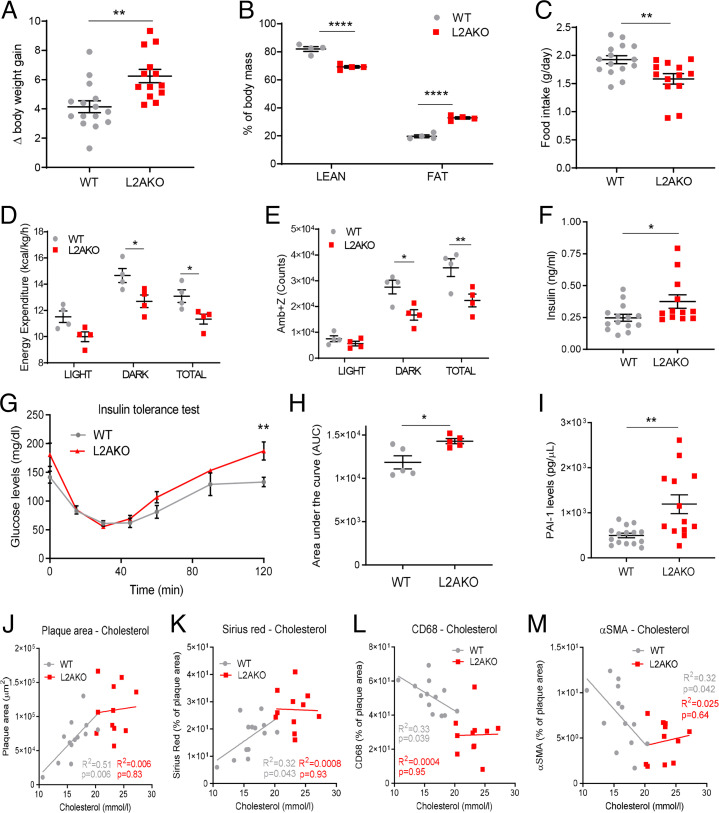
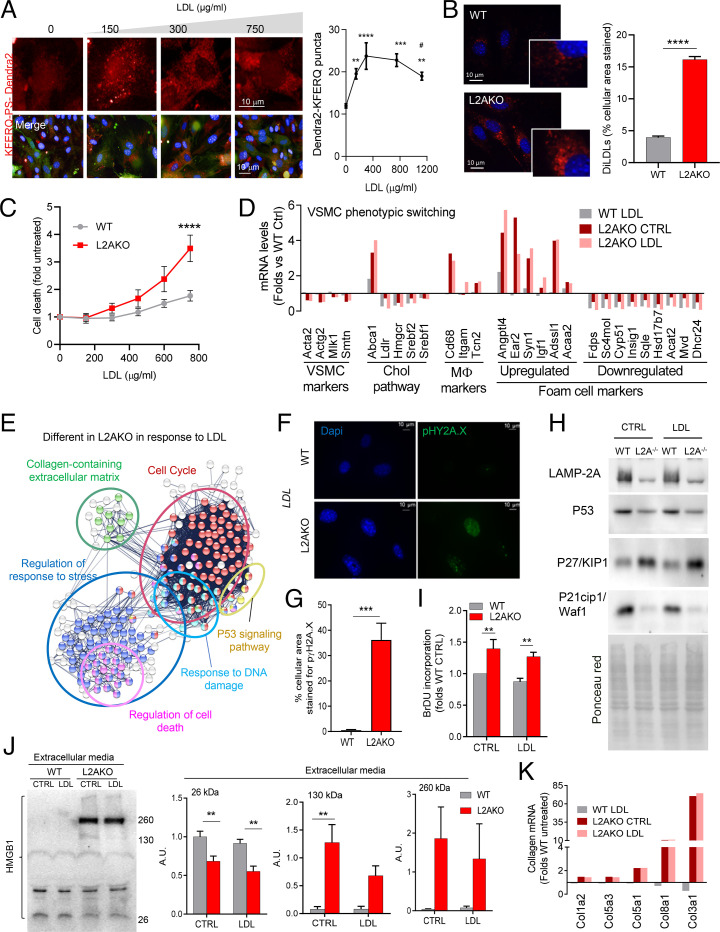
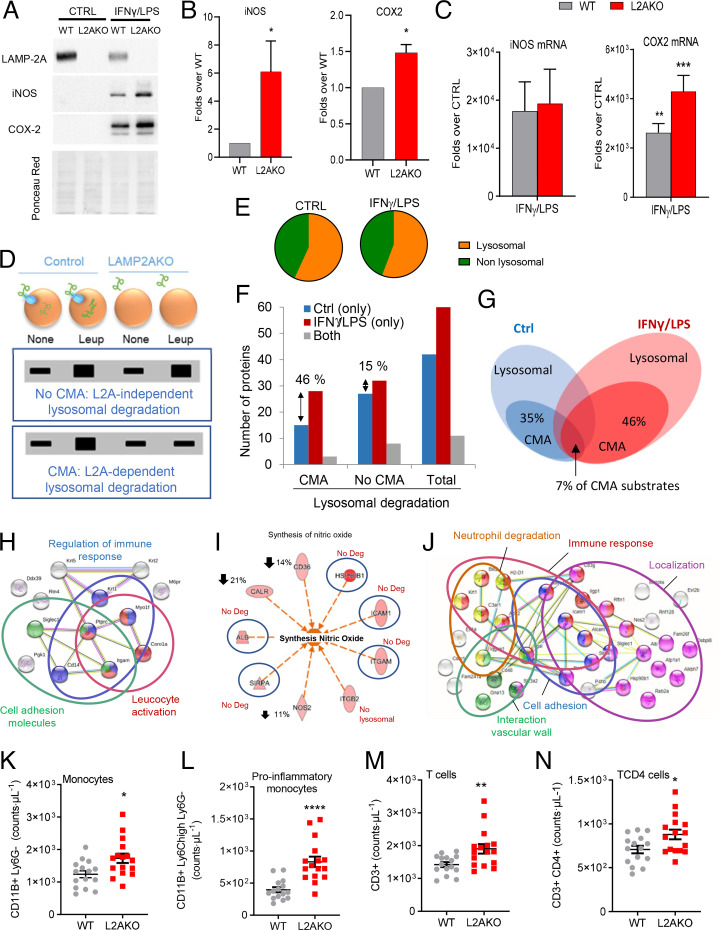
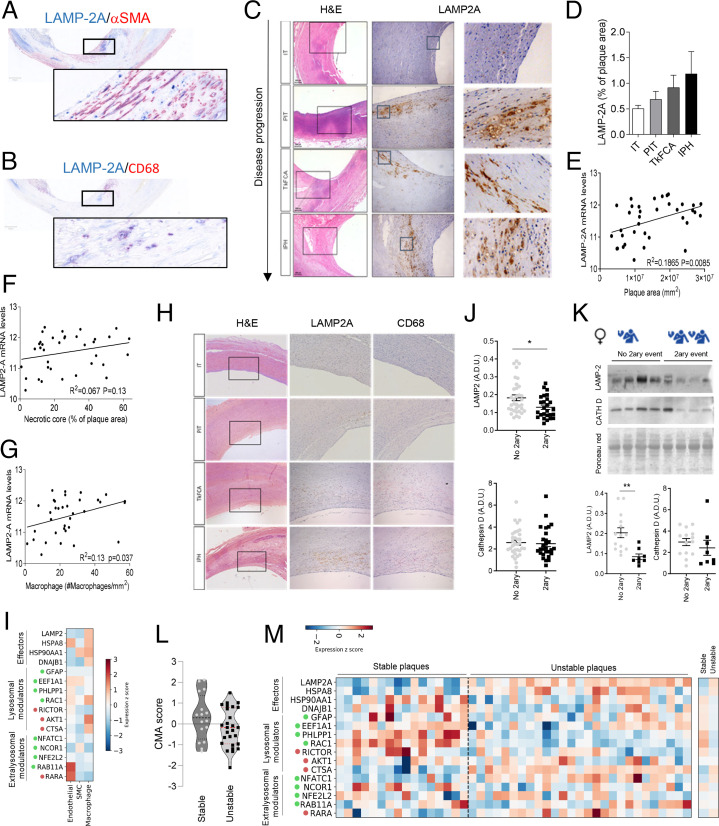
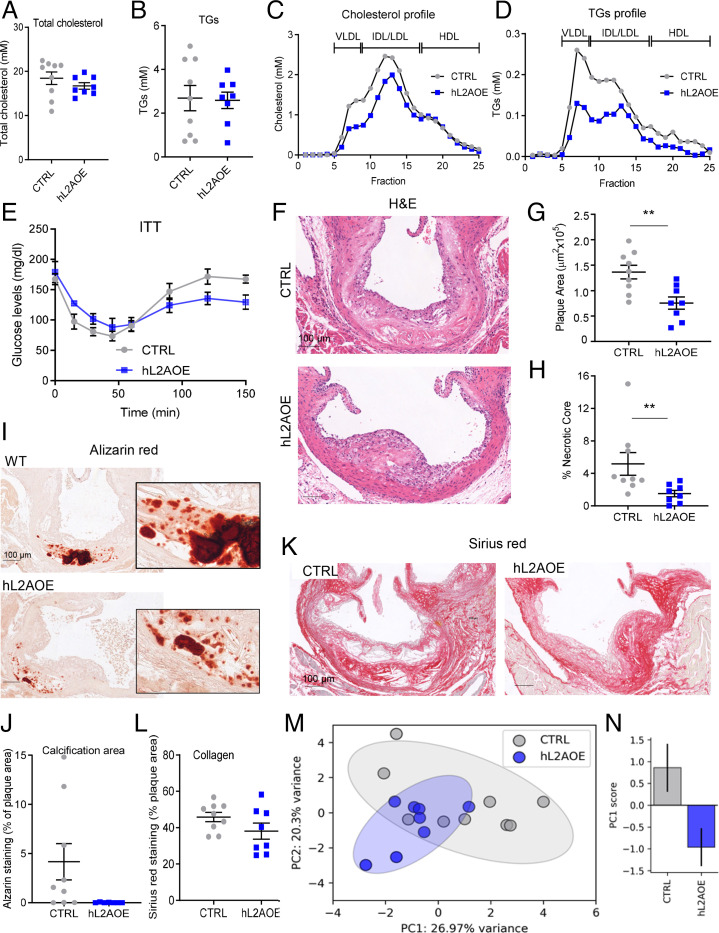
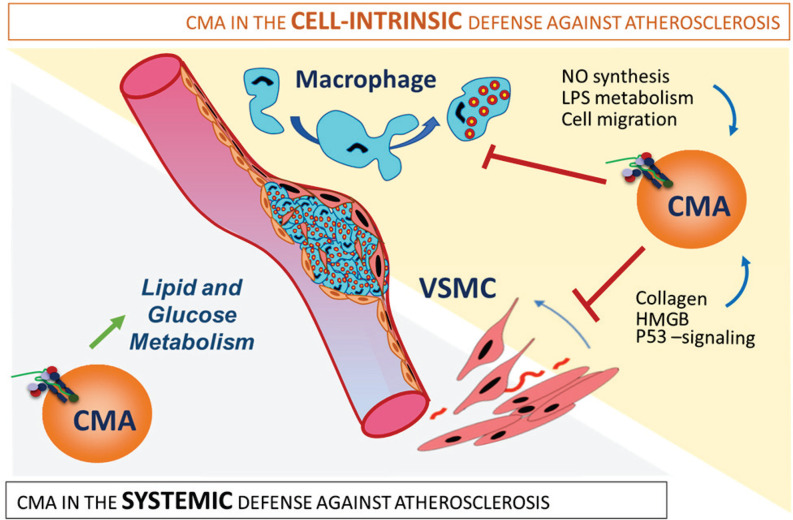
Chaperone-mediated autophagy (CMA) contributes to regulation of energy homeostasis by timely degradation of enzymes involved in glucose and lipid metabolism. Here, we report reduced CMA activity in vascular smooth muscle cells and macrophages in murine and human arteries in response to atherosclerotic challenges. We show that in vivo genetic blockage of CMA worsens atherosclerotic pathology through both systemic and cell-autonomous changes in vascular smooth muscle cells and macrophages, the two main cell types involved in atherogenesis. CMA deficiency promotes dedifferentiation of vascular smooth muscle cells and a proinflammatory state in macrophages. Conversely, a genetic mouse model with up-regulated CMA shows lower vulnerability to proatherosclerotic challenges. We propose that CMA could be an attractive therapeutic target against cardiovascular diseases.

Keywords: atherosclerotic plaques; lipid challenge; lysosomes; proteolysis; vascular disease.


Conflict of interest statement

Competing interest statement: J.M.-M. is a founder and consultant for Instituto Ibions SLP. A.H.B. is a coauthor with T.F. of a review article in 2019. A.M.C. is a cofounder and scientific advisor for the autophagy program at Life Biosciences and consults for Generian Pharmaceuticals and Cognition Therapeutics.

Figures

Fig. 1.
Fig. 1.
CMA deficiency aggravates atherosclerosis in a murine experimental model. (AE) CMA activity in aorta from KFERQ-Dendra2 mice untreated (Control; AC) or subjected to a proatherosclerotic treatment (injected with AAV8-PCSK9 and maintained for 12 wk on WD; D and E). (AE, Insets) Boxed areas at higher magnification. Arrows indicate fluorescent puncta. In C, animals were injected with fluorescent dextran (in red) to highlight endolysosomal compartments. Individual and merged channels of the boxed regions at higher magnification are shown. Arrowheads indicate dextran+Dendra+ puncta (yellow) and dextran+ only puncta (red). Collagen (red) was visualized by second harmonic generation (E). (F) Levels of LAMP-2A at the indicated times of the proatherosclerotic intervention. Representative images of aorta sections (Left) and quantification in the neointima (Right); n = 18. (GJ) Circulating lipids in WT and LAMP-2A–null mice (L2AKO) subjected to the proatherosclerotic challenge for 12 wk. (GJ) Circulating total cholesterol (G), TGs (H), cholesterol profile (I), and TG profile (J). Individual values (G and H) and average curves (I and J) are shown; (n = 15 WT, n = 14 L2AKO). (KT) Plaque properties in the same mouse groups. Representative images of aortas stained for hematoxylin and eosin (H&E) (K) or sirius red (O) and quantification of plaque area (L), size of the necrotic core (M), plaque stage index (N), sirius red–positive area (P), and cap thickness (Q). Calcification analysis in aortas stained for alizarin red (R) as shown in SI Appendix, Fig. S1I . (S and T) Representative images of aortas immunostained for αSMA (VSMCs) (S) and CD68 macrophages (T) and quantification of the stained area (Right); (n = 13 WT, n = 12 L2AKO). Individual values (symbols) and mean ± SEM are shown. Experiments in AE were repeated three times with similar results. All data were tested for normal distribution using the D’Agostino and Pearson normality test. Variables that did not pass the normality test were subsequently analyzed using the Mann–Whitney U rank-sum test. All other variables were tested with the Student’s t test. *P < 0.05, **P < 0.01, ***P < 0.005, and ****P < 0.0001.
Fig. 2.
Fig. 2.
Proatherogenic challenge elicits metabolic dysfunction in CMA-deficient mice. (AE) WT and L2AKO mice subjected to a proatherosclerotic treatment (injected with AAV8-PCSK9 and maintained for 12 wk on WD) were compared for body weight gain (n = 15 WT, n = 14 L2AKO) (A), body composition (n = 4) (two-way ANOVA, F = 120.1; P < 0.0001 for interaction, F = 1736; P < 0.0001 for lean/fat, F = 0.01544; P = 0.9032 for genotype; n = 4) (B), food intake (n = 14 WT, n = 16 L2AKO) (C), energy expenditure (two-way ANOVA, F = 0.1185; P = 0.8889 for interaction, F = 21.05; P < 0.0001 for light/dark/total, F = 22.41; P = 0.0002 for genotype; n = 4) (D), and ambulatory parameters (x + z axes) (two-way ANOVA, F = 3.194; P = 0.0650 for interaction, F = 49.75; P < 0.0001 for light/dark/total, F = 20.75; P = 0.0002 for genotype; n = 4) (E). (FI) Circulating levels in the same mouse groups of insulin (n = 15 WT, n = 14 L2AKO) (F), glucose during an insulin tolerance test (repeated-measures two-way ANOVA after Bonferroni’s post hoc test, F = 1.851; P = 0.1090 for interaction, F = 31.96; P < 0.0001 for time, F = 15.99; P = 0.0040 for genotype; n = 5) (G), area under the curve from the insulin tolerance test (H), and circulating PAI-1 levels (n = 15 WT, n = 14 L2AKO) (I). (JM) Correlation between plasma cholesterol and different plaque parameters: plaque area (J), collagen (K), macrophages (L), and % VSMC of plaque area (M) in the same mouse groups (n = 15 WT, n = 14 L2AKO). All data, when applicable, were tested for normal distribution using the D’Agostino and Pearson normality test. Variables that did not pass the normality test were subsequently analyzed using the Mann–Whitney U rank-sum test. All other variables were tested with the Student’s t test. Individual values (symbols) and mean ± SEM are shown. *P < 0.05, **P < 0.01, and ****P < 0.001.
Fig. 3.
Fig. 3.
CMA blockage makes VSMCs vulnerable to lipotoxicity and promotes their dedifferentiation. (A) CMA activity in VSMCs stably expressing the KFERQ-PS-Dendra2 CMA reporter and exposed to increasing concentrations of LDL. Representative images (Left) of red channel (Top) or merged channels (Bottom). Nuclei are highlighted with DAPI. Quantification of CMA activity as the average number of fluorescent puncta per cell using high-content microscopy (n > 2,500 cells per condition in six different wells and three independent experiments). Statistically significant differences compared with basal (*) or between groups with LDL (#) were analyzed by one-way ANOVA with Tukey’s post hoc test (**P < 0.005, ***P = 0.001, ****P < 0.0001, and #P < 0.05). (B) Intracellular levels of diLDL-derived fluorescence in VSMCs from WT and L2AKO mice. Representative images (Left) and quantification (Right) (n = 3, >45 cells per experiment in three different experiments). (B, Insets) Higher magnification. (C) Cytotoxicity in the same cells in response to increasing concentrations of LDL (two-way ANOVA after Bonferroni’s post hoc test, F = 2.862; P = 0.9872 for interaction, F = 2.205; P = 0.1570 for LDL concentration, F = 21.93; P = 0.0002 for genotype; n = 4-5). (D) Changes in mRNA levels of different markers of cell identity, macrophage-related, and cholesterol pathway in the same VSMCs stimulated with LDL or maintained in medium with delipidated fetal bovine serum (LPDS) (CTRL) (pool of three individual experiments). (E) STRING analysis for pathways differentially regulated in L2AKO cells in response to LDL compared with control (pool of three individual experiments). (F and G) Representative images (F) and quantification (G) of immunofluorescence for pγH2A.X in WT and L2AKO primary VSMCs after LDL loading (n = 3, >5 cells per experiment). (H) Immunoblot for components of the P53 signaling pathway in WT and L2AKO (L2A−/−) VSMCs in basal conditions and upon LDL loading. Ponceau red staining is shown as loading control. The experiment was repeated four times with similar results. (I) Bromodeoxyuridine (BrDU) incorporation in WT and L2AKO primary VSMCs in basal conditions and upon LDL loading (two-way ANOVA after Bonferroni’s post hoc test, F = 0.0002639; P = 0.0183 for interaction, F = 19.35; P < 0.0001 for cells with/without LDL, F = 19.61; P < 0.0001 for genotype; n = 5). (J) Immunoblot (Left) for HMGB1 in the culture media of WT and L2AKO primary VSMCs in basal conditions and upon LDL loading. Quantification (Right) (in arbitrary densitometric units; A.D.U.) of the indicated molecular mass variants of HMGB1 (26 kDa: two-way ANOVA after Bonferroni’s post hoc test, F = 0.1301; P = 0.7246 for interaction, F = 2.801; P = 0.1201 for cells with/without LDL, F = 27.50; P = 0.0002 for genotype; 130 kDa: two-way ANOVA after Bonferroni’s post hoc test, F = 2.578; P = 0.1343 for interaction, F = 2.516; P = 0.1387 for cells with/without LDL, F = 23.19; P = 0.0004 for genotype; 260 kDa: two-way ANOVA after Bonferroni’s post hoc test, F = 0.2109; P = 0.6543 for interaction, F = 0.1635; P = 0.6930 for cells with/without LDL, F = 6.462; P = 0.0258 for genotype; n = 4). (K) Changes in mRNA levels of the main collagen genes in primary WT and L2AKO VSMCs stimulated with LDL or maintained in medium with LPDS (CTRL) (pool of three individual experiments). All data, when applicable, were tested for normal distribution using the D’Agostino and Pearson normality test. Variables that did not pass the normality test were subsequently analyzed using the Mann–Whitney U rank-sum test. All other variables were tested with the Student’s t test. Values are mean ± SEM. **P < 0.01, ***P < 0.005, and ****P < 0.001.
Fig. 4.
Fig. 4.
CMA blockage leads to an exacerbated proinflammatory phenotype in macrophages. (A and B) Levels of iNOS and COX2 proteins in BMDMs from WT and L2AKO mice cultured without additions (CTRL) or stimulated with IFNγ+LPS. Representative immunoblot (A) and densitometric quantification (B) expressed as folds over WT levels (n = 5 iNOS, n = 3 COX2). Ponceau red is shown as loading control. (C) mRNA levels of iNOS and Cox2 in the same cells expressed as folds over untreated (CTRL) (n = 4 iNOS, n = 3 Cox2). (DJ) Comparative proteomic analysis of lysosomes isolated from untreated (none) or leupeptin-treated WT and L2AKO BMDMs untreated (CTRL) or exposed to IFNγ+LPS from a pool of three individual experiments. Schematic of the experimental design and anticipated results for hypothetical proteins undergoing CMA-dependent or -independent lysosomal degradation (D). Percentage of lysosomal (constituents) and nonlysosomal proteins (substrates) in the fractions from CTRL and IFNγ+LPS macrophages (E). Number (F) and percentage (G) of proteins undergoing lysosomal degradation (Total) in a LAMP-2A–dependent (CMA) or -independent (no CMA) manner. STRING analysis for the top intracellular networks of CMA substrates in CTRL (H) and IFNγ+LPS (J) BMDMs. Detail of changes in degradation of proteins involved in synthesis of NO (I); blue circles indicate proteins no longer degraded in lysosomes in the L2AKO group, and down arrows indicate the reduction in lysosomal degradation of those proteins in the same group. (KN) Number of total monocytes (K), proinflammatory subtype of monocytes (L), total T cells (M), and TCD4 cells (N) in WT and L2AKO mice (n = 15 WT, n = 16 L2AKO). All data, when applicable, were tested for normal distribution using the D’Agostino and Pearson normality test. Variables that did not pass the normality test were subsequently analyzed using the Mann–Whitney U rank-sum test. All other variables were tested with the Student’s t test. All values are mean ± SEM. Individual values are shown also in KN. *P < 0.05, **P < 0.01, ***P < 0.005, and ****P < 0.001.
Fig. 5.
Fig. 5.
CMA changes in aorta of atherosclerotic patients with disease. (AH) LAMP-2A levels in different stages of carotid artery atherosclerotic plaque development sourced from asymptomatic subjects at autopsy (study 1). Representative images of the colocalization of LAMP-2A with αSMA- (A) and CD68- (B) positive cells in human atherosclerotic plaques. Representative images of H&E staining (Left) and LAMP-2A immunostaining (Middle; higher magnification, Right) (C); quantification of LAMP-2A staining intensity relative to plaque area (study 1; n = 7–12 per group) (D). Correlation between mRNA levels of LAMP-2A and plaque area (E), the extent of the necrotic core (F) and macrophage content (G) in carotid artery plaques from symptomatic subjects (study 2; n = 36). Comparison of immunostaining for LAMP-2A (Middle) and the macrophage marker CD68 (Right) in adjacent sections from the same patient (H; study 1). (I) Normalized expression (within each cell type) of individual components of the CMA network in scRNAseq from human coronary atherosclerotic plaques from heart transplants (study 3; n = 4). Only three major cell types are highlighted here; results for the other cell types can be found in SI Appendix, Fig. S6B. CMA network elements are organized in functional groups and colored dots indicate the effect of a given element on CMA activity (green, positive element; red, negative element). (J and K) Protein levels for LAMP2 and cathepsin D in carotid artery plaque lysates from symptomatic patients who experienced a secondary coronary event (2ary event) or not (no 2ary event) (study 4; n = 34 no 2ary event, n = 28 2ary event) subjected to immunoblot. Average and individual values in all samples independent of sex (J) and representative immunoblot (Top) and values in females only (14 no 2ary event, n = 8 2ary event) (K). Ponceau red is shown as loading control. (L and M) CMA activation score (L) calculated from normalized mRNA expression data (shown in M) between stable and unstable carotid artery atherosclerotic plaques (study 2). Decrease of the score indicates a predicted transcriptional inhibition of the pathway (t41 = 1.612, P = 0.1146). Normalized expression of individual components of the CMA network in RNAseq from stable (n = 16) and unstable atherosclerotic plaques (n = 26) (study 2). CMA network elements are organized in functional groups and colored dots are as in I. All data, when applicable, were tested for normal distribution using the D’Agostino and Pearson normality test. Variables that did not pass the normality test were subsequently analyzed using the Mann–Whitney U rank-sum test. All other variables were tested with the Student’s t test. Individual patient values and mean ± SEM are shown. *P < 0.05 and **P < 0.01.
Fig. 6.
Fig. 6.
Genetic up-regulation of CMA ameliorates disease in an atherosclerosis murine experimental model. (AD) Circulating lipids in control mice (CTRL) and in mice systemically expressing a copy of human LAMP-2A (hL2AOE) subjected to a proatherosclerotic intervention (injected with AAV8-PCSK9 and maintained for 12 wk on WD). Circulating total cholesterol (A), TGs (B), cholesterol profile (C), and TG profile (D); n = 9 CTRL, n = 8 hL2AOE. IDL, intermediate density LDL. (E) Insulin tolerance test in the same mice (repeated-measures two-way ANOVA after Bonferroni’s post hoc test, F = 3.159; P = 0.0047 for interaction, F = 21.02; P < 0.0001 for time, F = 1.578; P = 0.098 for genotype) in the same mice. (FL) Properties of the plaques from aortas of the same mouse groups. Representative images of aortas stained for H&E (F), alizarin red (I), or sirius red (K) and quantification of plaque area (G), size of the necrotic core (H), calcification presence (J), and collagen deposition (L); n = 9 CTRL, n = 8 hL2AOE. (M and N) Principal-component (PC) analysis of 12 variables measured in CTRL and hL2AOE mice. Each dot represents a single animal (M). Ellipses are the 95% CI around the center of mass of a given experimental group. The bar plot represents mean ± SEM of the PC1 score for each experimental group (N); n = 9 CTRL, n = 8 hL2AOE. *Student’s t test between CTRL and hL2AOE, t15 = 2.152, P = 0.048. Individual values and mean ± SEM are presented in all quantifications. All data were tested for normal distribution using the D’Agostino and Pearson normality test. Variables that did not pass the normality test were subsequently analyzed using the Mann–Whitney U rank-sum test. All other variables were tested with the Student’s t test. **P < 0.01.
Fig. 7.
Fig. 7.
CMA is part of the systemic and vascular response against proatherosclerotic insults. The protective effect of CMA against atherosclerosis results from the combination of systemic and vasculature-specific functions of CMA. (Left) Systemic CMA failure leads to defective lipid and glucose metabolism that increases systemic vulnerability to the metabolic syndrome. (Right) Defective CMA in VSMCs makes them prone to dedifferentiation because of failure to degrade proteins involved in cellular proliferation, collagen secretion, and cell death. Macrophages unable to up-regulate CMA in response to a lipotoxic stimulus acquire a more proinflammatory phenotype with higher NO levels and LPS signaling and with increased migratory capability.

Comment in

References

    1. Virani S. S., et al. ; American Heart Association Council on Epidemiology and Prevention Statistics Committee and Stroke Statistics Subcommittee, Heart disease and stroke statistics—2021 update: A report from the American Heart Association. Circulation 143, e254–e743 (2021). - PubMed
    1. Benjamin E. J., et al. ; American Heart Association Statistics Committee and Stroke Statistics Subcommittee, Heart disease and stroke statistics—2017 update: A report from the American Heart Association. Circulation 135, e146–e603 (2017). - PMC - PubMed
    1. Libby P., The changing landscape of atherosclerosis. Nature 592, 524–533 (2021). - PubMed
    1. Tabas I., Williams K. J., Borén J., Subendothelial lipoprotein retention as the initiating process in atherosclerosis: Update and therapeutic implications. Circulation 116, 1832–1844 (2007). - PubMed
    1. Moore K. J., Tabas I., Macrophages in the pathogenesis of atherosclerosis. Cell 145, 341–355 (2011). - PMC - PubMed