. 2022 Apr 5;119(14):e2112886119.
doi: 10.1073/pnas.2112886119. Epub 2022 Apr 1.

Phenotype-Based Threat Assessment

Affiliations

Phenotype-Based Threat Assessment

Jing Yang et al. Proc Natl Acad Sci U S A. .

Abstract

Bacterial pathogen identification, which is critical for human health, has historically relied on culturing organisms from clinical specimens. More recently, the application of machine learning (ML) to whole-genome sequences (WGSs) has facilitated pathogen identification. However, relying solely on genetic information to identify emerging or new pathogens is fundamentally constrained, especially if novel virulence factors exist. In addition, even WGSs with ML pipelines are unable to discern phenotypes associated with cryptic genetic loci linked to virulence. Here, we set out to determine if ML using phenotypic hallmarks of pathogenesis could assess potential pathogenic threat without using any sequence-based analysis. This approach successfully classified potential pathogenetic threat associated with previously machine-observed and unobserved bacteria with 99% and 85% accuracy, respectively. This work establishes a phenotype-based pipeline for potential pathogenic threat assessment, which we term PathEngine, and offers strategies for the identification of bacterial pathogens.

Keywords: adherence; bacterial pathogen; machine learning; threat assessment; toxicity.


Conflict of interest statement

The authors declare no competing interest.

Figures
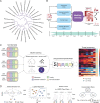
Fig. 1.
Fig. 1.
Framework for generation of an ML platform that enables bacterial threat assessment. (A) Bacterial strains used in this work are phylogenetically divergent. (B) An overall framework in a time frame for threat assessment. (C) Overview of architecture of ML workflow includes data requirements and processing, model selection, and threat assessment. Unknown and known bacterial pathogens used in the threat assessment by the indicated ML models. (D) Overview of computational architecture of the four different ML models used in this work. MOI, multiplicity of infection. Fluor, fluorescence.
Fig. 2.
Fig. 2.
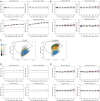
Bacterial adherence performance in evaluating bacterial threat assessment using the ML model. (A) Representative images of adherence assays for P. aeruginosa and E. coli as positive and negative controls. The adherent bacteria and their corresponding target host cells were counted and marked with outlines. Host cells (blue) were stained by DAPI, and bacteria (green) were GFP-tagged. (Scale bar: 50 μm.) (B) Average adherent bacterial counts per A549 cell under various MOIs. Data represent the means ± SDs from three independent experiments. At each MOI, n ≥ 15. Significant difference in adherent bacteria at MOIs of 50 and 100 was observed (****: P value < 0.0001). (C and D) Performance of the four ML models in Test 1 (C) or Test 2 (D) for adherence assay. All models were characterized to determine the percentage of data required to plateau in performance. Each machine learning algorithm was run 20 times, with the error bars showing the 95% confidence interval from the accuracy scores in each run. The accuracy referred to the percentage of strains assigned correctly by the models.
Fig. 3.
Fig. 3.
Bacteria-induced host cell toxicity performance in threat assessment by ML models. (A) Representative images of toxicity assay for THP1 cells induced by bacteria or Shiga toxin at 18 h post infection/incubation (h.p.i.). Total cells (blue) were counted by Hoechst staining and dead cells (red) by PI staining. Cells were automatically counted and marked with outlines. (Scale bar: 50 μm.) (B) Time course of THP1 cell death coincubated with B. subtilis or Shiga toxin producing E. coli (EcpJES 101) at an MOI of 1 for 18 h.p.i. Data represent the mean ± SD from three independent experiments, each experimental data point n ≥ 9. Significant difference in adherent bacteria at MOIs of 50 and 100 was observed (** P value < 0.001, **** P value < 0.0001). (C and D) Performance of the four indicated ML models in Test 1 (C) or Test 2 (D) for toxicity assay. All models were characterized to determine the percentage of data required to plateau in performance. Each machine learning algorithm was run 20 times, with the error bars showing the 95% confidence interval from the accuracy scores in each run. The accuracy referred to the percentage of strains assigned correctly by the models.
Fig. 4.
Fig. 4.
ARs detection and immune activation in the ML models for bacterial threat assessment. (A and B) Performance of the four ML models in Test 1 (A) or Test 2 (B) for bacterial AR assays. (C) Representative flow cytometry plots of GFP reporter activation induced by S. enterica and E. coli and the quantification of activated NF-κB/Jurkat/GFP T lymphocyte reporter cells at various hours post infection (h.p.i) at an MOI of 1. GFP signal was measured using BD Fortessa X-20 (FITC: 488-nm laser with bandwidth filter 525/50) at various h.p.i. (D and E) Performance of the four indicated ML models in Test 1 (B) or Test 2 (C) for immune activation assay. All models were characterized to determine the percentage of data required to plateau in performance. Each machine learning algorithm was run 20 times, with the error bars showing the 95% confidence interval from the accuracy scores in each run. The accuracy referred to the percentage of strains assigned correctly by the models.
Fig. 5.
Fig. 5.
The ensemble ML model of PathEngine improves the accuracy of threat assessment. (A and B) Aggregated performance for all four phenotypic assays, bacterial adherence, host immune activation, AR, and bacterial toxicity in PathEngine prediction for Test 1 (A) and in Test 2 (B). Each machine learning algorithm was run 20 times, with the error bars showing the 95% confidence interval from the accuracy scores in each run. (C and D) The observations from each strain and each phenotypic assay were aggregated to make one prediction per strain in the PathEngine ensemble model. The accuracy was estimated by comparing the actual threat status and the predicted threat status for each strain. Bacterial pathogenic potential was quantified by individual assays and the ensemble assay in Test 1 (C) and Test 2 (D). Pathogenic scores obtained from ML predictions for each assay between 0 (blue) and 1 (red). 0 represents a strong nonpathogen, and 1 represents a strong pathogen. The ensemble probabilities show when the pathogenic scores from all four assays are ensembled together. Ensemble predictions convert the ensemble probabilities to 0 or 1 with a cutoff at 0.5 for comparing to the pathogenicity label in the last column.

References

    1. Hosainzadegan H., Khalilov R., Gholizadeh P., The necessity to revise Koch’s postulates and its application to infectious and non-infectious diseases: A mini-review. Eur. J. Clin. Microbiol. Infect. Dis. 39, 215–218 (2020). - PubMed
    1. Deneke C., Rentzsch R., Renard B. Y., PaPrBaG: A machine learning approach for the detection of novel pathogens from NGS data. Sci. Rep. 7, 39194 (2017). - PMC - PubMed
    1. Bartoszewicz J. M., Seidel A., Rentzsch R., Renard B. Y., DeePaC: Predicting pathogenic potential of novel DNA with reverse-complement neural networks. Bioinformatics 36, 81–89 (2020). - PubMed
    1. Zhao X., Wang N., An interpretable machine learning method for detecting novel pathogens. Res. Sq. [Preprint] (2020). https://www.researchsquare.com/article/rs-11084/v2. Accessed 16 March 2020.
    1. de Nies L., et al. , PathoFact: A pipeline for the prediction of virulence factors and antimicrobial resistance genes in metagenomic data. Microbiome 9, 49 (2021). - PMC - PubMed

Substances

LinkOut - more resources