. 2022 Apr 1;18(4):e1010454.
doi: 10.1371/journal.ppat.1010454. eCollection 2022 Apr.

Early IL-17A production helps establish Mycobacterium intracellulare infection in mice

Affiliations

Early IL-17A production helps establish Mycobacterium intracellulare infection in mice

Bock-Gie Jung et al. PLoS Pathog. .

Abstract

Nontuberculous mycobacteria (NTM) infection is common in patients with structural lung damage. To address how NTM infection is established and causes lung damage, we established an NTM mouse model by intranasal inoculation of clinical isolates of M. intracellulare. During the 39-week course of infection, the bacteria persistently grew in the lung and caused progressive granulomatous and fibrotic lung damage with mortality exceeding 50%. Lung neutrophils were significantly increased at 1 week postinfection, reduced at 2 weeks postinfection and increased again at 39 weeks postinfection. IL-17A was increased in the lungs at 1-2 weeks of infection and reduced at 3 weeks postinfection. Depletion of neutrophils during early (0-2 weeks) and late (32-34 weeks) infection had no effect on mortality or lung damage in chronically infected mice. However, neutralization of IL-17A during early infection significantly reduced bacterial burden, fibrotic lung damage, and mortality in chronically infected mice. Since it is known that IL-17A regulates matrix metalloproteinases (MMPs) and that MMPs contribute to the pathogenesis of pulmonary fibrosis, we determined the levels of MMPs in the lungs of M. intracellulare-infected mice. Interestingly, MMP-3 was significantly reduced by anti-IL-17A neutralizing antibody. Moreover, in vitro data showed that exogenous IL-17A exaggerated the production of MMP-3 by lung epithelial cells upon M. intracellulare infection. Collectively, our findings suggest that early IL-17A production precedes and promotes organized pulmonary M. intracellulare infection in mice, at least in part through MMP-3 production.


Conflict of interest statement

The authors have declared that no competing interests exist.

Figures

Fig 1
Fig 1. M. intracellulare infection causes persistent bacterial growth and mortality in mice.
(A) Schematic representation of M. intracellulare infection and experimental schedule. C57BL/6 mice were infected with clinical isolates of M. intracellulare (5 × 10⁷ CFU) via the intranasal route. The bacterial burden in the lungs after 24 h was 3.3 × 10⁷ CFU. Mice were sacrificed at 1, 2, 3, 4, 8, 12 and 39 weeks postinfection. Bacterial burden, histological analyses, immune cell subpopulation (by flow cytometry) and cytokine/chemokine levels (by multiplex ELISA) were evaluated at each indicated time. (B-E) Bacterial burden was determined in the lungs (B), spleen (C), mediastinal lymph nodes (MLN) (D), and liver (E). Data were pooled from two independent experiments (total n = 6 mice per indicated time point). Data are expressed as the means ± SEM. *P < 0.05, **P < 0.01, and ***P < 0.001 compared with 1 week postinfection. (F) A mortality study was performed separately. Twenty mice per group were used in this study and experiments were repeated two times. Survival curves for uninfected control (white circles) and M. intracellulare-infected mice (black circles). Data were pooled from two independent experiments (total n = 40 mice per group). Survival curves were compared using the log rank test. ***P < 0.001.
Fig 2
Fig 2. M. intracellulare infection induces lung inflammation and fibrosis in mice.
(A-E) C57BL/6 mice were infected with clinical isolates of M. intracellulare (5 × 10⁷ CFU) via the intranasal route. Mice were sacrificed at 1, 2, 3, 4, 8, 12 and 39 weeks postinfection. Lungs from uninfected control and M. intracellulare-infected mice were collected and formalin-fixed. Paraffin-embedded tissue sections were prepared (total n = 4 mice per indicated time point) and stained with hematoxylin and eosin (A) and trichrome (B). A representative figure of each indicated time point is shown (A, B). (C) The severity of lung inflammation was quantified from a total of 4 mice per indicated time point using a score from 0 (no inflammation) to 4 (severe inflammation) for each of the following criteria: alveolar wall inflammation, alveolar destruction, leukocyte infiltration, and perivascular inflammation. (D) The severity of pulmonary fibrosis was quantified from a total of 4 mice per indicated time point according to the Ashcroft scoring system. All histopathological evaluations were performed in a blinded fashion. (E) A representative lung gross morphology of uninfected control (left) and M. intracellulare-infected mice (right) at 38 weeks postinfection is shown. Data are expressed as the means ± SEM. *P < 0.05 and ***P < 0.001.
Fig 3
Fig 3. Lung infiltration of immune cells in M. intracellulare-infected mice.
(A-J) Lungs from uninfected control and M. intracellulare-infected mice were collected at 1, 2, 3, 4, 8, 12 and 39 weeks postinfection. The absolute number of immune cells per whole lung was determined by flow cytometry. Data were pooled from two independent experiments (uninfected mice n = 30, infected mice n = 6 mice per indicated time point). Data are expressed as the means ± SEM. *P < 0.05, **P < 0.01, and ***P < 0.001. ns, not significant. P values for comparison between uninfected mice (Un) and other were indicated with asterisks sans connecting lines. For other comparisons, connecting lines used.
Fig 4
Fig 4. Cytokine and chemokine profiles of M. intracellulare-infected mouse lungs.
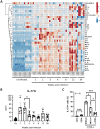
(A-B) Lungs from uninfected control and M. intracellulare-infected mice were collected at 1, 2, 3, 4, 8, 12 and 39 weeks postinfection. Overall, 36 cytokines and chemokines were determined in lung homogenates of mice using multiplex ELISA. Data were pooled from two independent experiments (uninfected mice n = 15, infected mice n = 6 mice per indicated time point), and hierarchical clustering was performed (A). The IL-17A level at each time point is shown (B). (C) To identify the cellular source of IL-17A, lung cells were isolated from M. intracellulare-infected mice (n = 5) after 2 weeks of infection (because lung IL-17A levels peaked at 1–2 weeks postinfection), and IL-17A-producing cells were determined by flow cytometry. The percentages (%) of IL-17A-producing cells in CD45+CD3- cells, CD45+CD3+ cells, CD45+CD3+RORγt+ cells, CD45+CD3+NK1.1+ cells and CD45+CD3+γδTCR+ cells are shown (C). Data are expressed as the means ± SEM. *P < 0.05, **P < 0.01, and ***P < 0.001. ns, not significant. P values for comparison between uninfected mice (Un) and other were indicated with asterisks sans connecting lines. For other comparisons, connecting lines used.
Fig 5
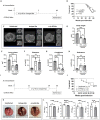
Fig 5. Anti-Ly6G mAb treatment during early and chronic infection has no effect on mortality or lung damage in chronically infected mice.
(A) Schematic representation of M. intracellulare infection and the experimental schedule for early neutrophil depletion are shown. C57BL/6 mice were infected with clinical isolates of M. intracellulare (5 × 10⁷ CFU) via the intranasal route. To deplete neutrophils, M. intracellulare-infected mice were intraperitoneally injected with anti-Ly6G mAb or rat IgG2a isotype control Ab every other day from 1 to 11 days postinfection. (B) Survival curves for M. intracellulare-infected mice treated with anti-Ly6G mAb (black circle) or isotype control Ab (white circle) (B). Data were pooled from two independent experiments (total n = 15 mice per group). Survival curves were compared using the log rank test. ns, not significant. (C-H) Lung CT scanning and pulmonary function tests were conducted at 48 weeks postinfection. A representative lung CT scan image of each group is shown (C). Body weight (D), lung volume (E), lung elastance (F), lung compliance (G) and lung resistance (H) of untreated and uninfected mice (Un, n = 4–5), isotype control Ab-treated (ISO, n = 3–5) or anti-Ly6G mAb-treated (α-Ly6G, n = 4–5) M. intracellulare-infected mice were evaluated at 48 weeks postinfection. (I) Schematic representation of M. intracellulare infection and the experimental design for late neutrophil depletion are shown. C57BL/6 mice were infected with clinical isolates of M. intracellulare at 5 × 10⁷ CFU via the intranasal route. To deplete neutrophils, M. intracellulare-infected mice were intraperitoneally injected with anti-Ly6G mAb or rat IgG2a isotype control Ab 3 times per week from 32–34 weeks postinfection. (J) Survival curves for M. intracellulare-infected mice treated with anti-Ly6G mAb (black circle) or isotype control Ab (white circle) (J). Data were pooled from two independent experiments. Survival curves were compared using the log rank test. ns, not significant. (K) Representative lung gross morphology of uninfected control (left), M. intracellulare-infected and isotype control Ab-treated mice (middle) and M. intracellulare-infected and anti-Ly6G mAb-treated mice (right) at 38 weeks postinfection is shown. (L) Bacterial burden was determined in the lungs, spleen, mediastinal lymph nodes (MLNs), and liver at 38 weeks postinfection. Data are expressed as the means ± SEM. *P < 0.05, **P < 0.01, and ***P < 0.001. ns, not significant. Data from 2 independent experiments were combined.
Fig 6
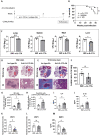
Fig 6. Neutralization of IL-17A during early M. intracellulare infection reduces mortality, bacterial burden, and lung damage in chronically infected mice.
(A) Schematic representation of M. intracellulare infection and anti-IL-17A mAb or isotype control treatments is shown. Mice were intranasally administered normal saline or M. intracellulare suspension (5 × 10⁷ CFU in normal saline). To neutralize IL-17A, M. intracellulare-infected mice were intraperitoneally injected with 100 μg of anti-IL-17A mAb or 100 μg of mouse IgG1 isotype control Ab every other day from 1 to 11 days postinfection. (B) Survival curves for anti-IL-17A mAb (black circle)- or isotype control (white circle)-treated M. intracellulare-infected mice. Data were pooled from two independent experiments (total n = 15 mice per group). Survival curves were compared using the log rank test. (C) Bacterial burden was determined in the lungs, spleen, mediastinal lymph nodes (MLNs), and liver at 39 weeks postinfection. Data were pooled from two independent experiments (total n = 4 mice in the isotype control Ab-treated group, total n = 7 mice in the anti-IL-17A mAb-treated group). (D-F) Lungs of the mice were formalin-fixed at 39 weeks postinfection (total n = 4 mice in isotype control Ab-treated group, total n = 6 mice in anti-IL-17A mAb-treated group). Paraffin-embedded tissue sections were prepared and stained with hematoxylin and eosin and trichrome. Representative images of H&E staining (D) and trichrome staining (E) of each group is shown. The lesion area (%) in lung images (F) was determined based on whole lung images stained with H&E at 39 weeks postinfection. (G-M) The immune cell subpopulation, cytokines/chemokines and MMPs were determined in lung homogenates of mice at 39 weeks postinfection (total n = 4 mice in the isotype control Ab-treated group, total n = 6 or 7 mice in the anti-IL-17A mAb-treated group). Dendritic cells (G) and NK cells (H) in the whole lung. IL-4 (I) and IL-22 (J) levels in lung homogenates. Relative mRNA expression levels of MMP-3 (K) and MMP-9 (L) and MMP-3 protein levels (M) in lung homogenates. Data are expressed as the means ± SEM. *P < 0.05, and **P < 0.01. ns, not significant. Data from 2 independent experiments were combined.
Fig 7
Fig 7. Effects of IL-17A on M. intracellulare-infected human lung epithelial cells.
(A-D) The human lung epithelial cell line H1975 was infected with different bacterial numbers [0, 100 and 1000 multiplicity of infection (MOI)] in the presence of different concentrations of IL-17A (0, 100, 500 and 1000 ng/ml). MMP-3 (A), MMP-9 (B), bacterial burden (C) and lactate dehydrogenase (LDH) activity (D) were evaluated at the indicated time points. MMP-3 (A), MMP-9 (B) and LDH activity (D) were evaluated in cell culture supernatants, and bacterial burden (C) was determined in cell lysates. Data are expressed as the means ± SEM. *P < 0.05, **P < 0.01, and ***P < 0.001. ns, not significant. Three independent experiments were performed.

References

    1. Cowman S, van Ingen J, Griffith DE, Loebinger MR. Non-tuberculous mycobacterial pulmonary disease. Eur Respir J. 2019; 54(1). doi: 10.1183/13993003.00250-2019 . - DOI - PubMed
    1. Donohue MJ, Wymer L. Increasing Prevalence Rate of Nontuberculous Mycobacteria Infections in Five States, 2008–2013. Ann Am Thorac Soc. 2016; 13(12): 2143–50. doi: 10.1513/AnnalsATS.201605-353OC . - DOI - PubMed
    1. Adjemian J, Frankland TB, Daida YG, Honda JR, Olivier KN, Zelazny A, et al.. Epidemiology of Nontuberculous Mycobacterial Lung Disease and Tuberculosis, Hawaii, USA. Emerg Infect Dis. 2017; 23(3): 439–47. doi: 10.3201/eid2303.161827 . - DOI - PMC - PubMed
    1. Ko RE, Moon SM, Ahn S, Jhun BW, Jeon K, Kwon OJ, et al.. Changing Epidemiology of Nontuberculous Mycobacterial Lung Diseases in a Tertiary Referral Hospital in Korea between 2001 and 2015. J Korean Med Sci. 2018; 33(8): e65. doi: 10.3346/jkms.2018.33.e65 . - DOI - PMC - PubMed
    1. Marras TK, Chedore P, Ying AM, Jamieson F. Isolation prevalence of pulmonary non-tuberculous mycobacteria in Ontario, 1997 2003. Thorax. 2007; 62(8): 661–6. doi: 10.1136/thx.2006.070797 . - DOI - PMC - PubMed