. 2022 May 10;17(5):1198-1214.
doi: 10.1016/j.stemcr.2022.02.020. Epub 2022 Mar 31.

Functional redundancy among Polycomb complexes in maintaining the pluripotent state of embryonic stem cells

Affiliations

Functional redundancy among Polycomb complexes in maintaining the pluripotent state of embryonic stem cells

Yaru Zhu et al. Stem Cell Reports. .

Abstract

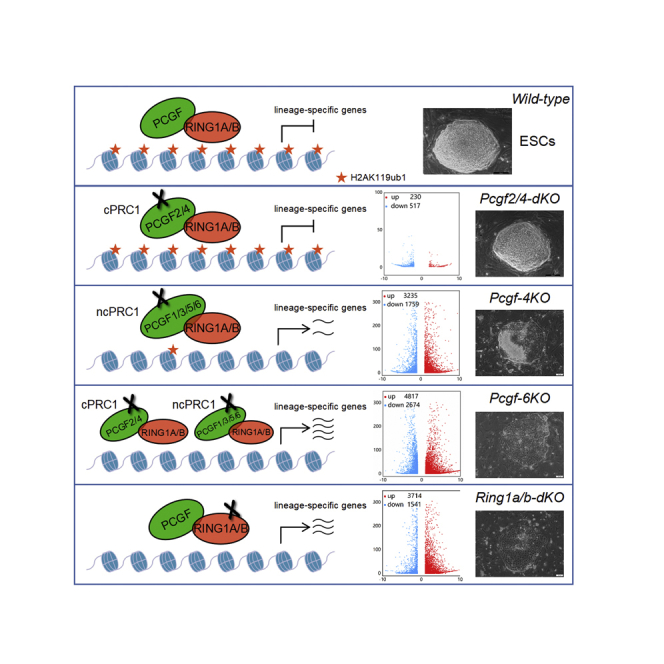
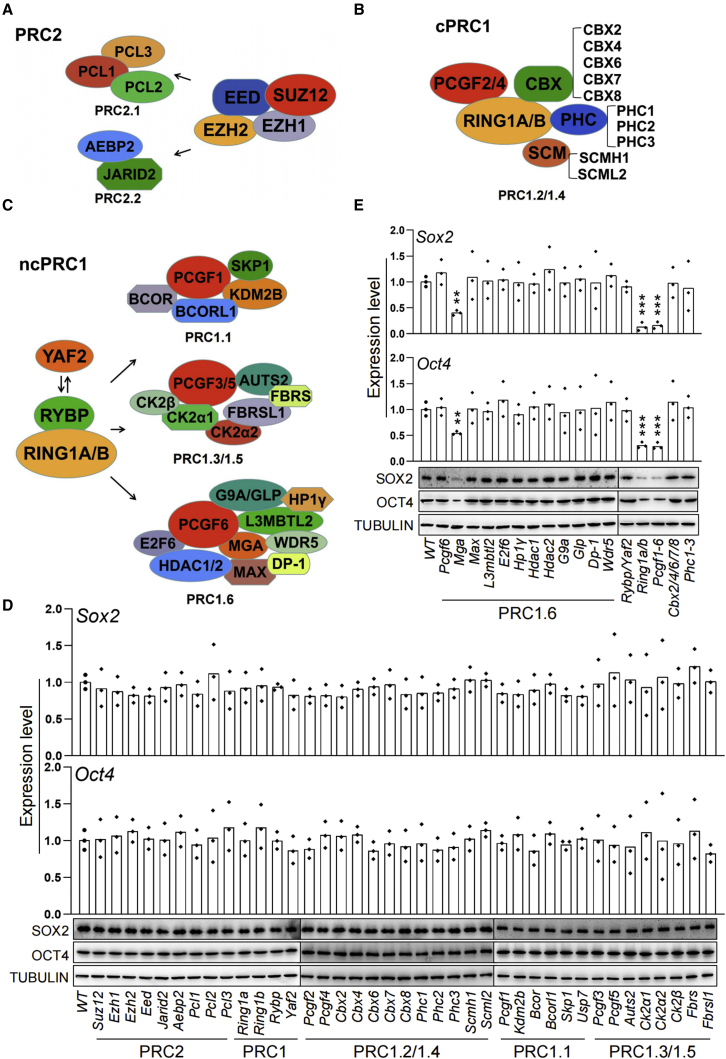
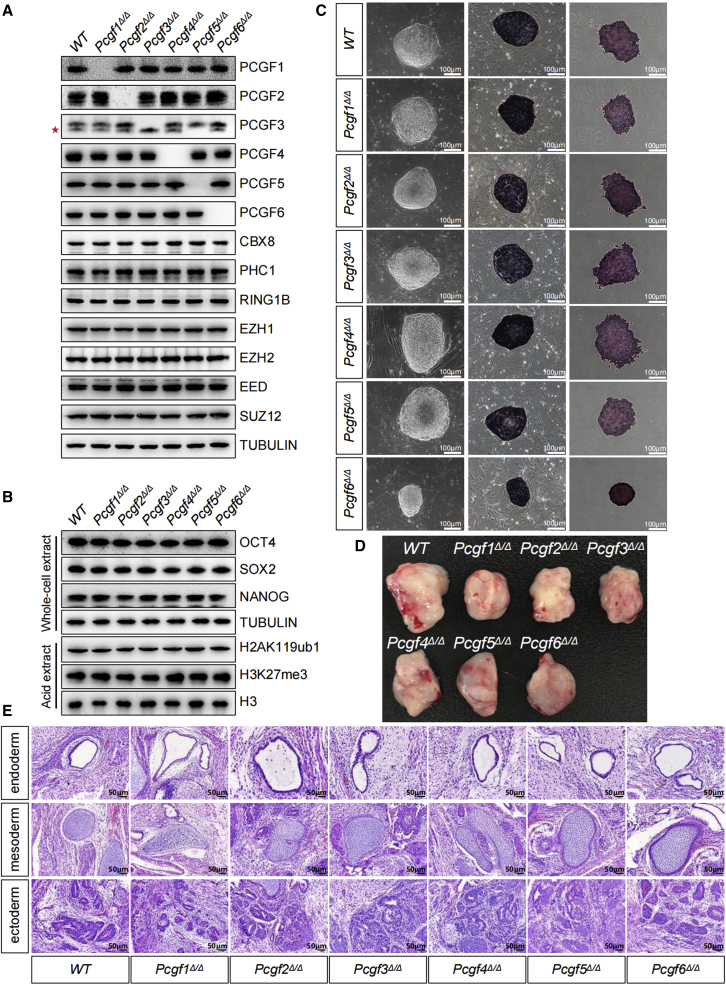
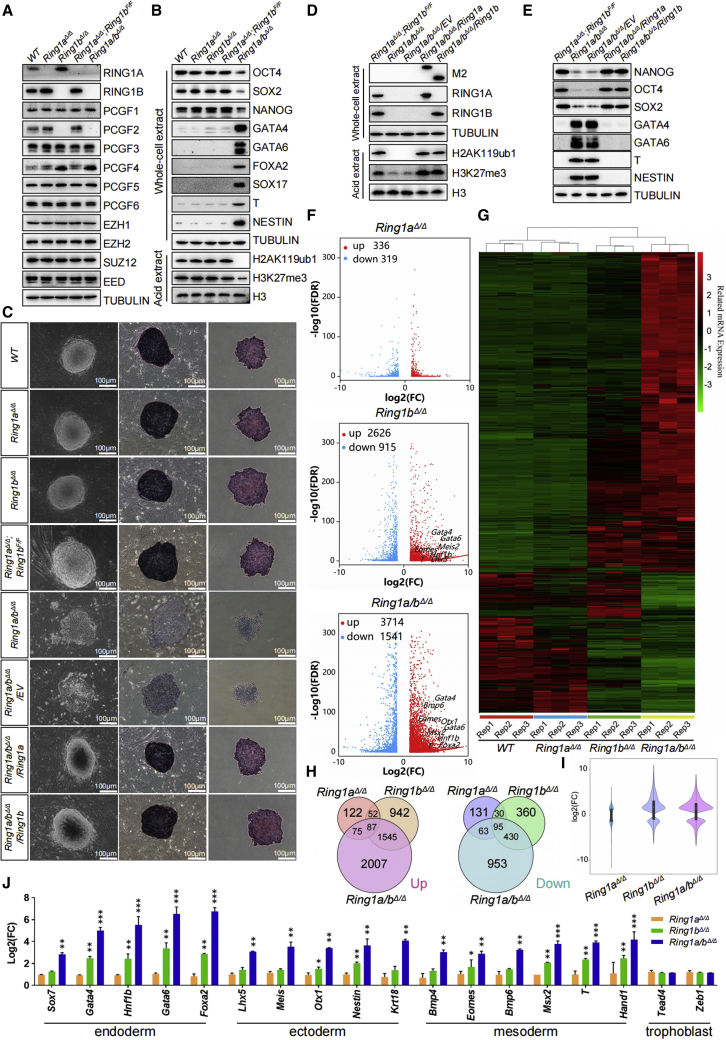
Polycomb group proteins assemble into multi-protein complexes, known as Polycomb repressive complexes 1 and 2 (PRC1 and PRC2), that guide cell fate decisions during embryonic development. PRC1 forms an array of biochemically distinct canonical PRC1 (cPRC1) or non-canonical PRC1 (ncPRC1) complexes characterized by the mutually exclusive presence of PCGF (PCGF1-PCGF6) paralog subunit; however, whether each one of these subcomplexes fulfills a distinct role remains largely controversial. Here, by performing a CRISPR-based loss-of-function screen in embryonic stem cells (ESCs), we uncovered a previously unappreciated functional redundancy among PRC1 subcomplexes. Disruption of ncPRC1, but not cPRC1, displayed severe defects in ESC pluripotency. Remarkably, coablation of non-canonical and canonical PRC1 in ESCs resulted in exacerbation of the phenotype observed in the non-canonical PRC1-null ESCs, highlighting the importance of functional redundancy among PRC1 subcomplexes. Together, our studies demonstrate that PRC1 subcomplexes act redundantly to silence lineage-specific genes and ensure robust maintenance of ESC identity.

Keywords: PCGF; PRC1; Polycomb; RING1A/B; cPRC1; embryonic stem cells; germ layer lineages; ncPRC1; pluripotency; redundancy.


Figures

None
Graphical abstract
Figure 1
Figure 1
Effect of ablation of PcG genes on the expression of core pluripotency transcription factors Oct4 and Sox2 in ESCs (A–C) (A) Schematic representation of the subunit composition of the mammalian PRC2, (B) cPRC1, and (C) ncPRC1 complexes. (D and E) Effect of CRISPR-mediated knockout of PcG genes on the expression of the pluripotency core regulators Oct4 and Sox2 in ESCs determined by qRT-PCR (top) and western blot (bottom). Each value was normalized to its corresponding actin value and the expression level in wild-type (WT) ESCs was arbitrarily set to 1. Data in (D) and (E) represent mean ± SD obtained from three independent experiments, p < 0.05, ∗∗p < 0.01, ∗∗∗p < 0.001 (Student’s t test) compared with the control.
Figure 2
Figure 2
Loss of individual PCGF family members has no or a mild effect on the pluripotent properties of ESCs (A) Western blot analyses showing changes in the global levels of PcG proteins in ESCs of indicated genotypes. Note, the PCGF3 antibody also recognized PCGF5 (). (B) Western blot analyses showing changes in the global levels of pluripotency factors, H2AK119ub1 and H3K27me3 in ESCs of indicated genotypes. Tubulin and H3 were used as loading controls. (C) Left: phase-contrast images of ESC colonies cultured on a feeder layer of MEFs. Middle and right: representative images of AP staining of WT and mutant ESC colonies cultured on a feeder layer of MEFs (middle) or gelatin (right). Scale bar, 100 μm. (D) Teratoma formation in immunodeficiency mice by ESCs of indicated genotypes. (E) Representative images of tissues of all three germ layers, including gut epithelium (endoderm), cartilage (mesoderm), and neural rosette (ectoderm), from H&E staining of teratomas generated from ESCs of the indicated genotypes. Shown is a representative of three injected mice. Scale bars, 50 μm.
Figure 3
Figure 3
RING1A/B coordinate redundant mechanisms that ensure robust repression of key lineage-specific genes for sustaining ESC identity (A and B) (A) Western blot demonstrating changes in the levels of PcG proteins, (B) pluripotency factors, endodermal (GATA4, GATA6, FOXA2, SOX17), mesodermal (T), and ectodermal (NESTIN) markers in ESCs of indicated genotypes. Tubulin and H3 were used as loading controls. (C) Left: phase-contrast images of ESC colonies of indicated genotypes cultured on a feeder layer of MEFs. Middle and right: images of ESC colonies cultured on feeder layers (middle) or gelatin (right) after AP staining. Scale bar, 100 μm. (D and E) (D) Western blot for selected PcG proteins, H2AK119ub1, H3K27me3, (E) pluripotency factors and selected germ layer markers in ESCs of indicated genotypes. The expression levels of the indicated FLAG-tagged proteins were detected with anti-Flag M2 antibody. Tubulin and H3 were used as loading controls. (F) Volcano plots of –log10 (p value) against log2-fold change representing the differences in gene expression in ESCs of indicated genotypes. Upregulated (red) and downregulated (blue) genes are highlighted. (G) Heatmap depicting fold changes in gene expression in ESCs of indicated genotypes. False discovery rate <0.05. Up- and downregulated genes are reported as red and green, respectively. (H) Venn diagram showing overlap of upregulated (top) or downregulated (bottom) genes in Ring1aΔ/Δ, Ring1bΔ/Δ, and Ring1a/bΔ/Δ ESCs. (I) A violin plot comparing log2-fold changes of genes in ESCs deficient for Ring1a, Ring1b, or both. (J) qRT-PCR analysis of changes in the expression of lineage-specific genes. Each value was normalized to actin expression, and for each gene, the expression level in the wild-type ESCs was arbitrarily set to 1. Data are shown as the means ± SD for triplicate analysis. p < 0.05, ∗∗p < 0.01, ∗∗∗p < 0.001 (Student’s t test) compared with the control.
Figure 4
Figure 4
Individual disruption of cPRC1 does not induce exit from pluripotency in ESCs (A) Phase-contrast images of ESC colonies on MEF feeders (left). Representative images of AP staining of WT and mutant ESC colonies of indicated genotypes (right). (B and C) Western blot demonstrating changes in the levels of indicated PcG proteins, pluripotency factors, and histone modifications in ESCs of indicated genotypes. Tubulin and H3 were used as loading controls. (D) Representative images showing H&E staining of histological sections derived from teratomas generated from ESCs of the indicated genotypes. Shown is a representative of three injected mice. Scale bars, 50 μm.
Figure 5
Figure 5
Combined loss of Pcgf1/3/5/6 unleash precocious differentiation of ESCs (A) Reference legend for cell lines used in this figure and in Figure S5. (B) Western blot demonstrating changes in the levels of selected PcG proteins, pluripotency factors, germ layer markers, H2AK119ub1, and H3K27me3 in ESCs of indicated genotypes. Tubulin and H3 were used as loading controls. (C) Top: phase-contrast images of ESC colonies cultured on a layer of MEFs. Middle and bottom: representative images of AP staining of ESC colonies of indicated genotypes cultured together with a feeder layer of MEFs (middle) or on gelatin (bottom). Scale bar, 100 μm. (D) H&E staining of teratoma sections revealed cells from various cell lineages including gut epithelium (endoderm), cartilage (mesoderm) and neural rosette (ectoderm). Shown is a representative of three injected mice. Scale bars, 50 μm.
Figure 6
Figure 6
Simultaneous ablation of cPRC1 and ncPRC1 triggers spontaneous differentiation and loss of self-renewal (A) Reference legend for cell lines used in this figure and in Figure 7. (B–D) Western blot demonstrating changes in the levels of selected (B) PcG proteins, (C) pluripotency factors, histone modifications, and (D) germ layer markers in ESCs of indicated genotypes. Tubulin and H3 were used as loading controls. (E) Left: phase-contrast images of ESC colonies of indicated genotypes cultured on a feeder layer. Middle and right: images of ESC colonies cultured on feeder layers (middle) or gelatin (right) after AP staining. Scale bar, 100 μm. (F) Representative cell-cycle profiles determined by propidium iodide (PI) staining and FACS analysis. (G) Flow cytometric quantification of apoptosis with Annexin V and PI. The percentages of Annexin V-positive (apoptotic) cells are within the two right quadrants. (H) Western blot analyses using the indicated antibodies on whole-cell lysates from ESCs of indicated genotypes. The expression levels of the indicated FLAG-tagged proteins were detected with anti-Flag M2 antibody. (I) IF analysis for SOX2, OCT4 (green), GATA4, T (red), or DAPI (blue) in Pcgf1-5Δ/Δ;Pcgf6F/F ESCs following lenti-Cre infection. Images were taken at 63× magnification using confocal microscopy. Merge, merged images.
Figure 7
Figure 7
cPRC1 and ncPRC1 act redundantly to silence lineage-specific genes (A) Representative images of mice bearing teratomas 28 days after the injection of Pcgf1/3/5/2/4Δ/Δ;Pcgf6F/F (left side, indicated by a red arrow) or Pcgf1-6Δ/Δ ESCs (right side). Four mice were injected per condition. (B) Volcano plots of –log10 (p value) against log2-fold change representing the differences in gene expression in ESCs of indicated genotypes. Upregulated (red) and downregulated (blue) genes are highlighted. (C) Heatmap illustrating fold changes in gene expression in ESCs of indicated genotypes. False discovery rate <0.05. Up- and downregulated genes are reported as red and green, respectively. (D) Venn diagram showing overlap of upregulated (left) or downregulated (right) genes between Pcgf-4KO, Pcgf-6KO, and Ring1a/bΔ/Δ ESCs. (E) A violin plot comparing log2-fold changes of genes in ESCs deficient for Pcgf2/4, Pcgf1/3/5/6, Pcgf1-6, and Ring1a/b. (F) Gene ontology analysis of overlapping genes upregulated (top) and downregulated (bottom) between Pcgf-4KO and Pcgf-6KO ESCs. (G) qRT-PCR of germ layer markers, measured in WT, Pcgf-4KO, and Pcgf-6KO ESCs. Each value was normalized to actin expression, and for each gene the expression level in the wild-type ESCs was arbitrarily set to 1. (H) ESCs of indicated genotypes were treated with cycloheximide (CHX) as indicated and lysates were blotted with the indicated antibodies. Tubulin was used as a loading control. (I) Genomic snapshots of the indicated ChIP-seq profiles at selected germ layer gene loci in WT ESCs. Published ChIP-seq data were obtained from NCBI GEO (accession numbers GSE122715 and GSE107377). Data in (G) represent the mean ± SD of three independent experiments. p < 0.05, ∗∗p < 0.01, ∗∗∗p < 0.001 (Student’s t test) compared with the control.

Comment in

  • PRC1 uncomplexed.
    Schouten S, Bovee N, Liu Z, Marks H. Schouten S, et al. Stem Cell Reports. 2022 May 10;17(5):1009-1011. doi: 10.1016/j.stemcr.2022.04.010. Stem Cell Reports. 2022. PMID: 35545021 Free PMC article.

Similar articles

Cited by

References

    1. Akasaka T., van Lohuizen M., van der Lugt N., Mizutani-Koseki Y., Kanno M., Taniguchi M., Vidal M., Alkema M., Berns A., Koseki H. Mice doubly deficient for the Polycomb Group genes Mel18 and Bmi1 reveal synergy and requirement for maintenance but not initiation of Hox gene expression. Development. 2001;128:1587–1597. - PubMed
    1. Almeida M., Pintacuda G., Masui O., Koseki Y., Gdula M., Cerase A., Brown D., Mould A., Innocent C., Nakayama M., et al. PCGF3/5-PRC1 initiates Polycomb recruitment in X chromosome inactivation. Science. 2017;356:1081–1084. - PMC - PubMed
    1. Boyer L.A., Lee T.I., Cole M.F., Johnstone S.E., Levine S.S., Zucker J.P., Guenther M.G., Kumar R.M., Murray H.L., Jenner R.G., et al. Core transcriptional regulatory circuitry in human embryonic stem cells. Cell. 2005;122:947–956. - PMC - PubMed
    1. Boyer L.A., Plath K., Zeitlinger J., Brambrink T., Medeiros L.A., Lee T.I., Levine S.S., Wernig M., Tajonar A., Ray M.K., et al. Polycomb complexes repress developmental regulators in murine embryonic stem cells. Nature. 2006;441:349–353. - PubMed
    1. Coré N., Bel S., Gaunt S.J., Aurrand-Lions M., Pearce J., Fisher A., Djabali M. Altered cellular proliferation and mesoderm patterning in Polycomb-M33-deficient mice. Development. 1997;124:721–729. - PubMed

Publication types

MeSH terms

Substances

LinkOut - more resources