. 2022 Apr 7;29(4):593-609.e7.
doi: 10.1016/j.stem.2022.03.002. Epub 2022 Mar 31.

Specification of fetal liver endothelial progenitors to functional zonated adult sinusoids requires c-Maf induction

Affiliations

Specification of fetal liver endothelial progenitors to functional zonated adult sinusoids requires c-Maf induction

Jesus Maria Gómez-Salinero et al. Cell Stem Cell. .

Abstract

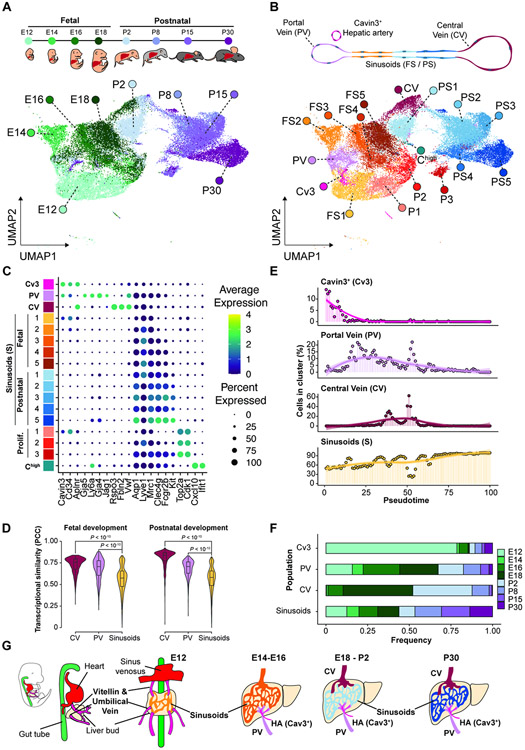
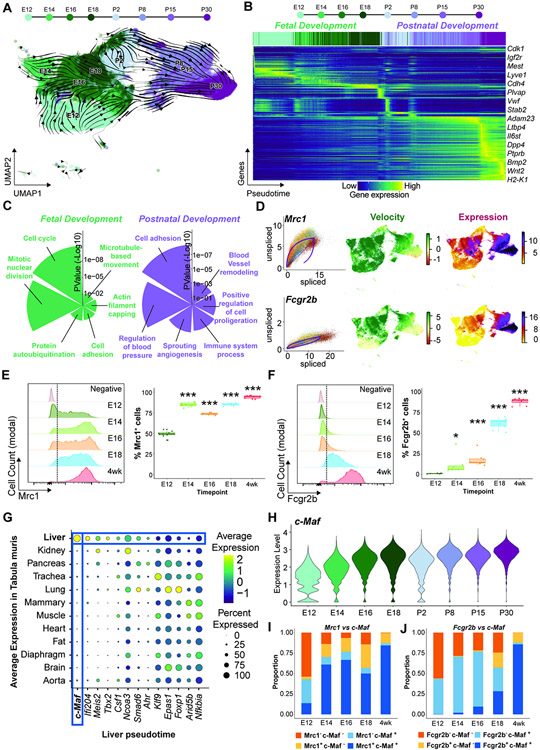
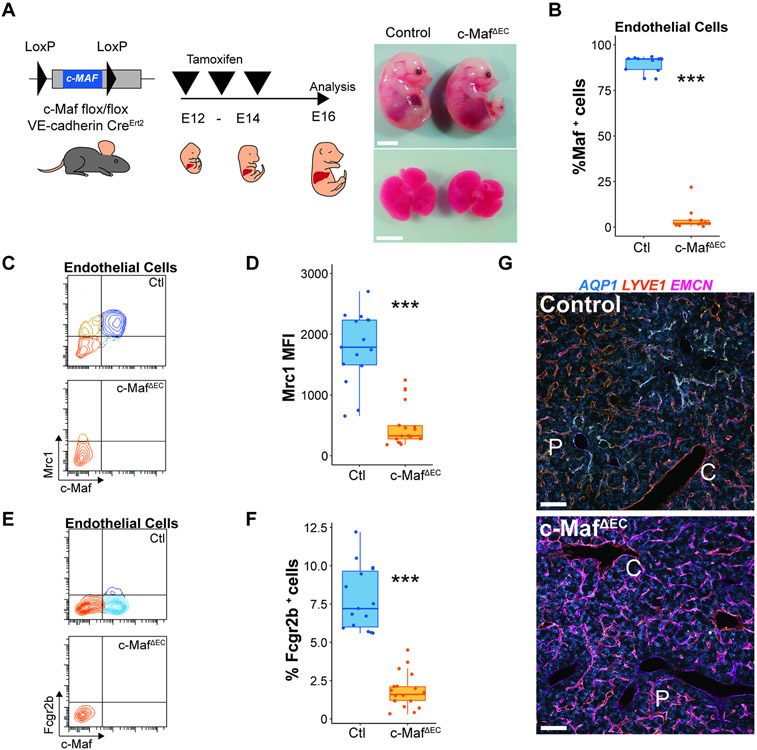
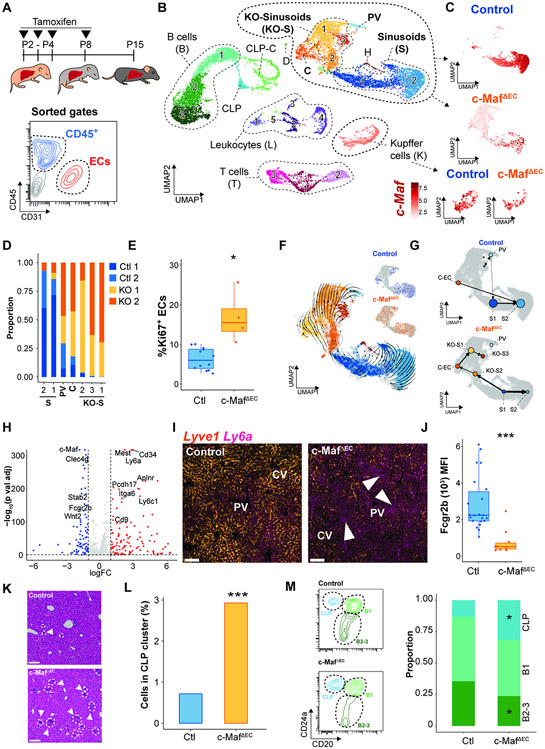
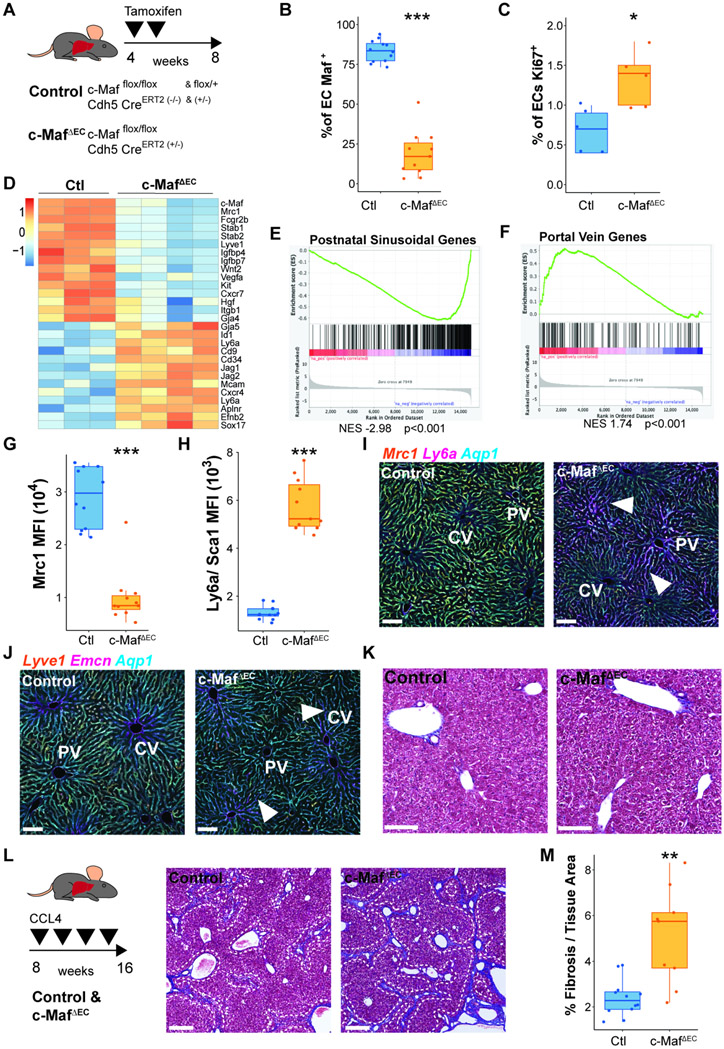
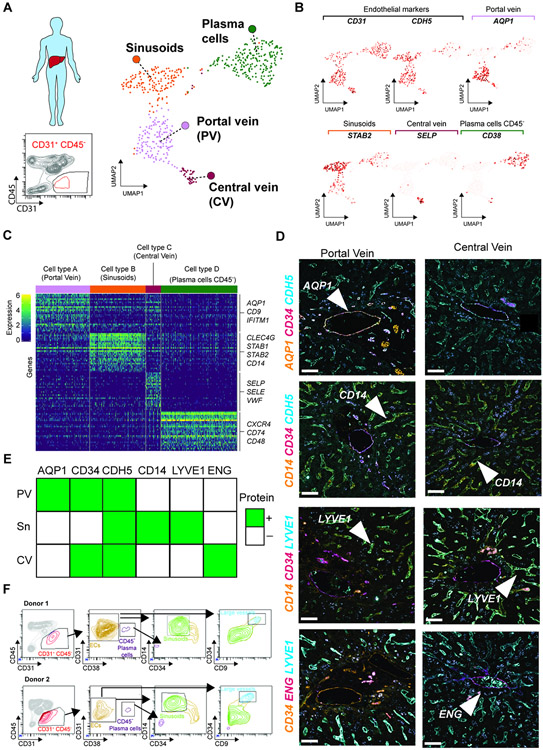
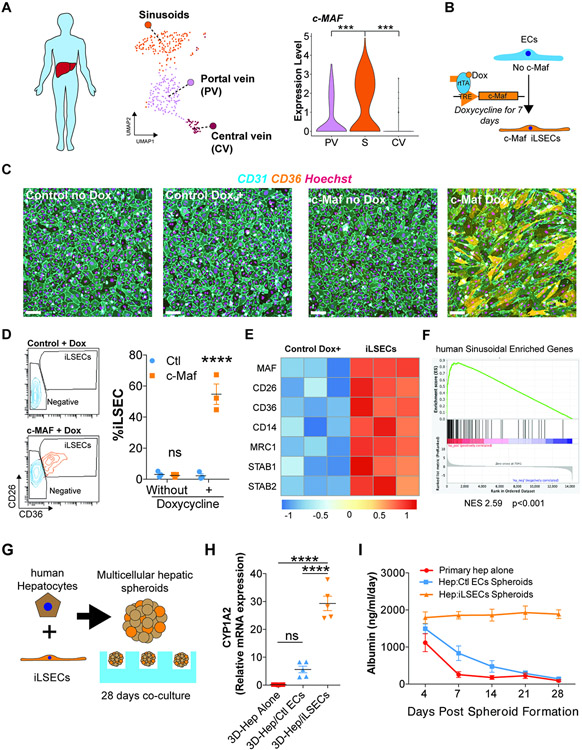
The liver vascular network is patterned by sinusoidal and hepatocyte co-zonation. How intra-liver vessels acquire their hierarchical specialized functions is unknown. We study heterogeneity of hepatic vascular cells during mouse development through functional and single-cell RNA-sequencing. The acquisition of sinusoidal endothelial cell identity is initiated during early development and completed postnatally, originating from a pool of undifferentiated vascular progenitors at E12. The peri-natal induction of the transcription factor c-Maf is a critical switch for the sinusoidal identity determination. Endothelium-restricted deletion of c-Maf disrupts liver sinusoidal development, aberrantly expands postnatal liver hematopoiesis, promotes excessive postnatal sinusoidal proliferation, and aggravates liver pro-fibrotic sensitivity to chemical insult. Enforced c-Maf overexpression in generic human endothelial cells switches on a liver sinusoidal transcriptional program that maintains hepatocyte function. c-Maf represents an inducible intra-organotypic and niche-responsive molecular determinant of hepatic sinusoidal cell identity and lays the foundation for the strategies for vasculature-driven liver repair.

Keywords: c-Maf; development; endothelial cell reprogramming; endothelial cell specification; fibrosis; hepatic angiocrine factors; liver sinusoidal endothelial cells; postnatal maturation; single-cell RNAseq; single-cell molecular profiling; vascular heterogeneity.


Conflict of interest statement

Declaration of interests S. Rafii is the co-founder and non-paid consultant to Angiocrine Bioscience, San Diego, CA. R.E.S. is on the scientific advisory board of Miromatrix Inc. and is a speaker and consultant for Alnylam Inc.

Figures

Figure 1.
Figure 1.. Liver vasculature progenitor diversification is acquired during transition from fetal to postnatal development.
(A) Uniform manifold approximation (UMAP) from ECs identified by scRNA-seq of sorted liver ECs (CD45negCD31+) at fetal and postnatal time points E12, E14,E16, E18, P2, P8, P15, and P30. Colors are assigned based on the sample time point as indicated in the upper panel. (B) UMAP labeling of the different EC populations identified from the scRNA-seq analysis from (A). Cv3, Cavin3+; PV, portal vein; CV, central vein; FS1-5, fetal sinusoidal EC populations; PS1-5, postnatal sinusoidal EC populations; P1-3, proliferating ECs; Chigh, Cxcl10 high expressing ECs. (C) Identification of specific markers associated to the EC populations identified from the scRNA-seq. (D) Transcriptional similarity analysis within portal vein, central vein, and sinusoids cell groups during fetal and postnatal development, as calculated by Pearson’s correlation coefficient (PCC) in the principal component space. (E) Vascular populations identified from the scRNA-seq ordered using pseudotime and plotted based on their predicted order. (F) Proportion of the contribution of Cavin3+ (Cv3), portal vein (PV), central vein (CV), or all sinusoids (S) per time point. Colors indicate the time point. (G) Diagram of the development of the liver vascular system following the observations from scRNA-seq. During early development (E12), the liver bud is infiltrated by the vitellin vein, umbilical vein, and sinus venosus. After this infiltration, the endothelium differentiates into the portal vein and the sinusoids. The central vein population is differentiated later in development, starting primarily at E18. During the progressive development of the liver, the sinusoidal transcriptome transitions from a fetal to an adult state. Colors are based on the identified populations in (B).
Figure 2.
Figure 2.. Liver vascular development is associated with a bi-sequential specification within a fetal to postnatal transition.
(A) Pseudotime analysis of the EC populations. Arrows show the directionality of changes associated with the transition from fetal to postnatal development. (B) Identification of the top 300 genes contributing to the changes over pseudotime. Colors correspond to an increase in change. (C) Gene ontology analysis of the genes contributing to fetal or postnatal pseudotime transition. (D) Analysis of the expression velocity of Mrc1 and Fcgr2b, measured as the ratio of spliced versus unspliced RNA over time, and the expression levels of these genes, derived from scRNA-seq. (E and F) Analysis of the percentage of ECs positive for Mrc1 (E) and Fcgr2b (F), of the ECs across the fetal E12, E14, E16, E18, and 4 weeks. Data represents n ≥ 7. Student’s t test analysis was performed comparing E12 to each individual time point, *p < 0.05, ***p < 0.001. (G) Average expression of the transcription factors driving the postnatal vascular transition from liver pseudotime in (B) within the EC of each organ obtained from the Tabula Muris database. Colors represent the average expression while size of the dot represents the percentage of cells where the expression was detected. (H) Violin plot showing expression of c-Maf within the EC clusters per time point from the scRNA-seq. (I and J) Flow cytometry analysis of the expression levels of c-Maf and Mrc1 (I) and c-Maf and Fcgr2b (J) in the liver ECs (n ≥ 5). Colors indicate the quadrant from the flow cytometry gating.
Figure 3.
Figure 3.. c-Maf choreographs the acquisition of sinusoidal attributes during maturation of immature liver capillaries.
(A) c-Mafflox/flox mice were crossed with VEcadherin(Cdh5)-CreErt2 mice, induced with tamoxifen from E12 to E14, to generate c-MafDEC mice and analyzed at the E16 developmental time point. Fetal embryos and livers from control and c-MafΔEC mice are shown. Scale bars 500 μm. (B) Flow cytometry analysis of the vasculature showing the deletion specificity of c-Maf within the ECs. Student’s t test analysis ***p < 0.001 (n = 12). (C) Flow cytometry analysis of the expression of c-Maf and Mrc1 at E16.5 in control and c-MafΔEC mice. (D) Analysis of the medium fluorescence intensity of Mrc1 expression in ECs in the control and c-MafΔEC mice. Student’s t test analysis ***p < 0.001 (n ≥ 15). (E) Flow cytometry analysis of the expression of c-Maf and Fcgr2b at E16.5 in control and c-MafΔEC mice. (F) Analysis of the percentage of ECs positive for Fcgr2b in the control and c-MafΔEC mice. 5Student’s t test analysis ***p < 0.001 (n ≥ 15). (G) Immunofluorescence analysis of the vascular markers Aqp1, Lyve1, and Emcn in control and c-MafΔEC mice at E16.5 of development, induced as shown in (A) from n = 5 mice. “C” represents central vein and “P” represents portal vein. Scale bars: 100 μm.
Figure 4.
Figure 4.. c-Maf postnatal deficiency overextends the restricted hematopoietic liver sojourn through an aberrant vascular arterialization.
(A) Analysis of the influence of c-Maf on postnatal liver vascular development was performed by 4-hydroxytamoxifen administration from P2 to P4 and at P8 and analyzed at P15 in control and c-MafΔEC mice. Flow-assisted cell sorting (FACS) was performed for the gated CD45+ CD31neg hematopoietic, and CD45negCD31+ endothelial cell populations, as indicated on the flow chart, from control and c-MafΔEC mice. (B) ScRNA-seq of the hematopoietic and EC-sorted populations from (A) was performed. UMAP labeling of the different endothelial and hematopoietic populations identified: endothelial populations: sinusoids (S 1–2), KO-sinusoids (KO-S 1–3), cycling (C), and portal vein (PV); hematopoietic populations: CLPs, cycling – CLP (CLP-C), B cells (B 1–3), T cells (T 1–3), leukocytes (L 1–5), and Kupffer cells (K); contaminant cells were identified as: doublets (D) and hepatocytes (H). (C) Expression of c-Maf in the endothelial and Kupffer cell clusters of control and c-MafΔEC mice. (D) Proportion analysis shows identification of the generation of a unique clusters of cells within the c-MafΔEC mice associated with the c-Maf-deficient cells. (E) Flow cytometry analysis of the percentage of Ki67 positive cells within the ECs. Student’s t test analysis *p < 0.05 (n ≥ 4). (F) Pseudotime analysis of the EC populations. Arrows show the directionality of changes associated with the transition between different cells. The top right panel shows the associated pseudotime per sample. (G) Partition-based graph abstraction analysis of transition confidence between EC clusters in either control or c-MafΔEC mice. (H) Volcano plot of the differentially expressed genes between the control and c-MafΔEC mice. Several genes associated with the sinusoidal cell and portal vein populations are shown. Colors indicate fold change in expression: red – increased and blue – decreased. (I) Immunofluorescence staining of Sca1 and Lyve1 in control and c-MafΔEC mice. Representative image of n = 5, scale bars 100 μm. Arrows indicate loss of Lyve1 and presence of Sca1 in sinusoids. “PV” represents portal vein and “CV” represents central vein. (J) Quantification by flow cytometry of the expression levels of Fcgr2b in control versus c-MafΔEC mice. Student’s t test analysis ***p < 0.001 (n ≥ 10). (K) Hematoxylin and eosin staining of control and c-MafΔEC livers. Arrows and circles show areas with increased deposition of hematopoietic cells. Representative images of n = 5. Scale bars: 100 μm. (L) Percentage of cells in the cluster of CLPs identified from the scRNA-seq in (B). Fisher test ***p<0.001. (M) Flow cytometry analysis previously gated on CD45+CD45RA+ cells positive for CD24a and CD20 were defined as CLPs and B cells (B1, B2-3). Student’s t test analysis *p < 0.05 (n ≥ 5).
Figure 5.
Figure 5.. c-Maf adult vascular deficiency aberrantly induces a Portal Vein signature of the capillaries and facilitates stress-induced liver fibrosis.
(A) Induction of c-Maf deficiency in c-Mafflox/floxVEcadherin(Cdh5)-CreERT2 mice specifically in vascular endothelium was performed by tamoxifen administration after P30 using 3 days on, 3 days off, and 3 days on protocol, to generate c-MafΔEC mice. (B) Analysis of vascular ECs shows c-Maf deletion within the endothelium. Student’s t test analysis ***p < 0.001 (n ≥ 11). (C) Flow cytometry analysis of the percentage of Ki67 positive cells within the ECs. Student’s t test analysis *p < 0.05 (n = 5). (D) Bulk RNA-seq analysis of adult liver ECs isolated from control and c-MafΔEC mice, showing the differential expression signatures between them. (E) GSEA analysis of the postnatal sinusoidal gene list from population PS5 identified in Figure 1B. The analysis shows a decrease in the expression of sinusoidal genes associated within the c-MafΔEC mice. (F) GSEA analysis of the portal vein gene list from population PV identified in Figure 1B. The analysis shows an increase in the expression of these genes within the c-MafΔEC mice. (G and H) Flow cytometry quantification of the medium fluorescence intensity of sinusoidal marker Mrc1 (G) and Ly6a/Sca1 (H) expression in control and c-MafΔEC mice. Student’s t test analysis ***p < 0.001 (n ≥ 11). (I and J) Immunofluorescence analysis of the expression of liver vascular markers Mrc1, Ly6a/Sca1, Lyve1, Emcn, and Aqp1 in control and c-MafΔEC mice. Representative image from n = 5. Scale bars, 100 μm. “CV” represents central vein, “PV” represents portal vein. Arrows show expression of Ly6a and Emcn within the sinusoids in I and J, respectively. (K) Representative images of Masson’s trichrome from n = 3 of control and c-MafΔEC mice under basal conditions. A small fraction of fibrosis deposition could be observed surrounding the portal vein, both in the control and the c-MafΔEC mice. Scale bars: 100 μm. (L) Induction of fibrosis using CCl4 treatment in control and c-MafΔEC mice 1 month after deletion was induced. Representative images of Masson’s trichrome from n ≥ 9 of control and c-MafΔEC mice, showing the fibrotic deposition in blue. Image shows a zoom region from a tile scan of the whole liver. The white dashed line follows the fibrosis area. Scale bars 200 μm. (M) Quantification of the percentage of fibrosis over the total tissue area of control and c-MafΔEC mice. Student’s t test analysis **p < 0.01 (n ≥ 9).
Figure 6.
Figure 6.. Human liver EC subpopulations can be identified by the expression of unique differential markers acquired by immunofluorescence and flow cytometry.
(A) Human liver CD45negCD31+ cells were sorted and analyzed by scRNA-seq analysis (n = 1). UMAP analysis of the EC compartment from the human liver sorted as CD45negCD31+ cells. Colors represent each population identified, based on their differentially expressed markers. (B) ScRNA-seq analysis of human liver CD45negCD31+ cells identified four clusters based on the expression of specific markers such as CD31, CDH5, AQP1, STAB2, SELP, or CD38. We used the co-expression of both CD31 and CDH5 to identify the ECs. These four clusters were associated with the portal vein, sinusoids, central vein, and putative hematopoietic plasma cells (CD45negCD38+). (C) Identification of the expression of cluster-associated specific markers between each subpopulation represented as a heatmap. Colors show the varying expression levels of each gene per cell. (D) Immunofluorescence validation of the vascular markers identified by single-cell RNA-seq analysis allows the identification of specific markers associated with the portal vein, sinusoids, or central vein based on the expression of Aqp1, Cd34, Cdh5, Cd14, Lyve1, and Eng. Arrows represent the labeling of the gene in a particular population. Representative images from 3 patients. Scale bars, 100 μm. (E) Table representing the identification of protein expression by immunofluorescence on the portal vein (PV), sinusoids (S), or central vein (CV) in the human liver. Green color indicates positive identification of expression in (D). (F) Identification by flow cytometry of the different vascular subpopulations found in the scRNA-seq, based on the expression of the surface markers CD45, CD31,CD38, CD14, CD34, and CD9, performed in two different human liver samples.
Figure 7.
Figure 7.. c-Maf induces a pro-regenerative liver signature in vascular ECs, enabling long-term sustenance of co-cultured hepatocytes.
(A) Expression of c-Maf in the EC subpopulations from the human single-cell analysis. UMAP represents the different EC populations identified. The results show an enrichment in the sinusoidal population (S) compared with the portal vein (PV) and central vein (CV). Student’s t test comparison between total cells per cluster from n = 1 sample, ***p < 0.001. (B) Diagram representing the induction of c-Maf overexpression in human ECs in vitro using an inducible doxycycline system for 7 days. (C) Immunofluorescence analysis of the expression of CD31 and CD36 in ECs transduced with a lentivirus control or lentivirus overexpressing c-Maf under the control of doxycycline. Nuclei are stained with Hoechst. Analysis of cell cultures of control and c-Maf cells, with or without doxycycline, for 7 days. Representative image of n = 3. Scale bars, 100 μm. (D) Flow cytometry identification and quantification of induced LSECs (iLSECs) after the administration of doxycycline. Cells overexpressing c-Maf acquire elevated expression of CD26 and CD36. Representative flow of n = 3 (different donors). Data are presented as mean ± SEM. Two-way ANOVA ****p < 0.0001 (n = 3). (E) Bulk RNA-seq analysis of control and iLSECs treated for 7 days with doxycycline. Heatmap shows differential expression analysis between the iLSEC sorted population overexpressing c-Maf and control cells from n = 3 donor cells. (F) GSEA analysis of the expression values of the human sinusoidal enriched genes from Figure 6A identified an upregulation of the sinusoidal signature in the iLSECs. (G) Representation of the co-culture of human hepatocytes and iLSECs to generate spheroids. (H) qRT-PCR results indicating relative CYP1A2 expression at day 28 of the co-culture of human hepatocytes (Hep) with ECs (control or iLSECs) or hepatocytes alone. Data are presented as mean ± SEM. One-way ANOVA, ****p < 0.0001 (n = 5). (I) ELISA quantification of the expression of albumin over the 28-day co-culture of hepatocytes (Hep) with ECs (control or iLSECs). Data are presented as mean ± SEM (n = 5).

Comment in

References

    1. Adelson RP, Palikuqi B, Weiss Z, Checco A, Schreiner R, Rafii S, and Rabbany SY (2021). Morphological characterization of Etv2 vascular explants using fractal analysis and atomic force microscopy. Microvasc. Res 138, 104205. - PMC - PubMed
    1. Augustin HG, and Koh GY (2017). Organotypic vasculature: From descriptive heterogeneity to functional pathophysiology. Science 357. - PubMed
    1. Bankston PW, and Pino RM (1980). The development of the sinusoids of fetal rat liver: morphology of endothelial cells, Kupffer cells, and the transmural migration of blood cells into the sinusoids. Am. J. Anat 159, 1–15. - PubMed
    1. Barberá-Guillem E, Arrue JM, Ballesteros J, and Vidal-Vanaclocha F (1986). Structural changes in endothelial cells of developing rat liver in the transition from fetal to postnatal life. J. Ultrastruct. Mol. Struct. Res 97, 197–206. - PubMed
    1. Barry DM, McMillan EA, Kunar B, Lis R, Zhang T, Lu T, Daniel E, Yokoyama M, Gomez-Salinero JM, Sureshbabu A, et al. (2019). Molecular determinants of nephron vascular specialization in the kidney. Nat. Commun 10, 5705. - PMC - PubMed

Publication types

Substances