Review
. 2022 Jun:213:102268.
doi: 10.1016/j.pneurobio.2022.102268. Epub 2022 Mar 29.

Early brain activity: Translations between bedside and laboratory

Affiliations
Review

Early brain activity: Translations between bedside and laboratory

Heiko J Luhmann et al. Prog Neurobiol. 2022 Jun.

Abstract

Neural activity is both a driver of brain development and a readout of developmental processes. Changes in neuronal activity are therefore both the cause and consequence of neurodevelopmental compromises. Here, we review the assessment of neuronal activities in both preclinical models and clinical situations. We focus on issues that require urgent translational research, the challenges and bottlenecks preventing translation of biomedical research into new clinical diagnostics or treatments, and possibilities to overcome these barriers. The key questions are (i) what can be measured in clinical settings versus animal experiments, (ii) how do measurements relate to particular stages of development, and (iii) how can we balance practical and ethical realities with methodological compromises in measurements and treatments.

Keywords: Animal model; Biomarker; Cerebral cortex; Development; Human; Neuronal activity.


Figures

Figure 1
Figure 1
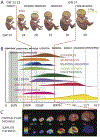
Time frame of the development of the human brain. A: At term gestation (GW 37) the newborn infant is about 3-5 kg and its brain is around 317-421 g. Premature and extremely premature babies can weigh less than 500 g and their brain is less than 100 g. The viability at extremely premature birth GW22-23 is very low. B: Relative timing of cortical neurogenesis, gliogenesis, neuronal migration, axonal growth, synaptogenesis, cell death, myelination shows gradient in various cortical areas (indicated in different shades). Myelination can continue in frontal cortical areas unto adolescence. The largely transient subplate peaks mid fetal life and largely removed around birth. Cortical thickness peaks around 12 years of age, although this depends on the exact cortical area, occipital faster, compared to frontal areas. C: The relative thickness of cortical plate and subplate changes with age during prenatal development. Thickness of cortical plate (upper row) and subplate compartment (bottom row) measured in millimeters (color coded bars on the left, thicker red, thinner blue) at 15, 18, 20, 26, 32, and 42 GW (left to right). (Reproduced with permission from (Vasung et al., 2016).
Fig. 2.
Fig. 2.
Spatial and temporal scales of experimental and clinical techniques. A, Range of spatial resolution and measurement scale and temporal resolution and observation window for research (blue) and (red) clinical techniques as well as EEG which encompasses both. B, Examples of spatial resolution of research techniques such as patch clamp recordings and Ca2+ imaging (from (Meng et al., 2017; Meng et al., 2020b), and clinical EEG of a term infant monitoring with sparse electrodes or detailed assessment with a dense EEG array.
Fig. 3.
Fig. 3.
Development of network activity in rodent and human cerebral cortex. A, Depth profile of sensory evoked activity in P0 rat barrel cortex in vivo. Mechanical stimulation of a single whisker evokes spindle burst activity recorded with a 16-channel electrode. The averaged current-source-density plot was calculated from 10 spindle bursts. Note early sink in subplate corresponding to source in cortical plate. From (Yang et al., 2009). B, Development of spontaneous network activity in mouse visual cortex in vivo. LFP recorded in L4 and MUA recorded in channels up to 200 μm above and below L4. With maturation spindle bursts (blue traces) and low frequency activity (red traces) show higher frequency and background activity becomes stronger. From (Shen and Colonnese, 2016). C, EEG activity during quiet sleep in a preterm infant at 32 weeks of postmenstrual age shows intermittent high amplitude bursts with poor spatial synchrony between cortical sites or left vs right hemispheres (LH and RH, respectively). D, Same infant as in figure C recorded two months later at term equivalent age, showing changes in increased number, amplitude and shape of bursts, and enhanced synchronization across cortical areas. Note the larger amplitudes in preterm infant.
Fig. 4.
Fig. 4.
Changing circuits in the developing thalamocortical system and effects of insults on cortical EEG. A, Graphs show connections between thalamus and cortex and within the cortex during development. Subplate neurons are the first targets of developing thalamic projections. B, Altered circuits in pathological conditions. C, Schematic illustration of the main components and their hemispheric relationships (L, red, left; R, blue, right) in a spontaneous EEG activity during normal human development. In early premature infants, EEG shows very low amplitude continuous activity interrupted by brief high amplitude bursts, spontaneous activity transients (SATs), with nested oscillatory activity at higher frequencies. The SATs are poorly synchronized between hemispheres (arrows). At term age, the continuous EEG activity has become higher amplitude and the SAT events are longer duration, more complex and more synchronized across cortical areas. At post-neonatal age, the EEG activity shows continuous activities at higher frequencies and the intermittent SAT type activities have disappeared. D, Hypoxia-ischemia (HI, left) and stroke (right) induced pathophysiological EEG patterns in newborn infants evolve over hours and days after incident. HI induces an immediate decrease in all EEG activity, followed by a gradual and incomplete recovery through burst suppression to continuous EEG over hours or days. Seizures may also occur during this period. After few days at latest, the SATs are still asynchronized between hemispheres and their shape may be altered while intervals maybe increased. A larger stroke induces an immediate suppression of EEG activities near ischemic zone, as well as a frequent occurrence of seizures (asterisk). During recovery, EEG amplitudes would increase to normal level, however the SATs/bursts remain asynchronous between hemispheres and their shape may be altered. C modified from (Vanhatalo and Kaila, 2006).

References

    1. Adle-Biassette H, Golden JA, Harding B, 2017. Developmental and perinatal brain diseases. Handb Clin Neurol 145, 51–78. - PubMed
    1. Ahtola E, Stjerna S, Tokariev A, Vanhatalo S, 2020. Use of complex visual stimuli allows controlled recruitment of cortical networks in infants. Clin Neurophysiol 131, 2032–2040. - PubMed
    1. Allievi AG, Arichi T, Tusor N, Kimpton J, Arulkumaran S, Counsell SJ, Edwards AD, Burdet E, 2016. Maturation of Sensori-Motor Functional Responses in the Preterm Brain. Cereb Cortex 26, 402–413. - PMC - PubMed
    1. An S, Kilb W, Luhmann HJ, 2014. Sensory-evoked and spontaneous gamma and spindle bursts in neonatal rat motor cortex. J. Neuroscience 34, 10870–10883. - PMC - PubMed
    1. André M, Lamblin MD, d'Allest AM, Curzi-Dascalova L, Moussalli-Salefranque F, The SN, Vecchierini-Blineau MF, Wallois F, Walls-Esquivel E, Plouin P, 2010. Electroencephalography in premature and full-term infants. Developmental features and glossary. Neurophysiol. Clin 40, 59–124. - PubMed

Publication types