. 2022 Apr 11;9(2):ENEURO.0490-21.2022.
doi: 10.1523/ENEURO.0490-21.2022. Print 2022 Mar-Apr.

Investigation of Neural Substrates of Erroneous Behavior in a Delayed-Response Task

Affiliations

Investigation of Neural Substrates of Erroneous Behavior in a Delayed-Response Task

Soyoung Chae et al. eNeuro. .

Abstract

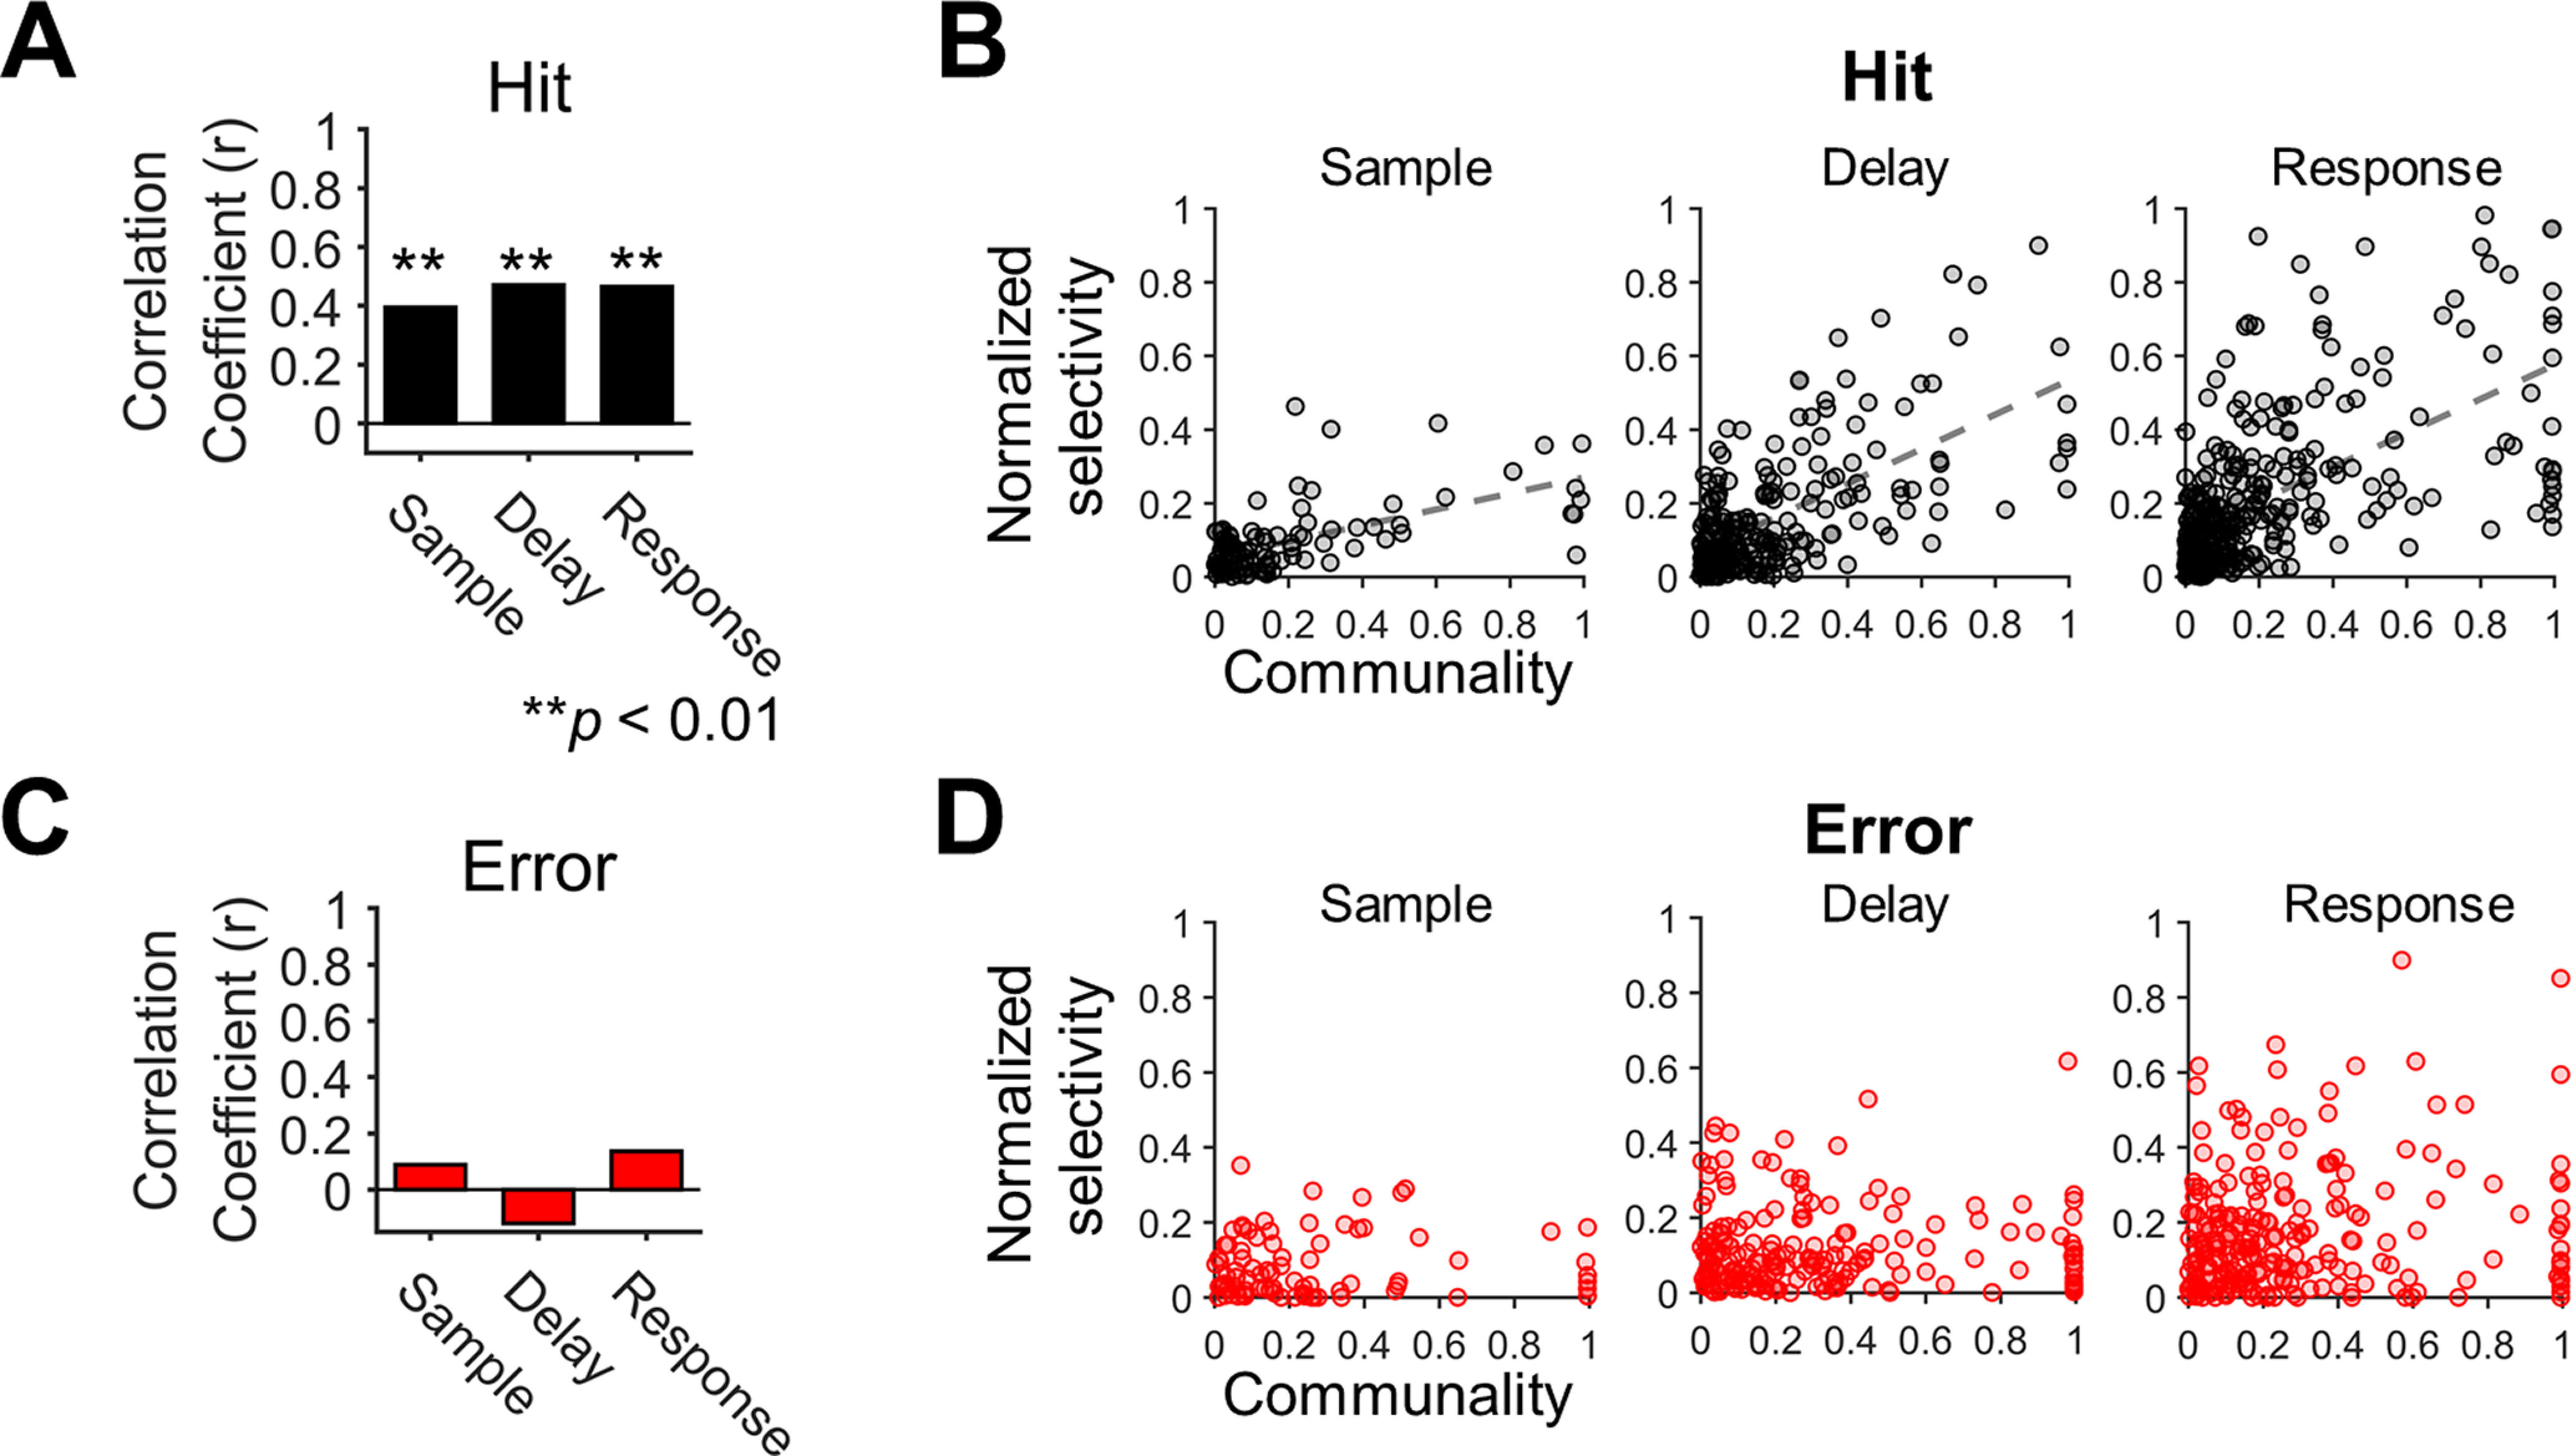
Motor cortical neurons exhibit persistent selective activities (selectivity) during motor planning. Experimental perturbation of selectivity results in the failure of short-term memory retention and consequent behavioral biases, demonstrating selectivity as a neural characteristic of encoding previous sensory input or future action. However, even without experimental manipulation, animals occasionally fail to maintain short-term memory leading to erroneous choice. Here, we investigated neural substrates that lead to the incorrect formation of selectivity during short-term memory. We analyzed neuronal activities in anterior lateral motor cortex (ALM) of mice, a region known to be engaged in motor planning while mice performed the tactile delayed-response task. We found that highly selective neurons lost their selectivity while originally nonselective neurons showed selectivity during the error trials where mice licked toward incorrect direction. We assumed that those alternations would reflect changes in intrinsic properties of population activity. Thus, we estimated an intrinsic manifold shared by neuronal population (shared space), using factor analysis (FA) and measured the association of individual neurons with the shared space by communality, the variance of neuronal activity accounted for by the shared space. We found a positive correlation between selectivity and communality over ALM neurons, which disappeared in erroneous behavior. Notably, neurons showing selectivity alternations between correct and incorrect licking also underwent proportional changes in communality. Our results demonstrated that the extent to which an ALM neuron is associated with the intrinsic manifolds of population activity may elucidate its selectivity and that disruption of this association may alter selectivity, likely leading to erroneous behavior.

Keywords: error behavior; motor planning; premotor cortex; preparatory activity; selectivity; short-term memory.


Figures

Figure 1.
Figure 1.
Disruption of selective ALM activity tuned to the licking direction during erroneous behavior. A, A schematic diagram for the tactile delayed-response task. In the sample period, a tactile cue represented as a pole position at either anterior or posterior whiskers was given for 1.3 s to indicate the upcoming reward (water) direction. The anterior cue was associated with the left direction whereas the posterior cue was with the right. Mice should not move but wait during a 1.3-s delay period and began to lick toward either the left or right direction after hearing an auditory go cue. B, Four possible behavioral results from the delayed-response task depending on the match between the tactile cue (anterior vs posterior) and licking direction (left vs right): HL, ER, EL, and HR. ER (left) denotes erroneous movement to the left (right) given a right-directing (left-directing) cue. C, No significant difference in the behavioral performance of the tactile delayed-response task between licking directions (p >0.1, two-tailed paired t test, n = 22). Error bars, SEM across the mice. n.s.: not significant. D, Examples of the selective firing activities (i.e., selectivity) of three representative ALM neurons when mice performed the tactile delayed-response task, for each of the four cases of behavioral outcomes (HL, HR, ER, and EL). Each neuron showed peak activity in a particular period when the task goal (left or right direction) agreed with its selectivity (left or right) and when mice behaved correctly (HL and HR). This selective firing activity became more ambiguous when mice behaved wrongfully (ER and EL). Also, differences in activities between HR and HL in a particular period were large in the hit trials (top), which was less apparent in the error trials (bottom). E, Differences in the firing activity of the ALM neurons showing selectivity between licking directions. Contra-preferring neurons denote the ALM neurons with selectivity to the right direction (note: left ALM neurons were recorded) and ipsi-preferring neurons do for the left direction. Differences in firing activities of these neurons between licking directions were shown in the hit and error trials, based on the fold changes from baseline activity (*p <0.05, **p <0.01, Bonferroni-corrected post hoc test). While the neurons exhibited significant differences between the directions for every period in the hit trials (left), such differences mostly disappeared in the error trials (right). Error bars, SEM across the neurons.
Figure 2.
Figure 2.
Changes in selectivity of ALM neurons between correct and erroneous behavior. A, Distributions of selectivity in the correct (hit) and erroneous (error) trials for each period (sample, delay, and response). Black dots represent individual neuronal selectivity in the hit and the error trials. Gray lines connecting each pair of the black dots indicate the selectivity change of the corresponding neuron between the hit and error trials. The vertically oriented shadings indicate the sample distributions of selectivity for hit (gray) or error (pink) trials, respectively. While individual neuronal selectivity was decreased or increased across the hit and error trials, there was no significant difference in the distribution of the selectivity between the hit and error trials (K-S test, p >0.05) for every period. B, 10% of the ALM neurons, marking the top 5% contra-preferring and the top 5% ipsi-preferring selectivity in the hit trials (black dots), significantly decreased their selectivity in the error trials (red dots) for every period (one-tailed paired t test, p <10−6). The gray lines indicate selectivity changes between hit and error trials of each neuron. C, 10% of the ALM neurons, marking the top 5% contra-preferring and the top 5% ipsi-preferring selectivity in the error trials (black dots), significantly decreased their selectivity in the hit trials (red dots) for every period (one-tailed paired t test, p <0.01). The gray lines indicate selectivity changes between hit and error trials of each neuron.
Figure 3.
Figure 3.
Reversed firing modulation of ALM neurons. A, The schematic diagram illustrating reversed firing modulation (see Materials and Methods). If (hypothetic) neurons decrease firing rates in the error trials in response to a preferred cue that originally increases the firing rates in the hit trials and vice versa, neurons are deemed to exhibit reversed firing modulation. For example, with reversed firing modulation, neurons that show higher firing rates for correct right licking (HR) than for correct left licking (HL) would decrease firing rates in response to a right directional cue for erroneous left licking (ER; left) while increase firing rates in response to a left directional cue (EL; middle). If two neurons with similar selectivity exhibit reversed firing modulation, their firing rates would be correlated even over the error trials as well as over the hit trials (right). B, Examples of correlated firing rates of two ALM neurons showing reversed firing modulation. In the hit trials, two contra-preferring neurons (neurons #3 and #10, session ALM219031) similarly increased firing rates when the posterior cue was given, showing a high correlation (r =0.85) between their firing rates over the hit trials (left). But in the error trials, both neurons increased firing rates when the anterior cue was given, such as ipsi-preferring neurons, showing again a high correlation (r =0.81) over the error trials (middle). Yet, such a correlation disappeared in the error trials when the trial order was shuffled (right). C, Correlations between neurons showing reversed firing modulation. Pearson correlation coefficient was calculated between all pairwise combinations of the neurons showing reversed firing modulation (for the criterion to determine a neuron with reversed firing modulation, see Materials and Methods) for the hit and error trials, respectively, in each period. The average correlation coefficient was not significantly different between the hit and error trials (two-tailed paired t test, p >0.1) in the delay and response periods, or greater over the error trials than over the hit trials in the sample period (one-tailed paired t test, sample: p <0.05). N denotes the total number of neurons showing reversed firing modulation summed over the sessions. Pair denotes the sum of the number of all possible pairs of such neurons calculated session-wise (e.g., if N =2 in session 1 and N =3 in session 2, then Pair = 2C2 + 3C2 = 5). Note that N and Pair should remain the same across the hit and error trials in a given period. Error bars, SEM across pairs. n.s.: not significant.
Figure 4.
Figure 4.
Neural representations of task-relevant information in the shared space of ALM neurons. A, Examples of the task-related information representation in the shared space composed of the latent variables 1 and 2 (LV1 and LV2; top: hit trials, bottom: error trials). Each dot represents the 2D values of the latent variables resulting from the FA of the firing rates of ALM population at each trial. In the hit trials, the latent variables (especially LV1) distinctly represented the target direction information (HR or HL) in all the periods, which became less apparent in the error trials. B, The FR between the two groups of the values corresponding to each target direction was calculated for each latent variable (LV1 and LV2), and compared among the hit, error and randomly shuffled trials (ANOVA, *p <0.05, **p <0.01, Bonferroni-corrected post hoc t test). Randomly shuffling was performed for the hit trials. Error bars, SEM across sessions. C, The schematic diagram for illustrating the testing of consistent emergence of task-related information in the shared space (for detailed descriptions, see Materials and Methods). A shared space is first built using HITtrain data, followed by the projection of HITtest data onto that shared space (HITtrain data: ALM neurons’ firing rate data from a part of the hit trials used for training the FA model; HITtest: ALM neurons’ firing rate data from the remaining hit trials not used for training). Whether the representation of task-related information in the shared space is consistent throughout the trials is evaluated by two distances: (1) same-cue distance (left; between the same cues) and (2) opposite-cue distance (right; between the different cues). Distance is measured by the FR between the two groups of the latent variable values corresponding to the train and test data, respectively (for LV1 and LV2 each). If the shared space consistently represents the target direction information across trials, then the same-cue distance would remain small while the opposite-cue distance would remain large between HITtrain and HITtest. This test is also applied between HITtrain and ERRtest, where ERRtest indicates ALM neurons’ firing rate data from the error trials. D, Examples of the task-related information represented in the shared space. As a standard, HITtrain was projected onto the shared space built using the same data of HITtrain(top). Each dot represents the projection outcome in each trial. HITtest and ERRtest were projected onto the shared space constructed by HITtrain, respectively (middle and bottom). E, The same-cue and opposite-cue distances measured by the FR for each latent variable (LV1 and LV2) in each period. First, the opposite cue distance using HITtrain only was measured as the standard distance value (black). Then, the same-cue and opposite-cue distances were measured for HITtest (gray) and ERRtest (red), respectively. Note that the opposite-cue distance using HITtrain only was measured by the FR of HITtrain on the shared space built using the same HITtrain. Each of the same-cue and opposite-cue distances was compared with the standard distance value (one-tailed paired t test), *p <0.05, **p <0.01. Error bars, SEM across sessions.
Figure 5.
Figure 5.
Selectivity in firing rates and shared signals of ALM neurons. A, Venn diagrams of the number of neurons showing selectivity in each period. FR+ denotes the neurons that have selectivity in firing rates (top: contra-preferring neuron; bottom: ipsi-preferring neuron). FR+SH+ denotes then neurons that have selectivity in both firing rates and shared signals (for the description of the shared signal of a neuron, see Materials and Methods). B, For the FR+SH+ neurons, selectivity in shared signals (SelSH) is greater in magnitude than selectivity in firing rates (Selectivity) in every period (top, one-tailed paired t test, ps < 0.05 for every period). Linear regression of Selectivity against SelSH yielded significant linear fits (bottom, ps<0.05), with every slope <1 in each period.
Figure 6.
Figure 6.
Alteration of selectivity in erroneous behavior is related to alteration of latent variables while relations between firing rates and latent variables are unchanged. A, The scatter plots of reconstructed SelSH and original SelSH in the hit trials. Each dot denotes each session. Reconstructed SelSH was the selectivity of the shared signals reconstructed by the loading matrix (U) obtained from the hit trials and latent variables (z) obtained from the error trials. A significant correlation was observed between reconstructed SelSH and original SelSH only in the delay period (p <0.01), where the correlation coefficient was negative (r = −0.33). The negative correlation indicates that z in the error trials were reversely formed, thus generating altered selectivity (see the text for more details). B, The scatter plots of reconstructed SelSH and original SelSH in the hit trials. Different from A, the shared signals were now reconstructed using U obtained from the error trials and z from the hit trials. For every period, reconstructed SelSH and original SelSH were positively correlated (ps < 0.01).
Figure 7.
Figure 7.
Selectivity of individual neurons is positively correlated with their communality to the shared space. A, Correlations between communality and selectivity in the hit trials. The communality and selectivity across individual neurons were positively correlated in every period (r, Pearson’s correlation coefficient, **p <0.01). B, The scatter plots of communality and selectivity across individual neurons in the hit trials. The dashed lines indicate significant regression lines obtained from linear regression (ps < 0.01). Each circle reflects a single neuron. Note that selectivity was normalized before calculating correlations to compare the differences between neurons regardless of the session. C, Correlations between communality and selectivity in error trials. No significant correlation was observed in any period (ps > 0.1). D, The scatter plots of communality and selectivity across individual neurons in the error trials. Linear regression revealed no significant linear relationships between communality and selectivity (ps > 0.1). Each circle reflects a single neuron.
Figure 8.
Figure 8.
Changes in communality between correct and incorrect behavior. A, Distributions of communality in the correct (hit) and erroneous (error) trials for each period (sample, delay, and response). Black dots reflect the communality of single neurons in the hit and the error trials. Gray lines connecting each pair of dots between the hit and error trial indicates communality change of the corresponding neuron between the hit and error trials. The vertically oriented shadings indicate sample distributions of selectivity for hit (gray) or error (pink) trials, respectively. The K-S test showed that the cumulative density function of communality in the hit trials was significantly smaller than that in the error trials (ps < 10−4 for every period). B, Neurons with the top 10% highest communality in the hit trials significantly decreased their communality in the error trials for every period (one-tailed paired t test, p <0.01). Gray lines indicate communality changes from the hit to the error trials of single neurons. C, Neurons with the top 10% highest communality in the error trials significantly decreased their communality in the hit trials for every period (one-tailed paired t test, p <0.01). Gray lines indicate communality changes from the hit to the error trials of single neurons.
Figure 9.
Figure 9.
Altered selectivity of ALM neurons with motor planning error is related to altered communality. A, Correlations between the mean communality change and the mean selectivity change from the hit to the error trials, where the mean was estimated over the population of neurons in each session, were calculated across sessions (r, Pearson’s correlation coefficient). A significant correlation was observed only in the delay period (***p < 10–3). B, The scatter plots of the mean communality differences and the mean selectivity differences in each period. Each dot reflects each session. The dashed regression line was obtained from linear regression (p <0.01).

Similar articles

Cited by

References

    1. Allen WE, Kauvar IV, Chen MZ, Richman EB, Yang SJ, Chan K, Gradinaru V, Deverman BE, Luo L, Deisseroth K (2017) Global representations of goal-directed behavior in distinct cell types of mouse neocortex. Neuron 94:891–907.e4. 10.1016/j.neuron.2017.04.017 - DOI - PMC - PubMed
    1. Amedi A, Hofstetter S, Maidenbaum S, Heimler B (2017) Task selectivity as a comprehensive principle for brain organization. Trends Cogn Sci 21:307–310. 10.1016/j.tics.2017.03.007 - DOI - PubMed
    1. Athalye VR, Ganguly K, Costa RM, Carmena JM (2017) Emergence of coordinated neural dynamics underlies neuroprosthetic learning and skillful control. Neuron 93:955–970.e5. 10.1016/j.neuron.2017.01.016 - DOI - PubMed
    1. Athalye VR, Santos FJ, Carmena JM, Costa RM (2018) Evidence for a neural law of effect. Science 359:1024–1029. 10.1126/science.aao6058 - DOI - PubMed
    1. Banerjee A, Long MA (2017) Ready, steady, go! Imaging cortical activity during movement planning and execution. Neuron 94:698–700. 10.1016/j.neuron.2017.05.002 - DOI - PubMed

Publication types

LinkOut - more resources