. 2022 Dec;71(12):2561-2573.
doi: 10.1136/gutjnl-2021-325013. Epub 2022 Apr 1.

NFATc1 signaling drives chronic ER stress responses to promote NAFLD progression

Affiliations

NFATc1 signaling drives chronic ER stress responses to promote NAFLD progression

Muhammad Umair Latif et al. Gut. 2022 Dec.

Abstract

Objectives: Non-alcoholic fatty liver disease (NAFLD) can persist in the stage of simple hepatic steatosis or progress to steatohepatitis (NASH) with an increased risk for cirrhosis and cancer. We examined the mechanisms controlling the progression to severe NASH in order to develop future treatment strategies for this disease.

Design: NFATc1 activation and regulation was examined in livers from patients with NAFLD, cultured and primary hepatocytes and in transgenic mice with differential hepatocyte-specific expression of the transcription factor (Alb-cre, NFATc1c.a . and NFATc1Δ/Δ ). Animals were fed with high-fat western diet (WD) alone or in combination with tauroursodeoxycholic acid (TUDCA), a candidate drug for NAFLD treatment. NFATc1-dependent ER stress-responses, NLRP3 inflammasome activation and disease progression were assessed both in vitro and in vivo.

Results: NFATc1 expression was weak in healthy livers but strongly induced in advanced NAFLD stages, where it correlates with liver enzyme values as well as hepatic inflammation and fibrosis. Moreover, high-fat WD increased NFATc1 expression, nuclear localisation and activation to promote NAFLD progression, whereas hepatocyte-specific depletion of the transcription factor can prevent mice from disease acceleration. Mechanistically, NFATc1 drives liver cell damage and inflammation through ER stress sensing and activation of the PERK-CHOP unfolded protein response (UPR). Finally, NFATc1-induced disease progression towards NASH can be blocked by TUDCA administration.

Conclusion: NFATc1 stimulates NAFLD progression through chronic ER stress sensing and subsequent activation of terminal UPR signalling in hepatocytes. Interfering with ER stress-responses, for example, by TUDCA, protects fatty livers from progression towards manifest NASH.

Keywords: fatty liver; hepatic fibrosis; inflammation; nonalcoholic steatohepatitis.


Conflict of interest statement

Competing interests: None declared.

Figures
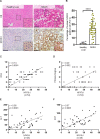
Figure 1
Figure 1
Hepatocyte-specific NFATc1 activation in progressive non-alcoholic liver disease (NAFLD). (A) Sections of healthy human liver (n=8) and non-alcoholic steatohepatitis (NASH) (n=46) were analysed by H&E staining and immunohistochemistry for NFATc1. Representative images are shown, scale bar=50 µm. (B) Percentage of nuclear NFATc1-positive hepatocytes per field of view in samples from healthy liver and NASH. Statistical analysis was performed by unpaired t-test. Data are shown as mean±SD, ****p≤0.0001. Simple linear regression analysis revealed a significant correlation of hepatic NFATc1 expression levels with (A) NAS (NAFLD activity score), (B) the degree of fibrosis, (C) ALT levels and (D) AST levels.
Figure 2
Figure 2
NFATc1 induction and non-alcoholic fatty liver disease (NAFLD) progression in western diet (WD) fed mice. (A) Schematic representation of the diet feeding protocol. Eight weeks old C57BL/6 wild-type mice were treated with either control diet (CD) or WD for 20 weeks. (B) Mice were sacrificed, and liver sections were analysed by H&E staining and immunohistochemical analysis for (C) CD45, (D) picrosirius red and (E) NFATc1 expression. Representative results are shown. Scale bars=100 µm. Quantification analyses were performed, and results were illustrated as percentage of CD45-positive cells, percentage of picrosirius red stained area and the percentage of nuclear NFATc1-positive hepatocytes in livers sections obtained from CD-treated and WD-treated mice (n=5). Statistical analysis was performed by unpaired t-test. Data are shown in mean±SD, **p<0.005, ***p<0.0005, ****p<0.0001. (F) Representative western blot of NFATc1 expression in liver tissue lysates of 20 weeks old mice treated with either CD (n=3, lane 1–3) or WD (n=3, lane 4–6). Each lane represents liver lysates from individual mice. WD-treated mice express high levels of active NFATc1, indicated by strong increase of the lower band.
Figure 3
Figure 3
NFATc1 activation in hepatocytes drives liver inflammation and fibrosis. (A) Schematic depiction of genetically modified mice with hepatocyte-specific NFATc1 expression (Alb-Cre; NFATc1c.a . (NFATc1c.a .) or deletion Alb-Cre; NFATc1Δ/Δ (NFATc1Δ/Δ )) along with the feeding schedule for 4, 12 and 20 weeks, respectively. (B) H&E analysis of liver sections from CD (left) and WD (right) treated mice are shown (n=5). Scale bar=100 µm. Representative images of immunohistochemical analysis and quantification for (C–D) CD45, (E–F) picrosirius red staining and (G–H) oil-red-o staining in the livers of 20-week CD-treated and WD-treated NFATc1Δ/Δ , Alb-Cre and NFATc1c.a . mice (n=5). Statistical analysis was performed by two-way analysis of variance and data are shown as mean±SD where p values are *p<0.05, **p<0.005, ***p<0.0005.
Figure 4
Figure 4
Lipotoxic fatty acids cause NFATc1 activation. (A–B) Expression of NFATc1 mRNA in (A) primary mouse hepatocytes and (B) AML12 cells following treatment with 100 µM (+) and 200 µM (++) palmitate (pal.) for 12 hours. NFATc1 gene expression was analysed by qRT-PCR and is shown as ‘relative mRNA levels’ compared with untreated control. (C–D) Induction of NFATc1 protein expression in (C) primary mouse hepatocytes and (D) AML12 cells treated with 100 µM (+) and 200 µM (++) palmitate (pal.) for 12 hours. The lower band represents the active state of NFATc1. (E) Dual luciferase reporter gene assay was performed in hepatocytes from Alb-cre mice to verify palmitate induced transcriptional activation of NFATc1. Cells were cotransfected with an NFAT responsive promoter luciferase reporter construct in combination with either an empty vector or NFATc1 wild-type (NFATc1wt) expression vector, and subsequently treated with 200 µM palmitate (pal.) for 24 hours. (F) NFATc1 immunofluorescence in AML12 cells demonstrating nuclear translocation of the transcription factor following treatment with 200 µM palmitate for 12 hours. Scale bar=100 µm. (G) Quantitative analysis of palmitate-induced nuclear NFATc1 localisation in AML12 cells. Statistical analysis was performed by one-way analysis of variance (ANOVA) (A, B), two-way ANOVA (E) and by unpaired t-test (G). Data are shown as mean±SD, *p≤0.05, **p≤0.005 and ****p≤0.0001.
Figure 5
Figure 5
NFATc1 regulated gene signatures and signalling mechanisms. (A) Representative western blot and qRT-PCR showing successful NFATc1 transfection and expression in AML12 cells. (B) Heatmap depicting z-scores of significantly differentially expressed genes in RNA-Seq analysis on NFATc1 overexpression in AML12 cells. (C) Reactome pathway classification analysis demonstrating the most significantly regulated NFATc1 gene signatures in AML12 cells identified by RNA-Seq (log2fold values≥0.5/≤−0.5; p≤0.05; base mean>10). (D) qRT-PCR validation of differentially regulated candidate genes on NFATc1 activation in AML12 cells. Data are shown in mean±SD, p values are *p<0.05, **p<0.005. Statistical analysis was performed by unpaired t-test.
Figure 6
Figure 6
Nuclear NFATc1 promotes terminal unfolded protein response (UPR) signalling. (A) Immunoblot examination showing protein levels of NFATc1, pPERK, PERK, pPKR, PKR, ATF4, TRB3, p-Eif2α, Eif2α and CHOP in AML12 cells following 12 hours of palmitate (+=200 µM) exposure either alone or in combination with knock-down for NFATc1 (siNFATc1). (B) Densitometry graphs for pPERK/PERK and pPKR/PKR in AML12 cells treated with palmitate (200 µM) alone or in combination with siNFATc1. (C) Schematic illustration of primary hepatocytes isolation from transgenic mice with differential NFATc1 expression and subsequent palmitate treatment. (D) Representative western blot showing NFATc1-dependent protein levels of pPERK, PERK, pPKR, PKR, ATF4, TRB3, p-Eif2α, Eif2α and CHOP in primary hepatocytes. (E) Primary mouse hepatocytes were exposed to palmitate (+=100 µM and ++=200 µM) for 12 hours and alterations in pPERK, PERK, pPKR, PKR, ATF4, TRB3, p-Eif2α, Eif2α and CHOP levels were analysed by immunoblot. (F) Western blot analysis were conducted using liver tissue lysates from CD-treated and WD-treated genetically modified mice (GEM) models to determine fat-induced and NFATc1-dependent expression of pPERK, PERK, pPKR, PKR, ATF4, TRB3, p-Eif2α, Eif2α and CHOP.
Figure 7
Figure 7
NFATc1-dependent cell death and inflammasome activation in vitro and in vivo. (A) Representative immunoblot displaying NFATc1-dependent changes in NLRP3, cleaved caspase-1 (CC-1), cleaved caspase 3 (CC-3), cleaved interleukin (IL)-1β, C.GSDMD and GSDMD (Gasdermin D) in primary hepatocytes following 12 hours of palmitate treatment (+=100 µM and ++=200 µM). (B) Immunofluorescence analysis of NLRP3 and (C) CC-3 in primary mouse hepatocytes after palmitate treatment. Scale bar=100 µm. (D) Graphs represent fluorescence intensity of NLRP3 and percentage of CC-3 positive hepatocytes (F.O.V). (E) Immunohistochemical analysis of CC-3 staining in liver sections of 20-week-treated mice. Scale bar=100 µm. (F) Quantitative analysis of CC-3 positive hepatocytes (F.O.V). Data are shown in mean±SD; p-values are *p<0.05, ****p<0.0001. Statistical analysis was performed using one-way analysis of variance (ANOVA) (D) and two-way ANOVA (F). CD, control diet; WD, western diet.
Figure 8
Figure 8
Tauroursodeoxycholic acid (TUDCA) attenuates NFATc1-dependent unfolded protein response (UPR) signalling-induced inflammation and fibrosis in progressive non-alcoholic liver disease (NAFLD). (A) Immunoblot shows protein expression of CHOP, NLRP3 and CC-3 in Alb-cre primary hepatocytes treated with palmitate (++=200 µM) alone or in combination with increasing concentrations of TUDCA (100–500 µM) in comparison to control-treated cells. (B) Protein levels of CHOP, NLRP3 and CC-3 were assessed in AML12 cells with constitutive activation of NFATc1 and in the presence or absence of 500 µM TUDCA for 12 hours. Cells transfected with siNFATc1 were used as control. (C) Schematic representation of the preventive treatment scheme. (D) Immunoblot showing protein levels of CHOP and NLRP3 in liver tissue lysates of 20 weeks treated Alb-cre mice and NFATc1c.a . mice. (E) H&E staining and immunohistochemical analysis for (F) CD45 and (G) picrosirius red staining. Scale bar=100 µm. (H) Graph represents percentage of CD45 positive cells and (I) percentage of picrosirius red stained area (F.O.V). Data are shown in mean±SD, p values are *p<0.05, **p<0.005, ***p<0.0005, ****p<0.0001. Statistical analysis was performed by two-way analysis of variance.

References

    1. Wong RJ, Aguilar M, Cheung R, et al. . Nonalcoholic steatohepatitis is the second leading etiology of liver disease among adults awaiting liver transplantation in the United States. Gastroenterology 2015;148:547–55. 10.1053/j.gastro.2014.11.039 - DOI - PubMed
    1. Younossi ZM, Stepanova M, Afendy M, et al. . Changes in the prevalence of the most common causes of chronic liver diseases in the United States from 1988 to 2008. Clin Gastroenterol Hepatol 2011;9:524–30. e1. 10.1016/j.cgh.2011.03.020 - DOI - PubMed
    1. Lebeaupin C, Vallée D, Hazari Y, et al. . Endoplasmic reticulum stress signalling and the pathogenesis of non-alcoholic fatty liver disease. J Hepatol 2018;69:927–47. 10.1016/j.jhep.2018.06.008 - DOI - PubMed
    1. Byrne CD, Targher G. Nafld: a multisystem disease. J Hepatol 2015;62:S47–64. 10.1016/j.jhep.2014.12.012 - DOI - PubMed
    1. Dowman JK, Tomlinson JW, Newsome PN. Pathogenesis of non-alcoholic fatty liver disease. QJM 2010;103:71–83. 10.1093/qjmed/hcp158 - DOI - PMC - PubMed

Publication types

LinkOut - more resources