Review
. 2022 Apr 1;7(1):111.
doi: 10.1038/s41392-022-00960-w.

Clinical and translational values of spatial transcriptomics

Affiliations
Review

Clinical and translational values of spatial transcriptomics

Linlin Zhang et al. Signal Transduct Target Ther. .

Abstract

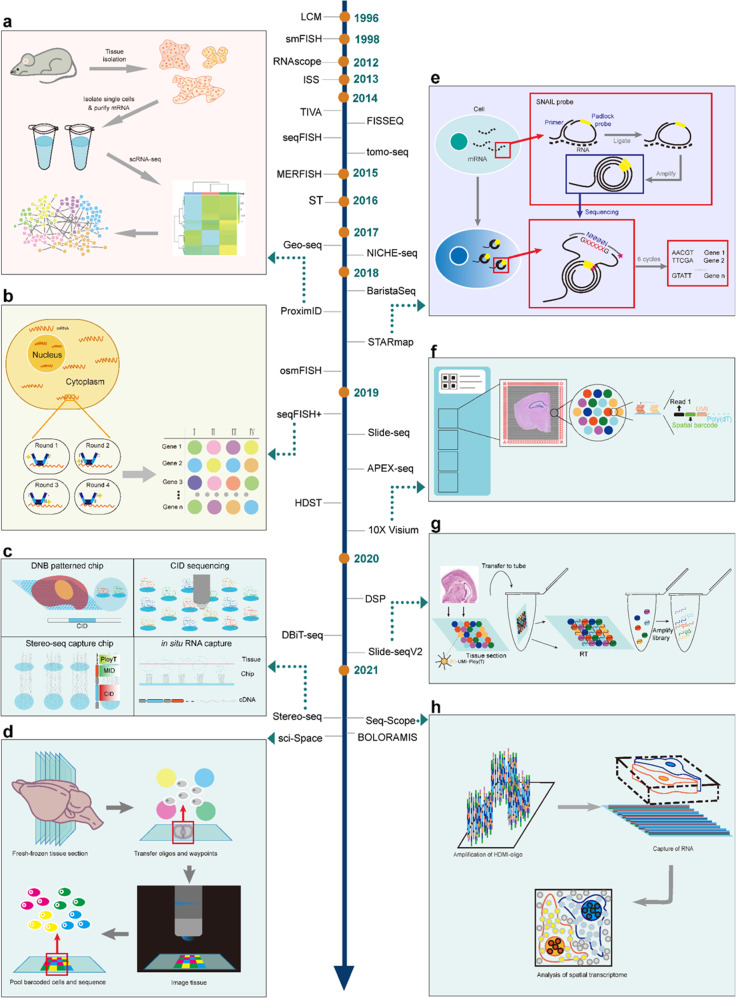
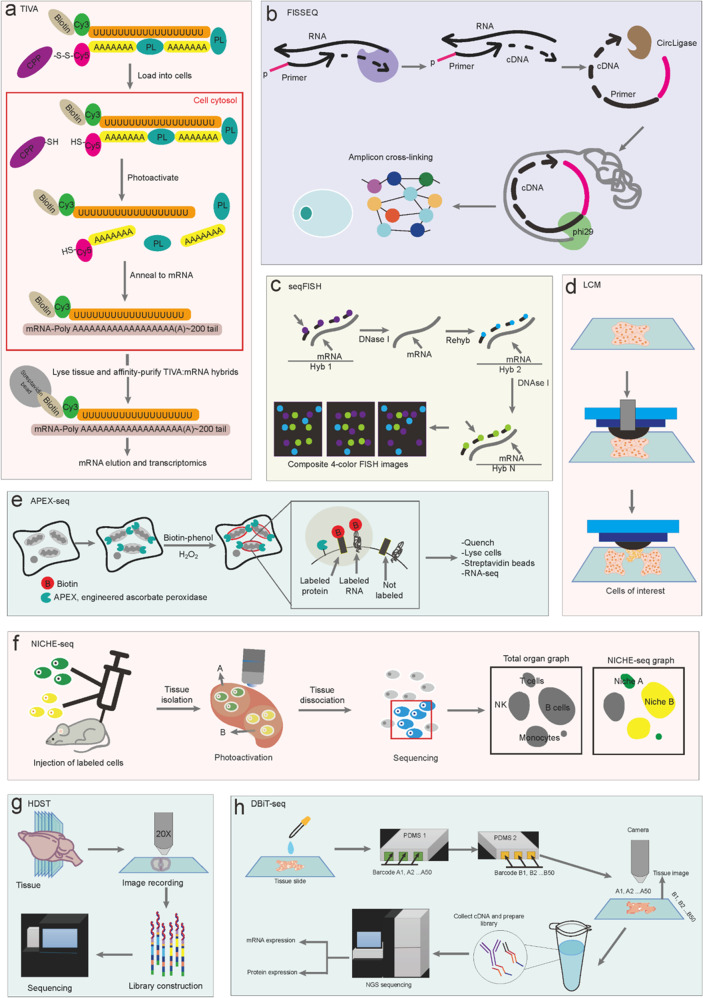
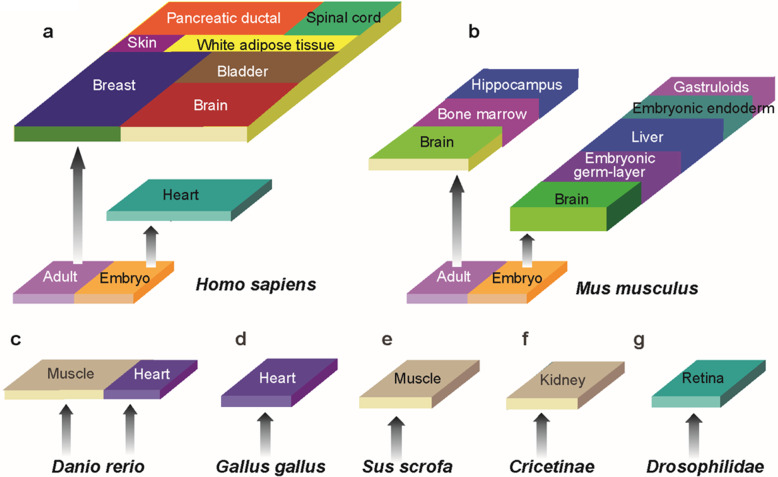
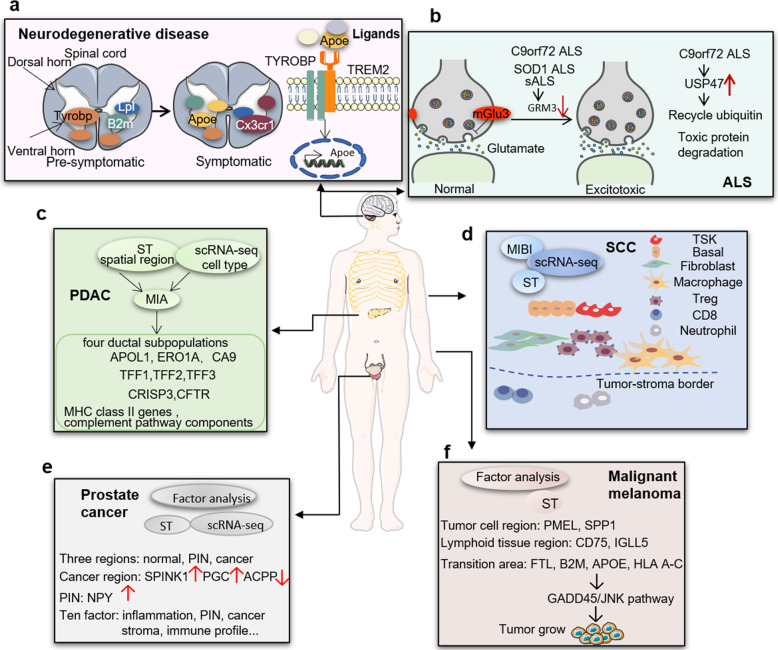
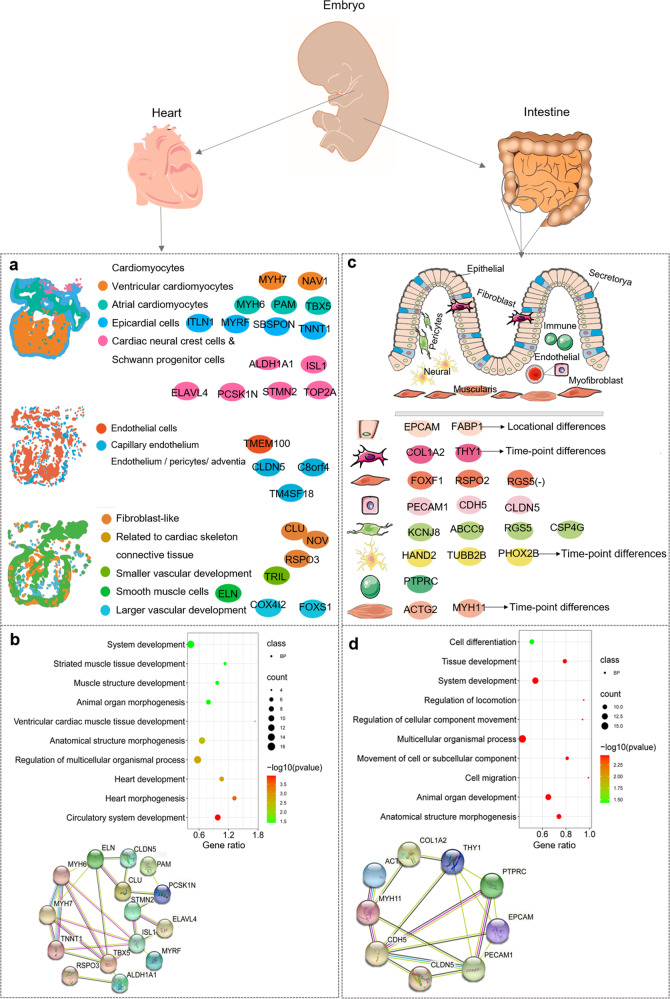
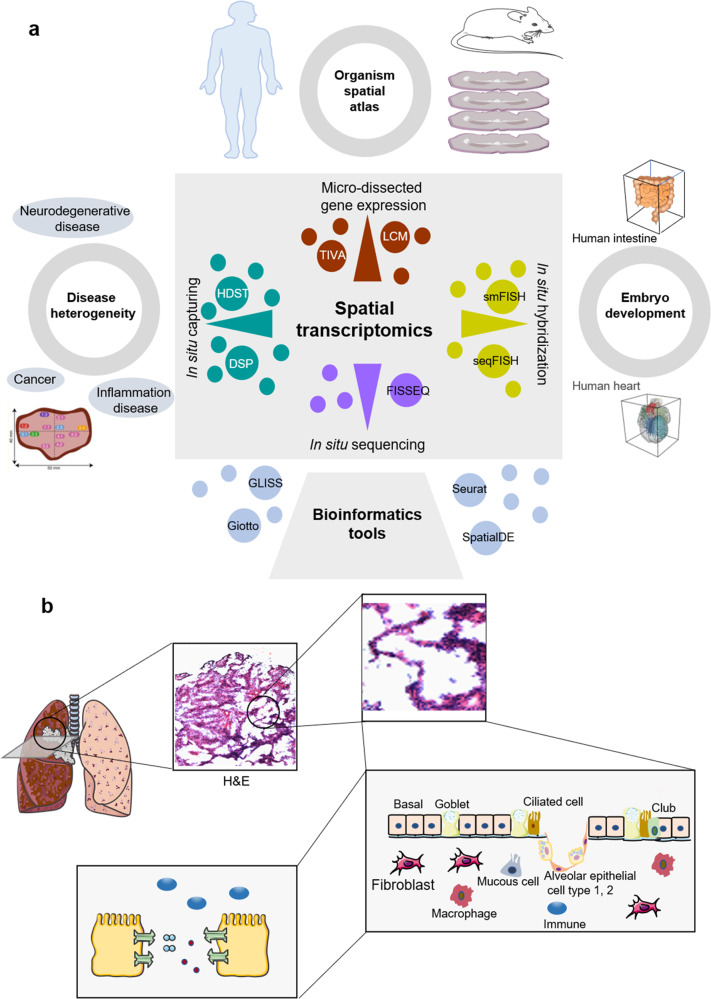
The combination of spatial transcriptomics (ST) and single cell RNA sequencing (scRNA-seq) acts as a pivotal component to bridge the pathological phenomes of human tissues with molecular alterations, defining in situ intercellular molecular communications and knowledge on spatiotemporal molecular medicine. The present article overviews the development of ST and aims to evaluate clinical and translational values for understanding molecular pathogenesis and uncovering disease-specific biomarkers. We compare the advantages and disadvantages of sequencing- and imaging-based technologies and highlight opportunities and challenges of ST. We also describe the bioinformatics tools necessary on dissecting spatial patterns of gene expression and cellular interactions and the potential applications of ST in human diseases for clinical practice as one of important issues in clinical and translational medicine, including neurology, embryo development, oncology, and inflammation. Thus, clear clinical objectives, designs, optimizations of sampling procedure and protocol, repeatability of ST, as well as simplifications of analysis and interpretation are the key to translate ST from bench to clinic.


Conflict of interest statement

The authors declare no competing interests.

Figures

Fig. 1
Fig. 1
Development of spatial transcriptomic technologies. Representative technologies were exhibited with detailed schematic diagram, including ProximID, STARmap, seqFISH+, 10× Visium, Slide-seqV2, Stereo-seq, Seq-Scope and sci-Space. The development of ST technologies was shown in the middle part with method names and years. a The principle from cell isolation to interaction networks for ProximID; b The principle of repeated in situ hybridizations for seqFISH+; c The principle of Stereo-seq; d The principle of sci-Space from fresh-frozen sectioning, oligos and waypoints transferring, and pooled barcoded cell positioning and sequencing, to imaging and reading; e The principle of in situ mRNA preparation, SNAIL probe function, and in situ sequencing for STARmap; f The principle of in situ capturing from tissue grids to spot selection, from sample setting to quality control, and from partial reads to spatial barcodes for 10× Visium; g The principle of Slide-seqV2 from tissue coating to library amplification; h The principle of Seq-Scope from high-definition map coordinate identifier (HDMI)-oligo amplification to RNA capture from frozen section to achieve spatial transcriptome analysis at the single cell levels
Fig. 2
Fig. 2
Technical procedures of spatial transcriptomic measurements based on various principles. a Procedures from cell loading, photoactivation, mRNA annealing, hybrids, and elution to transcriptomic sequencing TIVA; b Procedures from reverse transcription, cDNA linking, circularizing, rolling circle replication, and amplicon cross-linking to sequencing for FISSEQ; c Procedures from repeated FISH probe hybridization and digestion to FISH imaging for seqFISH; d Procedures from sample coating and selection to capture of target area for LCM; e Procedures from biotin-phenol labeling of proteins and genes to RNA-seq for APEX-seq; f NICHE-seq includes labeled cells injection, tissue isolation, dissociation, and sequencing of photoactivated cells. g Procedures from tissue section, image recording, and library preparation to sequencing for HDST; h Procedures from DNA-antibody conjugating, barcoding, tissue imaging, and library construction to sequencing for DBiT-seq
Fig. 3
Fig. 3
Representative spatial transcriptomics studies across multiple species. a Representative ST studies in tissues of Homo sapiens; b Representative ST studies in tissues of Mus musculus; c Representative ST studies in tissues of Danio rerio; d Representative ST studies in tissues of Gallus gallus; e Representative ST studies in tissues of Sus scrofa; f Representative ST studies in tissues of Cricetinae; g Representative ST studies in tissues of Drosophilidae.
Fig. 4
Fig. 4
Spatial transcriptomics provide new insights for understanding molecular mechanisms of human diseases and preclinical disease models. a In neurodegenerative disease models, Trem2 and Tyrobp form a receptor complex that can trigger phagocytosis or regulate cytokine signaling, when bound by membrane lipids or lipoprotein complexes. Tyrobp expression is up-regulated before symptoms and before Trem2 expression in the ventral horn and white matter. Lp1 and B2m are up-regulated before symptoms, especially in the ventral horn. Apoe and Cx3cr1 are up-regulated in the spinal cord of symptomatic mice. Apoe expression is driven by Trem2 signal and the ligand of Trem2. b In amyotrophic lateral sclerosis (ALS) models, expression of GRM3 gene in the prefrontal lobe and motor cortex was lower in C9orf72 repeat expansion, mutant SOD1, and sALS. The GRM3 gene encodes mGlu3, a metabotropic glutamate receptor, regulates the neurotransmission of glutamate in the central nervous system. The expression of neuronal mGlu3 receptor is mainly at presynaptic terminals. When the extrasynaptic glutamate overflows excessively, the G protein signaling cascade is activated to regulate the activity of presynaptic ion channels, followed by negatively regulating the release of presynaptic glutamate. The regulation that the decrease of mGlu3 receptor expression in the prefrontal cortex increases the transmission of glutamate and produces excitotoxicity may be a common mechanism feature between schizophrenia and ALS. c Spatial positions of different subgroups are identified and mapped within cell type in the entire tissue by integrating scRNA-seq and MIA. A total of four ductal subgroups are identified, including ductal population, terminal ductal population, centroacinar duct population, and antigen-presenting duct cells, respectively expressing APOL1, ERO1A and CA9 genes; TFF1, TFF2 and TFF3; CRISP3 genes; CD74, HLA -DPA1, HLA-DQA2, HLA-DRA, HLA-DRB1 and HLA-DRB5, and C1S, C4A, C4B, CFB and CFH genes. d The combined application of spatial transcriptomics, scRNA-seq, and MIBI demonstrates that TSK cells and basal tumor cells are located on the leading edge. Fibroblasts, macrophages and Tregs are most abundant at the tumor-stroma boundary, while CD8 T cells and neutrophils are largely excluded from the tumor, indicating that the localization of Tregs may prevent effector lymphocytes into the tumor. e The gene expression in 3 regions obtained by factor analysis is applied for identifying region-specific markers in normal, cancer and PIN region. Enrichment of SPINK1 and PGC, the depletion of ACPP, and the increase of NPY level in the PIN area are observed in cancer areas. In addition, the interaction between factors was determined by hierarchical clustering of ten factors. These ten factors include normal glands signature, normal glands, stroma, inflammation, PIN, cancer, immune profile, proximity to PIN signature, and mix of prostatic atrophy and stroma et al. f In malignant melanoma models, PMEL and SPP1 overexpressed in tumor cell clusters, and the lymphoid tissue regions from and adjacent to tumor cell regions were characterized by the expression of immune-related genes CD74 and IGLL5, respectively. FTL, B2M, APOE and HLA-related genes (HLA A-C) express in the transition zone and related to tumor growth regulation through the GADD45/JNK pathway
Fig. 5
Fig. 5
Spatial transcriptomics with scRNA-seq present new cell types and molecular markers in human embryonic development. a scRNA-seq analysis of cardiac embryonic tissue shows three types cardiomyocytes (cardiac neural crest cells & Schwann progenitor cells, epicardial cells, ventricular and atrial cardiomyocytes), two types of endothelial cells (capillary endothelium, endothelium/pericytes/adventia) and four types of fibroblast-like cells (related to cardiac skeleton connective tissue, smaller vascular development, smooth muscle cells, larger vascular development). Spatial transcriptome combined with scRNA-seq reveals location distribution and gene markers of each cell type. Cell types and genes are screened based on the reference, combined with differentially expressed genes in scRNA-Seq clusters and spatially heterogeneous gene panel. b GO (BP: biological process) analysis of heart cell type-specific genes and protein interaction networks (https://cn.string-db.org/). c Spatiotemporal analysis of human intestinal development at single-cell resolution identify nine intestinal compartments including epithelial, fibroblast, endothelial, pericytes, neural, muscularis, mesothelium, myofibroblast, and immune cells. Each type cells have specific gene markers, of which some have location and time-point differences in gene expression. FABP1 expresses specifically in epithelial cells and over-expresses in colon. HMGA2, MYH11, and PHOX2B down-express consistently in colon and terminal ileum. Intestinal cell signature genes are identified according to Supplemental Table 1 of the reference, which exhibit specific key genes expression in each cell types. d GO (BP: biological process) analysis of intestinal cell type-specific genes and protein interaction networks (https://cn.string-db.org/)
Fig. 6
Fig. 6
Summary of workflows during applications for spatial transcriptomics. a Spatial transcriptomics techniques are mainly used to solve spatial heterogeneity of diseases, biological spatial transcriptome map, and embryonic development spatial blueprint. The four ST techniques include micro-dissected gene expression, in situ hybridization, in situ sequencing and in situ capturing. Different techniques are used according to different sample characteristics and needs, and a variety of biological tools are used for analysis. b A simulation diagram of tumor microenvironment. ST technology assists in understanding the spatial location of tumor cells and gene expression as well as intercellular molecular communication between cells within the microenvironment. For example, H&E staining in lung tissue provides sample pathological information and assesses sample quality, and further integrates cell grouping and location information analysis such as basal, goblet, ciliated cell, alveolar epithelial cells type 1, 2 and other cells, so as to provide a better understanding of the molecular communication mechanisms in the cellular microenvironment

Similar articles

Cited by

References

    1. Wang X, Fan J. Spatiotemporal molecular medicine: a new era of clinical and translational medicine. Clin. Transl. Med. 2021;11:e294. - PMC - PubMed
    1. Wang X, Fan J. Spatiotemporal molecular imaging is a critical part of spatiotemporal molecular medicine. Clin. Transl. Med. 2021;11:e347. - PMC - PubMed
    1. Wang X. Clinical trans-omics: an integration of clinical phenomes with molecular multiomics. Cell Biol. Toxicol. 2018;34:163–166. - PubMed
    1. Liao J, Lu X, Shao X, Zhu L, Fan X. Uncovering an organ’s molecular architecture at single-cell resolution by spatially resolved transcriptomics. Trends Biotechnol. 2021;39:43–58. - PubMed
    1. Stahl PL, et al. Visualization and analysis of gene expression in tissue sections by spatial transcriptomics. Science. 2016;353:78–82. - PubMed

Publication types