. 2022 Apr 1;13(1):1748.
doi: 10.1038/s41467-022-29363-9.

Long-chain ceramides are cell non-autonomous signals linking lipotoxicity to endoplasmic reticulum stress in skeletal muscle

Affiliations

Long-chain ceramides are cell non-autonomous signals linking lipotoxicity to endoplasmic reticulum stress in skeletal muscle

Ben D McNally et al. Nat Commun. .

Abstract

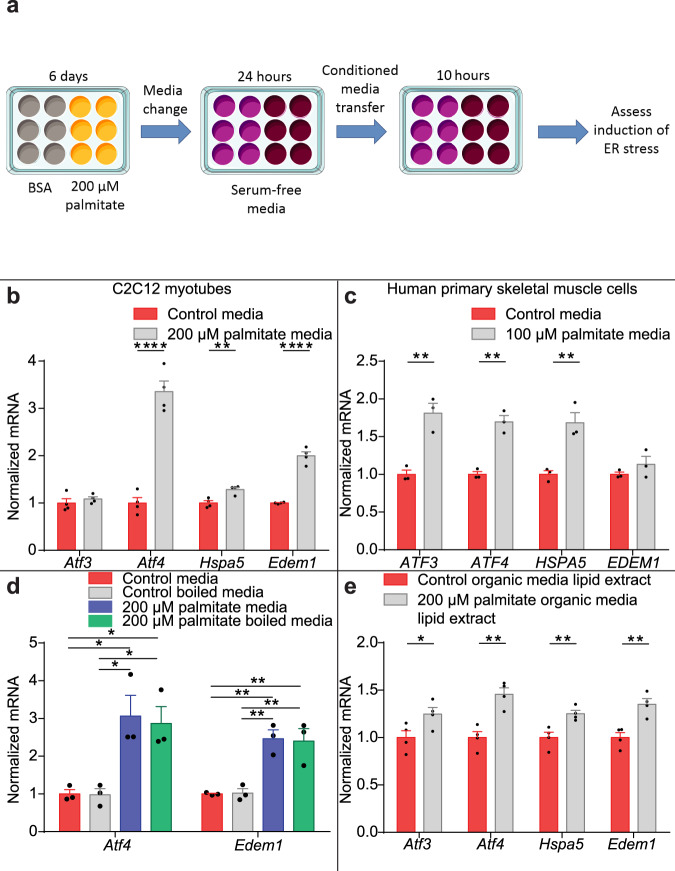
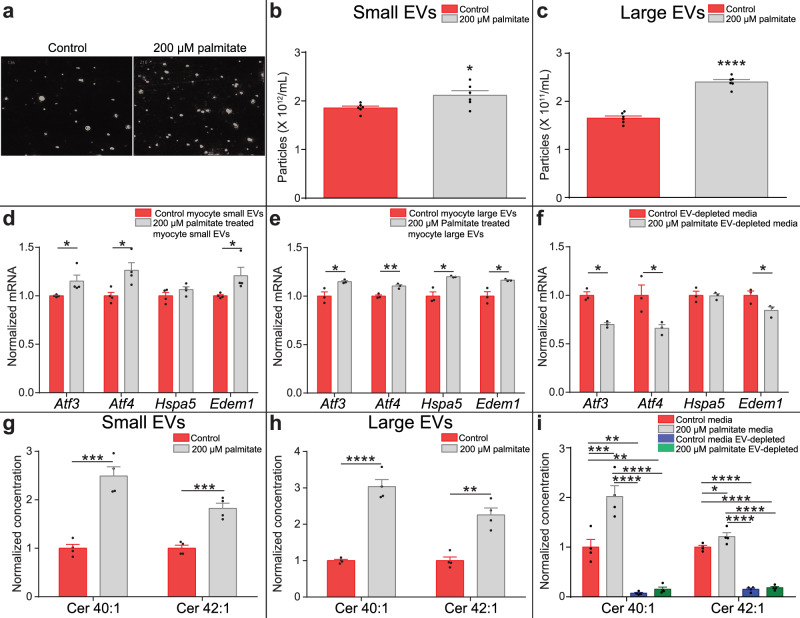
The endoplasmic reticulum (ER) regulates cellular protein and lipid biosynthesis. ER dysfunction leads to protein misfolding and the unfolded protein response (UPR), which limits protein synthesis to prevent cytotoxicity. Chronic ER stress in skeletal muscle is a unifying mechanism linking lipotoxicity to metabolic disease. Unidentified signals from cells undergoing ER stress propagate paracrine and systemic UPR activation. Here, we induce ER stress and lipotoxicity in myotubes. We observe ER stress-inducing lipid cell non-autonomous signal(s). Lipidomics identifies that palmitate-induced cell stress induces long-chain ceramide 40:1 and 42:1 secretion. Ceramide synthesis through the ceramide synthase 2 de novo pathway is regulated by UPR kinase Perk. Inactivation of CerS2 in mice reduces systemic and muscle ceramide signals and muscle UPR activation. The ceramides are packaged into extracellular vesicles, secreted and induce UPR activation in naïve myotubes through dihydroceramide accumulation. This study furthers our understanding of ER stress by identifying UPR-inducing cell non-autonomous signals.


Conflict of interest statement

The authors declare no competing interests.

Figures

Fig. 1
Fig. 1. Myotubes secrete a cell non-autonomous unfolded protein response (UPR) -inducing lipid signal in response to lipotoxicity.
a C2C12 myotubes were treated with 200 µM palmitate or bovine serum albumin (BSA) vehicle, serum-free media was conditioned on these cells (24 h) and transferred to naïve myocytes. b Activating transcription factor 3 (Atf3), activating transcription factor 4 (Atf4), Heat Shock Protein Family A (Hsp70) Member 5 (Hspa5) and ER Degradation Enhancing Alpha-Mannosidase Like Protein 1 (Edem1) UPR gene expression in C2C12 myotubes receiving conditioned media from myotubes treated with 200 μM palmitate (grey) or BSA (red) (n = 4; two-tailed Student’s t test; Atf4 P = 0.00009, Hspa5 P = 0.005, Edem1 P = 0.000024). c UPR gene expression in human skeletal muscle cells (HSkMCs) receiving conditioned media from HSkMCs treated with 100 μM palmitate (grey) or BSA (red) (n = 3, two-tailed Student’s t test; ATF3 P = 0.005, ATF4 P = 0.0017, Hspa5 P = 0.0088). d UPR gene expression in myotubes receiving boiled media conditioned on C2C12 myotubes treated with 200 μM palmitate or BSA (control = red; control boiled = grey; 200 µM palmitate = blue; 200 µM palmitate boiled = green; n = 3; one-way ANOVA; control media vs 200 µM palmitate media, Atf3 P = 0.017, Atf4 P = 0.005; control vs 200 µM palmitate boiled, Atf3 P = 0.03, Atf4 P = 0.0065; control boiled vs 200 µM palmitate, Atf3 P = 0.016, Atf4 P = 0.005; control boiled vs 200 µM palmitate boiled, Atf3 P = 0.027, Atf4 P = 0.007). e UPR gene expression in myotubes receiving reconstituted lipid extract isolated from media conditioned on C2C12 myotubes treated with 200 μM palmitate (grey) or BSA (red) (n = 4; two-tailed Student’s t test: Atf3 P = 0.05, Atf4 P = 0.0026, Hspa5 P = 0.0097, Edem1 P = 0.0048). *P ≤ 0.05, **P < 0.01, ***P < 0.001, ****P < 0.0001. Data are expressed as mean ± SEM with individual data points. Source data are provided as a Source Data file.
Fig. 2
Fig. 2. Long-chain ceramides activate the unfolded protein response in myotubes.
a Diacyglycerols (DG), lysophosphocholines (LPC) and ceramides (Cer) are enriched in conditioned media collected from C2C12 myotubes treated with vehicle control (red) 100 μM (grey) and 200 μM (blue) palmitate (n = 4; one-way ANOVA; control vs 200 µM palmitate, DG 32:0 P < 0.0001, DG 34:0 P = 0.002, DG 34:1 P = 0.0002, DG 36:0 P = 0.0068, DG 36:1 P = 0.0025, LPC 16:0 P < 0.0001, LPC 16:1 P = 0.0001, LPC 18:0 P = 0.0029, Cer 34:1 P = 0.0012, Cer 40:1 P < 0.0001, Cer 42:1 P = 0.004; control vs 100 µM palmitate, Cer 40:1 P = 0.043; 100 µM palmitate vs 200 µM palmitate, DG 32:0 P < 0.0001, DG 34:0 P = 0.013, DG 34:1 P = 0.0006, DG 36:0 P = 0.023, DG 36:1 P = 0.0043, LPC 16:0 P = 0.0008, LPC 16:1 P = 0.0036, LPC 18:0 P = 0.0043, Cer 34:1 P = 0.002, Cer 40:1 P = 0.001, Cer 42:1 P = 0.02). UPR gene expression in C2C12 myotubes treated with vehicle control (red) and lipids: b 5 μM (grey) and 10 μM (blue) DG 32:0 (n = 4), c 10 μM (grey) and 100 μM (blue) LPC 16:0 (control n = 3; 10 μM and 100 μM LPC 16:0 n = 4), d 5 μM (grey) and 50 μM (blue) LPC 18:0 (n = 4), e 5 μM (grey) and 10 μM (blue) Cer 40:1 (n = 4; one-way ANOVA; control vs 10 µM Cer 40:1, Atf4 P = 0.023, Hspa5 P = 0.05) and f 5 μM (grey) and 10 μM (blue) Cer 42:1 (n = 4; one-way ANOVA; control vs 10 µM Cer 42:1, Atf4 P = 0.02, Hspa5 P = 0.036). g UPR gene expression in C2C12 myotubes treated with vehicle control (red) and a combination of 10 μM Cer 40:1 and 10 μM Cer 42:1 (grey) (n = 3; two-tailed Student’s t test, Atf4 P = 0.007, Hspa5 P = 0.017, Edem1 P = 0.05). h Cer 40:1 and Cer 42:1 concentrations in conditioned media from human skeletal muscle cells (HSkMCs) treated with 50 μM (grey) and 100 μM (blue) palmitate or vehicle control (red) (n = 4; one-way ANOVA; control vs 50 µM palmitate, Cer 40:1 P = 0.001, Cer 42:1 P = 0.025; control vs 100 µM palmitate Cer 40:1 P < 0.0001, Cer 42:1 P = 0.01; 50 µM palmitate vs 100 µM palmitate Cer 40:1 P = 0.014). i UPR gene expression in HSkMCs treated with vehicle control (red) or a combination of 10 μM Cer 40:1 and 10 μM Cer 42:1 (grey) (n = 4; two-tailed Student’s t test; ATF3 P = 0.001, ATF4 P = 0.016, EDEM1 P = 0.014). j Western blot for C/EBP Homologous Protein (CHOP), X-box binding protein 1 active splice variant (XBP-1s) and Glyceraldehyde-3-phosphate dehydrogenase (GAPDH) expression control from HSkMCs treated with 10 µM ceramides 40:1 and 42:1 and a combination of both ceramides. k Normalised Western blot densitometry for CHOP and XBP-1s from HSkMCs treated with vehicle control (red) 10 µM ceramides 40:1 (grey) and 42:1 (blue) and a combination of both ceramides (green) (n = 3; one-way ANOVA; Control vs 10 µM Cer 40:1 and Cer 42:1, XBP-1s P < 0.0001, CHOP P = 0.0018; Control vs 10 µM Cer 42:1, CHOP P = 0.0005). l Confocal microscopy of HSkMCs expressing endoplasmic reticulum-targeted red fluorescent protein (ER-RFP; red) and treated with vehicle control, 10 µM Cer 40:1 or 10 µM Cer 42:1, or a combination of both 10 µM Cer 40:1 and Cer 42:1. Nuclear staining with 4′,6-diamidino-2-phenylindole (DAPI; blue). Scale bar = 20 µm. m The normalised ER-RFP fluorescence density in HSkMCs expressing ER-RFP and treated with vehicle control (red), 10 µM Cer 40:1 (grey) or 10 µM Cer 42:1 (blue) or a combination of both 10 μM Cer 40:1 and Cer 42:1 (green) (n = 3; one-way ANOVA; control vs 10 µM Cer 40:1 and Cer 42:1, P = 0.0005). *P ≤ 0.05, **P < 0.01, ***P < 0.001, ****P < 0.0001. Data are expressed as mean ± SEM with individual data points. Source data are provided as a Source Data file.
Fig. 3
Fig. 3. Long-chain ceramides are enriched in murine and human skeletal muscle during metabolic disease.
a Ceramide (Cer) 40:1 and Cer 42:1 in soleus muscle of low-fat diet (LFD) (red) and western diet (WD) (grey) fed mice (n = 8; two-tailed Student’s t test; Cer 40:1 P = 0.00056, Cer 42:1 P = 0.045). b Cer 40:1 and Cer 42:1 in plasma of LFD (red) and WD (grey) fed mice (LFD n = 6, WD n = 13; two-tailed Student’s t test; Cer 40:1 P = 0.00031). c Cer 40:1 and Cer 42:1 in skeletal muscle biopsies from patients with type 2 diabetes (T2D) (grey) and controls (red) (control n = 52, T2D n = 21; two-tailed Student’s t test; Cer 40:1 P = 0.033, Cer 42:1 P = 0.017). d Cer 40:1 and Cer 42:1 in blood plasma from patients with T2D (grey) and controls (red) (control n = 6, T2D n = 4; two-tailed Student’s t test; Cer 40:1 P = 0.0118, Cer 42:1 P = 0.012). *P ≤ 0.05, **P < 0.01, ***P < 0.001, ****P < 0.0001. Data in bar charts are expressed as mean ± SEM with individual data points. Box and whisker plots show 25th to 75th percentile (box) min to max (whiskers), mean (+) and median (−). Source data are provided as a Source Data file.
Fig. 4
Fig. 4. Long-chain ceramides are synthesised via the Cers2 de novo pathway.
a The de novo synthesis pathway and salvage pathway of ceramide synthesis with de novo synthesis pathway inhibitors (red). Intracellular ceramides (Cer) in b C2C12 myotubes (control, 200 µM palmitate n = 4; 100 µM palmitate n = 3; one-way ANOVA; control vs 200 µM palmitate, Cer 40:1 P < 0.0001, Cer 42:1 P = 0.0026) (control = red, 100 µM palmitate = grey, 200 µM palmitate = blue) and c human skeletal muscle cells (HSkMCs) (control = red, 50 µM palmitate = grey, 100 µM palmitate = blue) (n = 4; one-way ANOVA; control vs 100 µM palmitate, Cer 40:1 P = 0.043; control vs 200 µM palmitate, Cer 40:1 P = 0.0003, Cer 42:1 P = 0.05; 100 µM palmitate vs 200 µM palmitate, Cer 40:1 P = 0.014) treated with palmitate. Long-chain ceramides in C2C12 myotubes co-treated with either d 10 µM myriocin (serine palmitoyl transferase inhibitor) (control = red, 10 µM myriocin = grey, 200 µM palmitate = blue, 200 µM palmitate + 10 µM myriocin = green) (n = 3; one-way ANOVA; control vs 10 µM myriocin, Cer 40:1 P < 0.0001, Cer 42:1 P < 0.0001; control vs 200 µM palmitate, Cer 40:1 P < 0.0001, Cer 42:1 P = 0.014; control vs 200 µM palmitate + 10 µM myriocin, Cer 40:1 P < 0.0001, Cer 42:1 P < 0.0001; 200 µM palmitate vs 10 µM myriocin, Cer 40:1 P < 0.0001, Cer 42:1 P < 0.0001; 200 µM palmitate vs 200 µM palmitate + 10 µM myriocin, Cer 40:1 P < 0.0001, Cer 42:1 P < 0.0001) or e 10 µM fumonisin B1 (FB1) (ceramide synthase (CerS) inhibitor) (control = red, 10 µM FB1 = grey, 200 µM palmitate = blue, 200 µM palmitate + 10 µM FB1 = green) (n = 4; one-way ANOVA; control vs 10 µM FB1, Cer 40:1 P < 0.0001, Cer 42:1 P < 0.0001; control vs 200 µM palmitate, Cer 40:1 P < 0.0001, Cer 42:1 P < 0.0001; 200 µM palmitate vs 10 µM FB1, Cer 40:1 P < 0.0001, Cer 42:1 P < 0.0001; 10 µM FB1 vs 200 µM palmitate + 10 µM FB1, Cer 40:1 P = 0.0001, Cer 42:1 P = 0.0005; 200 µM palmitate vs 200 µM palmitate + 10 µM FB1, Cer 40:1 P < 0.0001, Cer 42:1 P < 0.0001) and either 200 µM palmitate or bovine serum albumin (BSA). CerS2 expression in f. C2C12 myotubes (control = red; 100 µM palmitate = grey; 200 µM palmitate = blue) (control n = 3; 100 µM and 200 µM palmitate n = 4; one-way ANOVA; control vs 200 µM palmitate P = 0.044) and g. HSkMCs treated with palmitate or BSA (control = red; 50 µM palmitate = grey; 100 µM palmitate = blue) (n = 4; one-way ANOVA; control vs 100 µM palmitate P < 0.0001; 50 µM palmitate vs 100 µM palmitate P < 0.0001). h CERS2 expression in control HSkMCs (red) and HSkMCs treated with 100 µM palmitate (grey), scrambled control siRNA (con siRNA; white), siRNA against CERS2 (CERS2 siRNA; blue) or CERS2 siRNA and 100 µM palmitate (green) (n = 3; one-way ANOVA; control vs 100 µM palmitate P = 0.0016; control vs CERS2 siRNA P = 0.014; control vs CERS2 siRNA + 100 µM palmitate P = 0.011; 100 µM palmitate vs CERS2 siRNA P < 0.0001; 100 µM palmitate vs CERS2 siRNA + 100 µM palmitate P < 0.0001). i Cer 40:1 and Cer 42:1 normalised concentrations in control HSkMCs (red) and HSkMCs treated with 100 µM palmitate (grey), con siRNA (white), CERS2 siRNA (blue) or CERS2 siRNA and 100 µM palmitate (green) (n = 4; con siRNA n = 3; one-way ANOVA; control vs 100 µM palmitate, Cer 40:1 P < 0.0001, Cer 42:1 P = 0.001; control vs CERS2 siRNA Cer 40:1 P = 0.013, Cer 42:1 P = 0.01; 100 µM palmitate vs CERS2 siRNA Cer 40:1 P < 0.0001, Cer 42:1 P < 0.0001; 100 µM palmitate vs CERS2 siRNA + 100 µM palmitate Cer 40:1 P < 0.0001, Cer 42:1 P = 0.0001; CERS2 siRNA vs CERS2 siRNA + 100 µM palmitate Cer 40:1 P = 0.023). j Cer 40:1 and Cer 42:1 normalised concentrations in media conditioned on control HSkMCs (red) and HSkMCs treated with 100 µM palmitate (grey), con siRNA (white), CERS2 siRNA (blue) or CERS2 siRNA and 100 µM palmitate (green) (n = 4; one-way ANOVA; control vs 100 µM palmitate, Cer 40:1 P = 0.003, Cer 42:1 P = 0.0001; control vs CERS2 siRNA Cer 40:1 P = 0.0001, Cer 42:1 P = 0.0005; control vs CERS2 siRNA + 100 µM palmitate, Cer 40:1 P = 0.019, Cer 42:1 P = 0.011; 100 µM palmitate vs CERS2 siRNA Cer 40:1 P < 0.0001, Cer 42:1 P < 0.0001; 100 µM palmitate vs CERS2 siRNA + 100 µM palmitate Cer 40:1 P < 0.0001, Cer 42:1 P < 0.0001; CERS2 siRNA vs CERS2 siRNA + 100 µM palmitate Cer 40:1 P = 0.024). k UPR gene expression in HSkMCs receiving conditioned media from 100 μM palmitate or BSA-treated HSkMCs with and without CERS2 siRNA (control = red, 100 µM palmitate = grey, control + CERS2 siRNA = blue, 100 µM palmitate + CERS2 siRNA = green) (n = 3; one-way ANOVA; control vs 100 µM palmitate, ATF3 P = 0.045, HSPA5 P = 0.0043, EDEM1 P = 0.012; 100 µM palmitate vs CERS2 siRNA, ATF3 P = 0.003, HSPA5 P = 0.001, EDEM1 P = 0.0052; 100 µM palmitate vs CERS2 siRNA + 100 µM palmitate ATF3 P = 0.004, HSPA5 P = 0.0008, EDEM1 P = 0.004). *P ≤ 0.05, **P < 0.01, ***P < 0.001, ****P < 0.0001. Data are expressed as mean ± SEM with individual data points. Source data are provided as a Source Data file.
Fig. 5
Fig. 5. Palmitate-induced long-chain ceramide synthesis requires Perk.
a Ceramides (Cer) in C2C12 myotubes treated with palmitate or Bovine Serum Albumin (BSA), in combination with 10 µM 4µ8c, an inhibitor of Ire1 (Ire1i) (control = red, Ire1i = grey, palmitate = blue, palmitate + Ire1i = green) (n = 3; one-way ANOVA; control vs 200 µM palmitate Cer 40:1 P < 0.0001, Cer 42:1 P = 0.0062; control vs 200 µM palmitate + 10 µM Ire1i Cer 40:1 P < 0.0001; 10 µM Ire1i vs 200 µM palmitate Cer 40:1 P < 0.0001, Cer 42:1 P = 0.013; 10 µM Ire1i vs 200 µM palmitate + 10 µM Ire1i Cer 40:1 P < 0.0001). b Ceramides in C2C12 myotubes treated with palmitate or BSA, in combination with 10 µM AMG PERK 44, an inhibitor of PERK (Perki) (control = red, Perki = grey, palmitate = blue, palmitate + Perki = green) (n = 3; one-way ANOVA; control vs 200 µM palmitate Cer 40:1 P < 0.0001, Cer 42:1 P = 0.022; control vs 200 µM palmitate + 10 µM Perki Cer 40:1 P = 0.0003; 10 µM Perki vs 200 µM palmitate Cer 40:1 P < 0.0001, Cer 42:1 P = 0.023; 10 µM Perki vs 200 µM palmitate + 10 µM Perki Cer 40:1 P = 0.0002; 200 µM palmitate vs 200 µM palmitate + 10 µM Perki Cer 40:1 P = 0.0017, Cer 42:1 P = 0.028). c PERK expression in control HSkMCs (red) and HSkMCs treated with 100 µM palmitate (grey), scrambled control siRNA (con siRNA; white), siRNA against PERK (PERK siRNA; blue) or PERK siRNA and 100 µM palmitate (green) (n = 3; one-way ANOVA; control vs 100 µM palmitate P = 0.05; control vs PERK siRNA P = 0.016; control vs PERK siRNA + 100 µM palmitate P = 0.016; 100 µM palmitate vs PERK siRNA P = 0.0004; 100 µM palmitate vs PERK siRNA + 100 µM palmitate P = 0.0004). d Cer 40:1 and Cer 42:1 normalised concentration in control HSkMCs (red) and HSkMCs treated with 100 µM palmitate (grey), con siRNA (white), PERK siRNA (blue) or PERK siRNA and 100 µM palmitate (green) (n = 4; one-way ANOVA; control vs 100 µM palmitate, Cer 40:1 P < 0.0001, Cer 42:1 P = 0.015; control vs PERK siRNA Cer 40:1 P = 0.05, Cer 42:1 P = 0.05; 100 µM palmitate vs PERK siRNA Cer 40:1 P < 0.0001, Cer 42:1 P = 0.0002; 100 µM palmitate vs PERK siRNA + 100 µM palmitate Cer 40:1 P < 0.0001, Cer 42:1 P = 0.0015; PERK siRNA vs PERK siRNA + 100 µM palmitate Cer 40:1 P = 0.0262). e Cer 40:1 and Cer 42:1 normalised concentration in media conditioned on control HSkMCs (red) and HSkMCs treated with 100 µM palmitate (grey), con siRNA (white), PERK siRNA (blue) or PERK siRNA and 100 µM palmitate (green) (n = 3; one-way ANOVA; control vs 100 µM palmitate, Cer 40:1 P = 0.0487, Cer 42:1 P = 0.0007; control vs PERK siRNA Cer 40:1 P = 0.0009, Cer 42:1 P < 0.0001; control vs PERK siRNA + 100 µM palmitate, Cer 40:1 P = 0.0006, Cer 42:1 P < 0.0001; 100 µM palmitate vs PERK siRNA Cer 40:1 P < 0.0001, Cer 42:1 P < 0.0001; 100 µM palmitate vs PERK siRNA + 100 µM palmitate Cer 40:1 P < 0.0001, Cer 42:1 P < 0.0001). *P ≤ 0.05, **P < 0.01, ***P < 0.001, ****P < 0.0001. Data are expressed as mean ± SEM with individual data points. Source data are provided as a Source Data file.
Fig. 6
Fig. 6. Transgenic CerS2 inactivation decreases plasma and muscle long-chain ceramides and muscle UPR gene expression.
a Ceramides (Cer) 40:1 and Cer 42:1 in the soleus muscle of transgenic mice heterozygous (Het CerS2 H/A; grey) and homozygous (Homo CerS2 H/A; blue) for catalytically inactivated ceramide synthase 2 compared to wildtype (WT; red) (WT, Het CerS2 H/A n = 6; Homo CerS2 H/A n = 3; one-way ANOVA; WT vs Het CerS2 H/A, Cer 40:1 P = 0.03, Cer 42:1 P = 0.03; WT vs Homo CerS2 H/A, Cer 40:1 P < 0.0001, Cer 42:1 P = 0.0005). b Cer 40:1 and Cer 42:1 in the plasma of Het CerS2 H/A (grey) and Homo CerS2 H/A (blue) mice compared to WT (red) (WT, Het CerS2 H/A n = 6; Homo CerS2 H/A n = 3; one-way ANOVA; WT vs Het CerS2 H/A, Cer 42:1 P = 0.0018; WT vs Homo CerS2 H/A, Cer 40:1 P = 0.0006, Cer 42:1 P < 0.0001). c Activating transcription factor 4 (Atf4), Heat Shock Protein Family A (Hsp70) Member 5 (Hspa5) and ER Degradation Enhancing Alpha-Mannosidase Like Protein 1 (Edem1) soleus muscle UPR gene expression in Het CerS2 H/A (grey) and Homo CerS2 H/A (blue) mice compared to WT (red) (WT, Het CerS2 H/A n = 6; Homo CerS2 H/A n = 3; one-way ANOVA; WT vs Het CerS2 H/A, Atf4 P = 0.019, Hspa5 P = 0.02; WT vs Homo CerS2 H/A, Atf4 P < 0.0001, Hspa5 P = 0.019) *P ≤ 0.05, **P < 0.01, ***P < 0.001, ****P < 0.0001. Data are expressed as mean ± SEM with individual data points. Source data are provided as a Source Data file.
Fig. 7
Fig. 7. UPR-inducing ceramides are secreted via extracellular vesicles.
a Extracellular vesicle (EV) population images in conditioned media from C2C12 myotubes treated with either 200 μM palmitate (grey) or bovine serum albumin (BSA) control (red). b The small EV population secreted by C2C12 myotubes treated with either 200 μM palmitate (grey) or BSA vehicle (red) (n = 4; two-tailed Student’s t test; P = 0.02). c The large EV population secreted by C2C12 myotubes treated with either 200 μM palmitate (grey) or the BSA vehicle (red) (n = 4; two-tailed Student’s t test; P < 0.0001). Activating transcription factor 3 (Atf3), activating transcription factor 4 (Atf4), Heat Shock Protein Family A (Hsp70) Member 5 (Hspa5) and ER Degradation Enhancing Alpha-Mannosidase Like Protein 1 (Edem1) UPR gene expression in myotubes treated with d. small EVs (n = 4; two-tailed Student’s t test; Atf3 P = 0.05, Atf4 P = 0.02; Edem1 P = 0.05) and e. large EVs (n = 3; two-tailed Student’s t test; Atf3 P = 0.03, Atf4 P = 0.007; Hspa5 = 0.01, Edem1 P = 0.02) isolated from the media of palmitate (grey) and BSA-treated (red) myotubes. f UPR gene expression in myotubes treated with conditioned EV-depleted media from 200 μM palmitate-treated (grey) and control (red) myotubes (n = 3; two-tailed Student’s t test; Atf3 P = 0.002, Atf4 P = 0.04, Edem1 P = 0.05). Ceramide (Cer) 40:1 and Cer 42:1 concentration in g. small EVs (n = 4; two-tailed Student’s t test; Cer 40:1 P = 0.0004, Cer 42:1 P = 0.0006) and h. large EVs (n = 4; two-tailed Student’s t test; Cer 40:1 P < 0.0001, Cer 42:1 P = 0.001) from the media of C2C12 myotubes treated with either 200 μM palmitate (grey) or BSA control (red). i Cer 40:1 and Cer 42:1 concentration in EV-containing and EV-depleted media from C2C12 myotubes treated with either 200 μM palmitate or BSA control (control = red, control EV-depleted = grey, palmitate = blue, palmitate EV-depleted = green) (n = 4; one-way ANOVA; control vs 200 µM palmitate, Cer 40:1 P = 0.0007, Cer 42:1 P = 0.012; control vs control EV-depleted, Cer 40:1 P = 0.0011, Cer 42:1 P < 0.0001; control vs 200 µM palmitate EV-depleted, Cer 40:1 P = 0.0016, Cer 42:1 P < 0.0001; 200 µM palmitate vs control EV-depleted, Cer 40:1 P < 0.0001, Cer 42:1 P < 0.0001; 200 µM palmitate vs 200 µM palmitate EV-depleted, Cer 40:1 P < 0.0001, Cer 42:1 P < 0.0001). *P ≤ 0.05, **P < 0.01, ***P < 0.001, ****P < 0.0001. Data are expressed as mean ± SEM with individual data points. Source data are provided as a Source Data file.
Fig. 8
Fig. 8. Ceramide-induced dihydroceramide accumulation increases UPR gene expression.
a Ceramide (Cer) 40:1 and Cer 42:1 concentrations in C2C12 myotubes treated with either vehicle control (red), 10 µM Cer 40:1 (grey), 10 µM Cer 42:1 (blue) or a combination of both Cer 40:1 and Cer 42:1 (green) (n = 3; one-way ANOVA; control vs 10 µM Cer 40:1, Cer 40:1 P = 0.0015; control vs Cer 42:1, Cer 42:1 P < 0.0001; control vs Cer 40:1/Cer 42:1, Cer 40:1 P = 0.0008, Cer 42:1 P < 0.0001; 10 µM Cer 40:1 vs 10 µM Cer 42:1, Cer 40:1 P = 0.015, Cer 42:1 P < 0.0001; 10 µM Cer 42:1 vs 10 µM Cer 40:1/Cer 42:1, Cer 40:1 P = 0.0008; 10 µM Cer 40:1 vs 10 µM Cer 40:1/Cer 42:1, Cer 42:1 P < 0.0001). b Dihydroceramide (DHCer) 40:0 and DHCer 42:0 concentrations in C2C12 myotubes treated with either vehicle control (red), 10 µM Cer 40:1 (grey), 10 µM Cer 42:1 (blue) or a combination of both Cer 40:1 and Cer 42:1 (green) (n = 3; one-way ANOVA; control vs 10 µM Cer 40:1, DHCer 40:0 P = 0.0005; control vs 10 µM Cer 42:1, DHCer 42:0 P < 0.0001; control vs 10 µM Cer 40:1/Cer 42:1, DHCer 40:0 P = 0.0002, DHCer 42:0 P < 0.0001; 10 µM Cer 40:1 vs 10 µM Cer 42:1, DHCer 40:0 P = 0.0013, DHCer 42:0 P < 0.0001; 10 µM Cer 40:1 vs 10 µM Cer 40:1/Cer 42:1, DHCer 42:0 P < 0.0001, 10 µM Cer 42:1 vs 10 µM Cer 40:1/Cer 42:1, DHCer 40:0 P = 0.0005). c Cer 40:1 and Cer 42:1 in human skeletal muscle cells (HSkMCs) treated with either vehicle control (red), 10 µM Cer 40:1 (grey), 10 µM Cer 42:1 (blue) or a combination of both Cer 40:1 and Cer 42:1 (green) (n = 3; one-way ANOVA; control vs 10 µM Cer 40:1, Cer 40:1 P = 0.0047; control vs Cer 42:1, Cer 42:1 P = 0.0048; control vs Cer 40:1/Cer 42:1, Cer 40:1 P = 0.038, Cer 42:1 P = 0.0026; 10 µM Cer 40:1 vs 10 µM Cer 42:1, Cer 40:1 P = 0.0047, Cer 42:1 P = 0.0048; 10 µM Cer 42:1 vs 10 µM Cer 40:1/Cer 42:1, Cer 40:1 P = 0.038; 10 µM Cer 40:1 vs 10 µM Cer 40:1/Cer 42:1, Cer 42:1 P = 0.0026). d DHCer 40:0 and DHCer 42:0 in HSkMCs treated with either vehicle control (red), 10 µM Cer 40:1 (grey), 10 µM Cer 42:1 (blue) or a combination of both Cer 40:1 and Cer 42:1 (green) (n = 3; one-way ANOVA; control vs 10 µM Cer 40:1, DHCer 40:0 P = 0.005; control vs 10 µM Cer 40:1/Cer 42:1, DHCer 40:0 P = 0.005, DHCer 42:0 P = 0.02; 10 µM Cer 40:1 vs 10 µM Cer 42:1, DHCer 40:0 P = 0.005; 10 µM Cer 42:1 vs 10 µM Cer 40:1/Cer 42:1, DHCer 40:0 P = 0.005). e DEGS1 expression in control HSkMCs (red) and HSkMCs treated with 100 µM palmitate (grey), scrambled control siRNA (con siRNA; white), siRNA against DEGS1 (DEGS1 siRNA; blue) or DEGS1 siRNA and 100 µM palmitate (green) (n = 3; one-way ANOVA; control vs DEGS1 siRNA P = 0.02; control vs DEGS1 siRNA + 100 µM palmitate P = 0.02; 100 µM palmitate vs DEGS1 siRNA P = 0.005; 100 µM palmitate vs DEGS1 siRNA + 100 µM palmitate P = 0.0047; Con siRNA vs DEGS1 siRNA P = 0.013; Con siRNA vs DEGS1 siRNA + 100 µM palmitate P = 0.012). f Cer 40:1 and Cer 42:1 normalised concentrations in control HSkMCs (red) and HSkMCs treated with 100 µM palmitate (grey), con siRNA (white), DEGS1 siRNA (blue) or DEGS1 siRNA and 100 µM palmitate (green) (n = 4; one-way ANOVA; control vs 100 µM palmitate, Cer 40:1 P = 0.0005, Cer 42:1 P = 0.0024; control vs DEGS1 siRNA Cer 40:1 P = 0.0009, Cer 42:1 P < 0.0001; control vs DEGS1 siRNA + 100 µM palmitate, Cer 40:1 P = 0.004, Cer 42:1 P < 0.0001; 100 µM palmitate vs DEGS1 siRNA Cer 40:1 P < 0.0001, Cer 42:1 P < 0.0001; 100 µM palmitate vs DEGS1 siRNA + 100 µM palmitate Cer 40:1 P < 0.0001, Cer 42:1 P < 0.0001; Con siRNA vs DEGS1 siRNA Cer 40:1 P = 0.017, Cer 42:1 P < 0.0001; 100 µM palmitate vs Con siRNA, Cer 40:1 P < 0.0001, Cer 42:1 P < 0.0001). g DHCer 40:0 and DHCer 42:0 normalised concentrations in control HSkMCs (red) and HSkMCs treated with 100 µM palmitate (grey), con siRNA (white), DEGS1 siRNA (blue) or DEGS1 siRNA and 100 µM palmitate (green) (n = 4; one-way ANOVA; control vs 100 µM palmitate, DHCer 40:0 P = 0.047, DHCer 42:0 P = 0.036; control vs DEGS1 siRNA DHCer 40:0 P = 0.0035, Cer 42:0 P = 0.0007; control vs DEGS1 siRNA + 100 µM palmitate, DHCer 40:0 P < 0.0001, Cer 42:1 P < 0.0001; 100 µM palmitate vs DEGS1 siRNA + 100 µM palmitate DHCer 40:0 P < 0.0001, DHCer 42:0 P < 0.0001; Con siRNA vs DEGS1 siRNA DHCer 40:0 P = 0.0019, DHCer 42:0 P = 0.001; Con siRNA vs DEGS1 siRNA + 100 µM palmitate, DHCer 40:0 P < 0.0001, Cer 42:1 P < 0.0001, DEGS1 siRNA vs DEGS1 siRNA + 100 µM palmitate, DHCer 40:0 P < 0.0001, Cer 42:1 P = 0.0002). h Activating transcription factor 3 (ATF3), activating transcription factor 4 (ATF4), Heat Shock Protein Family A (HSP70) Member 5 (HSPA5) and ER Degradation Enhancing Alpha-Mannosidase Like Protein 1 (EDEM1) UPR gene expression in control HSkMCs (red) and HSkMCs treated with 100 µM palmitate (grey), con siRNA (white), DEGS1 siRNA (blue) or DEGS1 siRNA and 100 µM palmitate (green) (n = 3; one-way ANOVA; control vs 100 µM palmitate, ATF3 P = 0.019, EDEM1 P = 0.019; control vs DEGS1 siRNA, EDEM1 P = 0.024; control vs DEGS1 siRNA + 100 µM palmitate, ATF3 P < 0.0001, ATF4 P = 0.0001, HSPA5 P = 0.009, EDEM1 P = 0.0011; 100 µM palmitate vs Con siRNA, ATF3 P = 0.019, EDEM1 P = 0.019; 100 µM palmitate vs DEGS1 siRNA + 100 µM palmitate, ATF3 P < 0.0001, ATF4 P = 0.002, HSPA5 P = 0.038; Con SiRNA vs DEGS1 siRNA, EDEM1 P = 0.024; Con siRNA vs DEGS1 siRNA + 100 µM palmitate, ATF3 P < 0.0001, ATF4 P = 0.0002, HSPA5 P = 0.009, EDEM1 P = 0.0011; DEGS1 siRNA vs DEGS1 siRNA + 100 µM palmitate, ATF3 P < 0.0001, ATF3 P = 0.0006, HSPA5 P = 0.023). *P ≤ 0.05, **P < 0.01, ***P < 0.001, ****P < 0.0001. Data are expressed as mean ± SEM with individual data points. Source data are provided as a Source Data file.

References

    1. Oakes SA, Papa FR. The role of endoplasmic reticulum stress in human pathology. Annu. Rev. Pathol. 2015;10:173–194. - PMC - PubMed
    1. Boden G, et al. Increase in endoplasmic reticulum stress-related proteins and genes in adipose tissue of obese, insulin-resistant individuals. Diabetes. 2008;57:2438–2444. - PMC - PubMed
    1. Palomer X, Pizarro-Delgado J, Barroso E, Vazquez-Carrera M. Palmitic and Oleic Acid: The Yin and Yang of Fatty Acids in Type 2 Diabetes Mellitus. Trends Endocrinol. Metab. 2018;29:178–190. - PubMed
    1. Unger RH, Clark GO, Scherer PE, Orci L. Lipid homeostasis, lipotoxicity and the metabolic syndrome. Biochim. Biophys. Acta. 2010;1801:209–214. - PubMed
    1. Sears B, Perry M. The role of fatty acids in insulin resistance. Lipids Health Dis. 2015;14:121. - PMC - PubMed

Publication types