. 2022 Apr 1;13(1):1725.
doi: 10.1038/s41467-022-29334-0.

Defining the early stages of intestinal colonisation by whipworms

Affiliations

Defining the early stages of intestinal colonisation by whipworms

María A Duque-Correa et al. Nat Commun. .

Abstract

Whipworms are large metazoan parasites that inhabit multi-intracellular epithelial tunnels in the large intestine of their hosts, causing chronic disease in humans and other mammals. How first-stage larvae invade host epithelia and establish infection remains unclear. Here we investigate early infection events using both Trichuris muris infections of mice and murine caecaloids, the first in-vitro system for whipworm infection and organoid model for live helminths. We show that larvae degrade mucus layers to access epithelial cells. In early syncytial tunnels, larvae are completely intracellular, woven through multiple live dividing cells. Using single-cell RNA sequencing of infected mouse caecum, we reveal that progression of infection results in cell damage and an expansion of enterocytes expressing of Isg15, potentially instigating the host immune response to the whipworm and tissue repair. Our results unravel intestinal epithelium invasion by whipworms and reveal specific host-parasite interactions that allow the whipworm to establish its multi-intracellular niche.


Conflict of interest statement

The authors declare no competing interests.

Figures
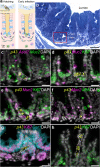
Fig. 1
Fig. 1. Whipworm L1 larvae are predominantly associated with mitotically active cells at the bottom of the crypts of Lieberkühn in the caecum.
a Illustration of the processes of egg hatching at the caecal lumen and larvae infection of the IE at the base of the crypts. b Representative image of toluidine blue-stained transverse sections from caecum of mice infected with T. muris (72 h p.i.), showing whipworm larvae (arrowhead) infecting cells at the base of crypts. Scale bar 30 μm. Image is representative of 15 larvae found during the first 72 h of infection across two independent experiments with three mice per timepoint (3, 24 and 72 h p.i.) each. ch p43+ T. muris larvae (dashed white outline, yellow staining) were detected in close association with: c Ascl2+ and Ascl2+ (magenta)/Muc2+ (green) cells (putative stem cells and DSCs, respectively), de Ki-67+ (green)/Muc2+ (magenta) DSCs, f Muc2+ (magenta) DSCs and g Ki-67+(magenta)/Car1+ (aqua) enterocyte progenitor cells within the dividing zone of the mouse caecal epithelium. h In one instance, we observed a larva within the differentiated zone of the caecal crypt. Ki-67+ cells stain in green. In c to h, nuclei are stained with DAPI (white). Images are representative of 20 larvae found in an experiment with three mice at 72 h p.i. All scale bars = 15 μm.
Fig. 2
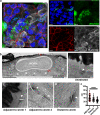
Fig. 2. Whipworm L1 larvae become completely intracellular and are in direct contact with the cytoplasm of their host cells.
TEM images of transverse sections from caecum of mice infected with T. muris. a Whipworm L1 larvae infecting DSCs (identified by the mucin secretory granules; insets I and III) and other IECs at the base of the crypt (inset II) at 3 h p.i. Scale bars 5 μm. Blue lines show the cellular membranes of the host cells. b, c L1 larvae infecting DSCs in the caecum of mice 3 h p.i., note: b potential mucus discharge (red asterisk) and tannic acid staining (black secretion) revealing complex carbohydrate in the host cell cytoplasm and between cells (inset, red arrow); c host cell cytoskeleton reorganization of actin filaments adjacent and parallel to the cuticle of the larvae (inset, white arrowheads). d L1 larvae infecting several IECs in the caecum of mice at 24 h p.i. Host cells display DNA condensation and fragmentation (pyknotic nuclei, characteristic for the onset of apoptosis) and their nuclei and mitochondria are displaced by the worm. e Toluidine blue-stained (scale bar 20 μm) and TEM images of transverse sections from caecum of mice infected with T. muris, showing a syncytial tunnel formed by L1 whipworm larvae through IECs (72 h p.i.), and depicting liquefaction of cells (inset I, red asterisk) and nuclei in early stages of apoptosis (inset II). N, nuclei. Images are representative of 15 larvae found during the first 72 h of infection across two independent experiments with three mice per timepoint (3, 24 and 72 h p.i.) each.
Fig. 3
Fig. 3. Caecaloid—T. muris in vitro model reproduces in vivo infection.
a, b Representative confocal immunofluorescence (IF) images of caecaloids infected with whipworm L1 larvae for 24 h. a Orthogonal slice visualising enterocyte microvilli (villin staining in red) above the larvae (white arrowheads). Scale bars 20 μm. b Complete z-stack projection showing larvae infecting IECs within or adjacent to Ki-67+ (red) dividing centres. In green, the lectins UEA and SNA bind mucins in goblet cells; in blue and aqua, DAPI stains nuclei of IECs and larvae, respectively; and in white, phalloidin binds to F-actin. Scale bars 20 μm. IF imaging experiments on T. muris-infected caecaloids were done in triplicate across more than ten independent replicas using three caecaloid lines derived from three C57BL/6 mice. c Representative images of T. muris-infected caecaloids (72 h p.i) showing L1 larvae infecting cells within or adjacent to Ki-67+ (green) dividing centres, specifically Car1+ enterocyte progenitors and Muc2+ DSCs (magenta) visualised by IF and mRNA ISH by HCR. In white DAPI stains nuclei. Scale bars 15 μm. HCR imaging experiments on T. muris-infected caecaloids were done in triplicate across two independent replicas using two caecaloid lines derived from two C57BL/6 mice.
Fig. 4
Fig. 4. Caecaloid—T. muris in vitro model reveals intricate path of multi-intracellular tunnels burrowed by whipworm L1 larvae.
Scanning and transmission EM images from caecaloids infected with T. muris for 24 h, showing whipworm L1 larvae a invading mucus layers and b within the cytoplasm of host cells. Blue lines show the cellular membranes of the host cells. c Complete z-stack projection and selected and cropped volume of confocal IF images of syncytial tunnels (white arrowheads) in caecaloids infected with L1 whipworm larvae for 24 h. In red, (I) Dclk-1, marker of tuft cells; (II) ZO-1 protein, binding tight junctions; in green, the lectins UEA and SNA bind mucins in goblet cells; in blue and aqua, DAPI stains nuclei of IECs and larvae, respectively; and in white, phalloidin binds to F-actin. Scale bars for (I) 50 μm, and (II) 20 μm. Imaging experiments on T. muris-infected caecaloids were performed in triplicate across more than ten independent replicates using three caecaloid lines derived from three C57BL/6 mice.
Fig. 5
Fig. 5. Whipworm L1 larvae invade caecal epithelium by degrading the overlaying mucus layer.
a MUC2 purified from LS174T cell lysates was incubated with (red squares) or without (black circles) 400 T. muris L1 larvae at 37 °C for 24 h before being subjected to rate zonal centrifugation on linear 6–8 M GuHCl gradients (fraction 1—low GuHCl; fraction 24—high GuHCl). After centrifugation tubes were emptied from the top and the fractions probed with a MUC2 antibody. Data are shown as staining intensity arbitrary units (a.u). Results are represented as the mean +/− standard error of the mean (SEM) of 3 independent experiments. Source data are provided as a Source data file. b Caecaloid mucus degradation by T. muris L1 larvae at 72 h p.i. Transwells were washed with 0.2 M urea in PBS to recover mucus. Washes were subjected to rate zonal centrifugation on linear 5–25% sucrose gradients. After centrifugation tubes were emptied from the top and the fractions were stained with Periodic Acid Shiff’s (PAS) to detect the mucins. Data are shown as percentage of intensity. Black circles represent uninfected caecaloids and red squares represent T. muris L1-infected caecaloids. Results are shown as the mean +/− SEM of 3 replicas of one caecaloid line, which are representative of two caecaloid lines. Source data are provided as a Source data file. c Representative images of toluidine blue-stained transverse sections from caecaloids uninfected and infected with T. muris L1 larvae for 24 h showing degradation (asterisk) of the overlaying mucus layer immediate above the infected cells. Scale bars 20 μm. Imaging experiments on T. muris-infected caecaloids were done in triplicate across at least three independent replicas using three caecaloid lines derived from three C57BL/6 mice. d Measurement of the density of toluidine blue staining via quantification of the %CMYK recorded (Adobe Photoshop). Five data points from each of three areas were counted: (1) mucus layer overlaying uninfected IECs, (2) cleared mucus above IECs infected with whipworm L1 larvae, and (3) mucus-free background (above and away from the IECs section), for each of five L1 larvae infecting caecaloids. Data are presented as median values with interquartile range. ****p < 0.0001 Kruskal Wallis test and Dunn’s comparisons among groups. A Source data file is provided.
Fig. 6
Fig. 6. Close interactions between T. muris whipworm larvae and IECs at syncytial tunnels during early infection of caecaloids.
a Selected confocal IF 2D images from a z-stack showing IECs left behind in the tunnel are necrotic (propidium iodide (red) and caspase-3/7 (green) positive), while IECs infected by worm are alive after 72 h p.i. In blue and aqua, DAPI stains nuclei of IECs and larvae, respectively; and in white, phalloidin binds to F-actin. Scale bars 50 μm. bd Representative TEM images of transverse sections of caecaloids infected with T. muris L1 larvae, showing host-parasite interactions during early infection: b Host cell actin fibres (white arrowhead) surround the cuticle of the worm (inset I) and desmosomes (red asterisks) are still present (inset II) at 24 h p.i. c Liquefied cell (inset I, asterisk), and nuclei in early stages of apoptosis (inset II) at 72 h p.i. d Displaced mitochondria (inset I) and numerous lysosomes in host cells, some actively discharging over the worm cuticle (insets II and III). N, nuclei; red asterisks, lysosomes. TEM images are representative of 10 larvae during the first 72 h of infection. Imaging experiments on T. muris-infected caecaloids were done in triplicate across more than ten independent replicas using three caecaloid lines derived from three C57BL/6 mice.
Fig. 7
Fig. 7. Perturbations on desmosomes, but not on tight junctions, in host cells of whipworm larvae during early infection of caecaloids.
a Z-stack projection of confocal IF images of T. muris L1 larva in syncytial tunnel in caecaloids infected for 24 h. In blue and aqua, DAPI stains nuclei of IECs and larvae, respectively; in green, the lectins UEA and SNA bind mucins in goblet cells; in red, ZO-1 protein binds tight junctions; and in white, phalloidin binds to F-actin. Scale bars 10 μm. IF imaging experiments on T. muris-infected caecaloids were done in triplicate across two independent replicas using three caecaloid lines derived from three C57BL/6 mice. b Representative TEM images of transverse sections of T. muris-infected caecaloids (72 h p.i.) and desmosomes (arrowheads) joining infected and adjacent cells (insets I and II), cells 1 mm distant to the worm from infected caecaloids (inset III), and cells from uninfected caecaloids. Scale bars for desmosome images 100 nm. c Desmosome separation in nm was measured in uninfected cells, cells distant from those infected and host cells from four independent worms. Measurements adjacent n = 62, distant n = 37 and uninfected n = 50. Data are presented as median values with interquartile range. ****p < 0.0001 Kruskal Wallis test and Dunn’s comparisons among groups. Source data are provided as a Source data file.
Fig. 8
Fig. 8. Host IECs responses to early infection with whipworms are dominated by a type-I IFN signature.
a Bulk RNA-seq data from complete caecum and caecal IECs of T. muris-infected and uninfected mice at days 7, and 1 and 3 p.i., respectively, were analysed by gene set enrichment analysis (GSEA) for cell signature genes in the IFN alpha pathway. All analyses have false discovery rate (FDR) adjusted p-values: Caecum, 0.013; day 1 (D1) IEC, 0.025; day 3 (D3) IEC, 0.026. b Uniform manifold approximation and projection (UMAP) plots from single-cell RNA-seq analysis of 22,422 EpCAM+CD45 cells. IEC populations (colour coded) in the caecum of control (n = 8, 4 mice for each timepoint) and T. muris-infected mice after 1 and 3 days p.i. (n = 4 mice for each timepoint). UMAP representations with separate day-1 and day-3 controls are shown in Supplementary Fig. 10e. c Dot plot of the top marker genes for each cell type. The relative size of each dot represents the fraction of cells per cluster that expresses each marker; the colour represents the average (scaled) gene expression. d Increased relative abundance of the Enterocyte Isg15 cluster upon 72 h of T. muris infection. The size of the clusters, expressed as a proportion of the total number of cells per individual, was compared across four biological replicates at each timepoint for uninfected and T. muris-infected mice. Mean +/− standard deviation is shown (*p = 0.036 for Enterocyte, *p = 0.031 for Entero.Isg15 and *p = 0.030 for Entero.AMP, two-tailed t test). Source data are provided as a Source data file.
Fig. 9
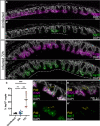
Fig. 9. Expansion of crypts with enterocytes expressing Isg15 upon whipworm infection.
Representative images of expression of Isg15 (green) and Krt20 (magenta), visualised by mRNA ISH by HCR, in the caecum of a uninfected mice and b T. muris-infected mice after 72 h of infection. Dashed white lines show the extent of “islands” of Isg15+ crypts. c The number of Isg15+ crypts in a caecal section was calculated as a percentage of the total number of crypts across three sections from the same mouse, and with three mice analysed per condition (uninfected, 24 and 72 h p.i.). Data are presented as median values with interquartile range. **p = 0.0045, ***p = 0.0002 Kruskal Wallis test and Dunn’s comparisons among groups. For each condition, dots representing technical replicates are coloured identically. Source data are provided as a Source data file. d In some instances, worms were located near islands of Isg15+ enterocytes, e while in other cases, worms were found away from these islands. Scale bars: a/ai and b/bi = 60 μm; d/di and e/ei = 30 μm.

References

    1. Else KJ, et al. Whipworm and roundworm infections. Nat. Rev. Dis. Prim. 2020;6:44. - PubMed
    1. Jourdan PM, Lamberton PHL, Fenwick A, Addiss DG. Soil-transmitted helminth infections. Lancet. 2018;391:252–265. - PubMed
    1. Klementowicz JE, Travis MA, Grencis RK. Trichuris muris: a model of gastrointestinal parasite infection. Semin. Immunopathol. 2012;34:815–828. - PMC - PubMed
    1. Panesar TS, Croll NA. The location of parasites within their hosts: site selection by Trichuris muris in the laboratory mouse. Int. J. Parasitol. 1980;10:261–273. - PubMed
    1. Tilney LG, Connelly PS, Guild GM, Vranich KA, Artis D. Adaptation of a nematode parasite to living within the mammalian epithelium. J. Exp. Zool. A Comp. Exp. Biol. 2005;303:927–945. - PubMed

Publication types