. 2022 Apr 1;13(1):1752.
doi: 10.1038/s41467-022-29346-w.

A functional map of HIV-host interactions in primary human T cells

Affiliations

A functional map of HIV-host interactions in primary human T cells

Joseph Hiatt et al. Nat Commun. .

Abstract

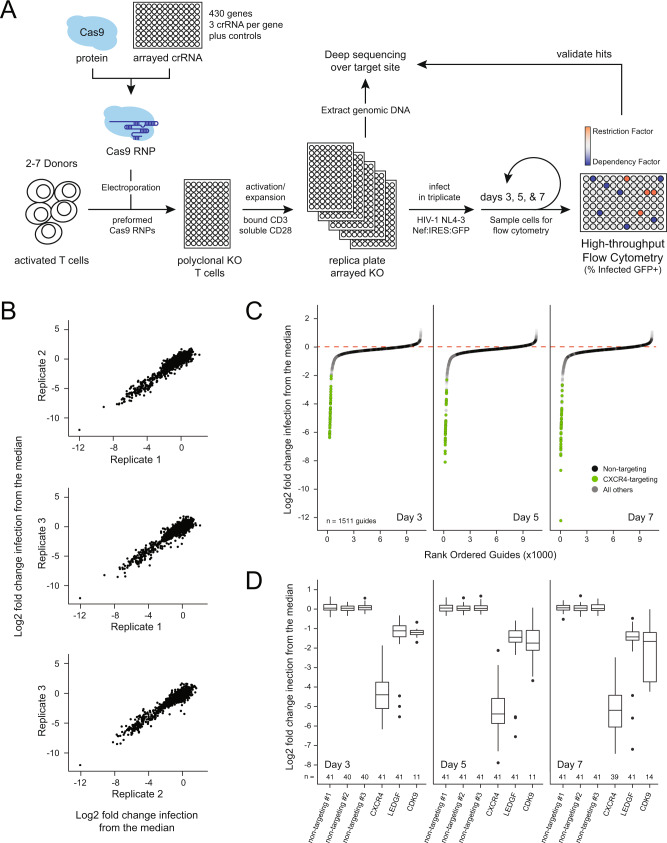
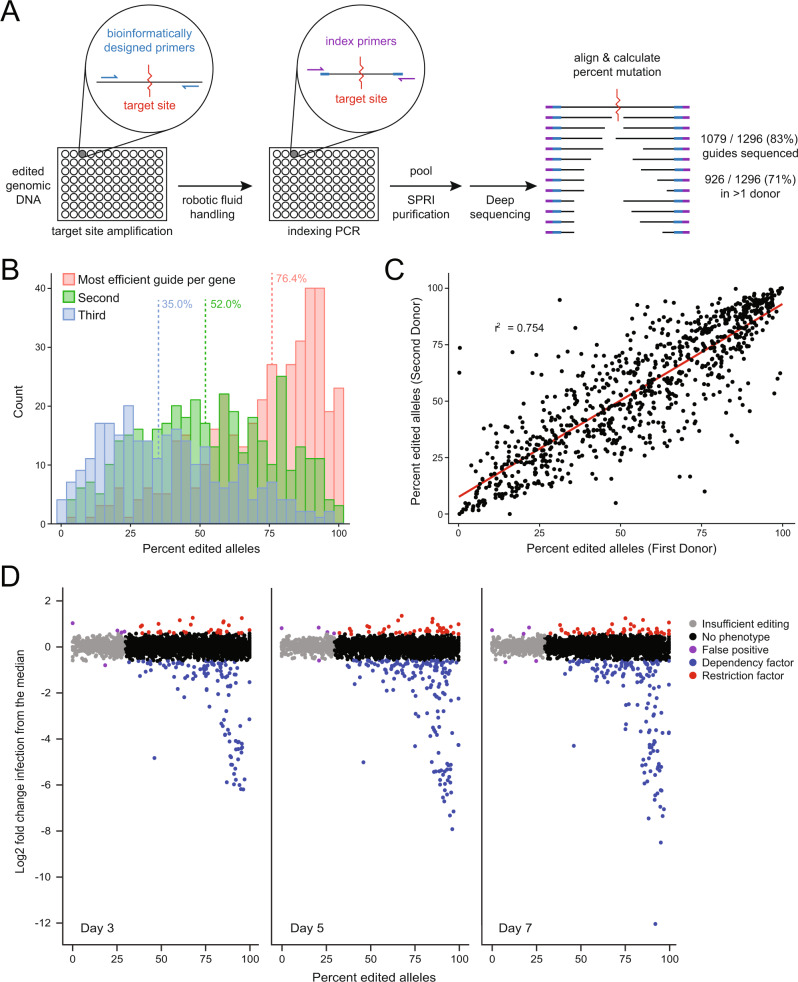
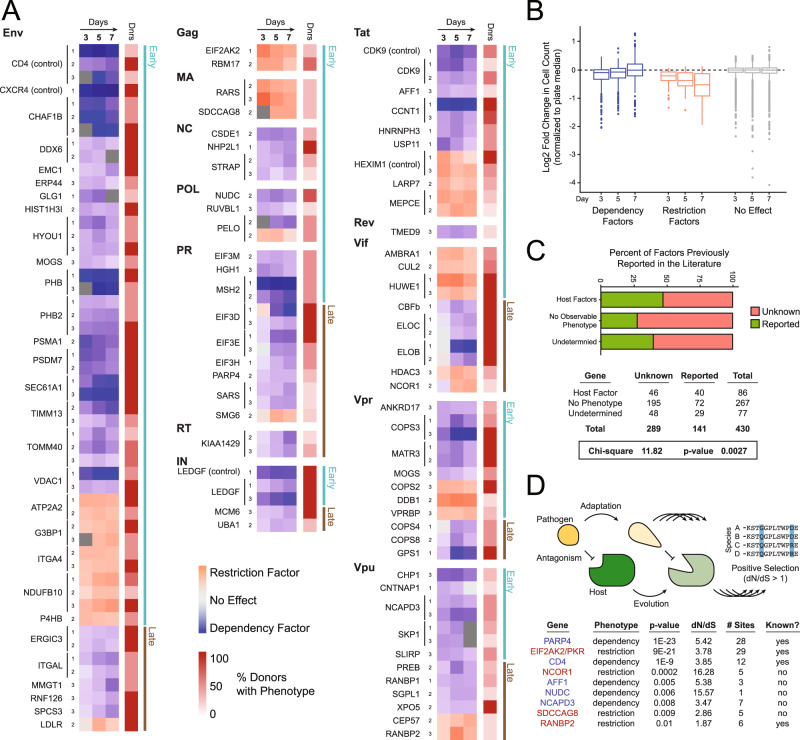
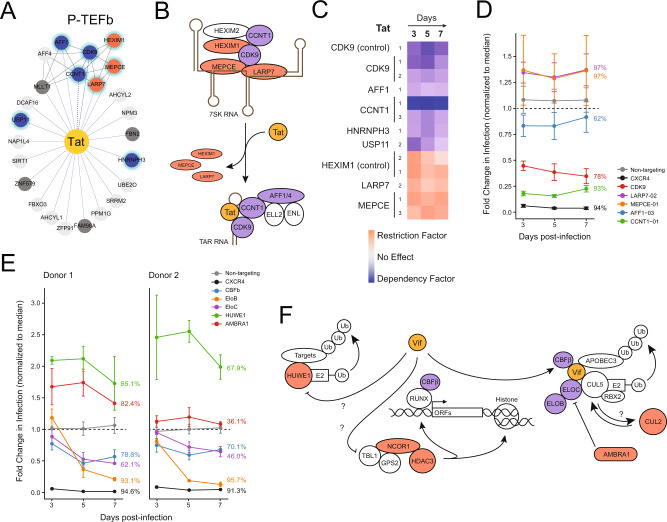
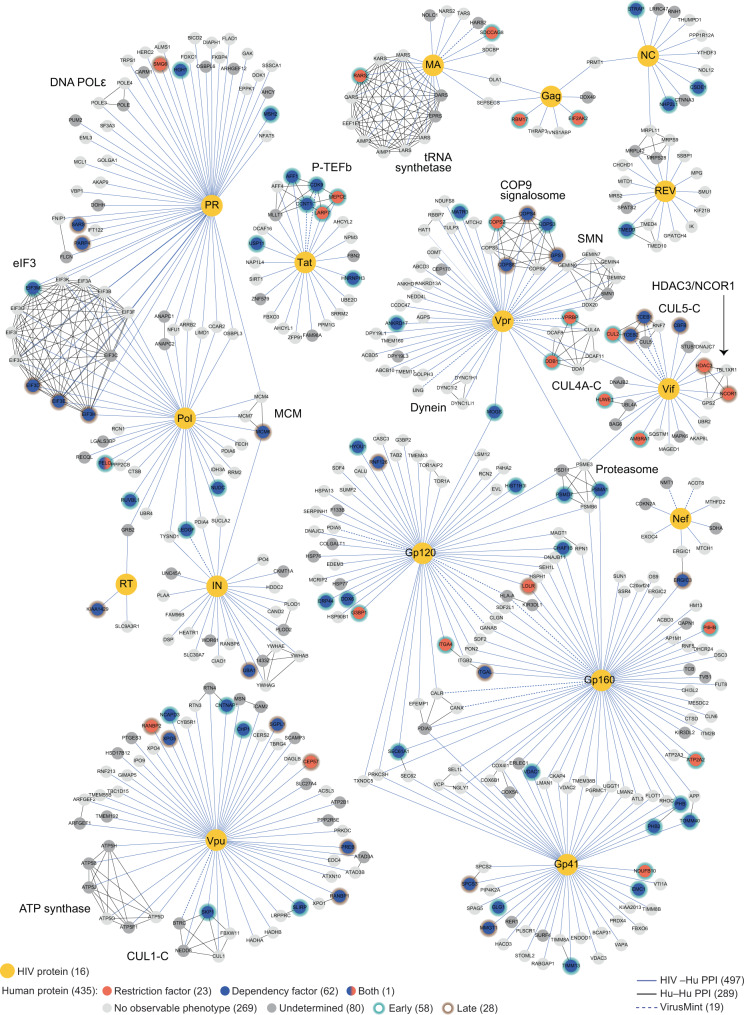
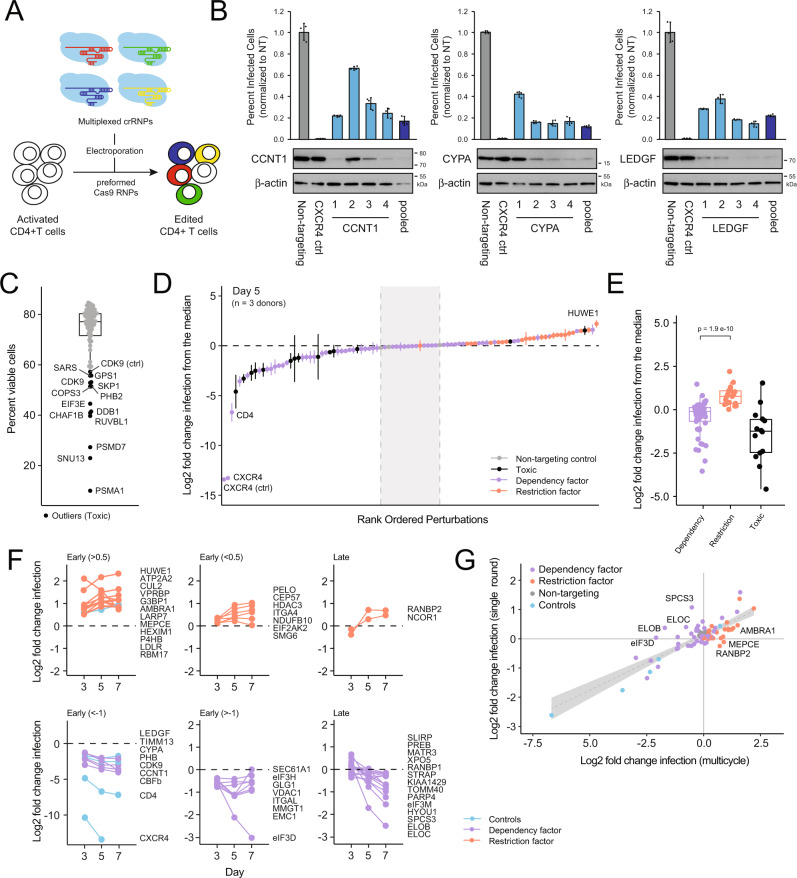
Human Immunodeficiency Virus (HIV) relies on host molecular machinery for replication. Systematic attempts to genetically or biochemically define these host factors have yielded hundreds of candidates, but few have been functionally validated in primary cells. Here, we target 426 genes previously implicated in the HIV lifecycle through protein interaction studies for CRISPR-Cas9-mediated knock-out in primary human CD4+ T cells in order to systematically assess their functional roles in HIV replication. We achieve efficient knockout (>50% of alleles) in 364 of the targeted genes and identify 86 candidate host factors that alter HIV infection. 47 of these factors validate by multiplex gene editing in independent donors, including 23 factors with restrictive activity. Both gene editing efficiencies and HIV-1 phenotypes are highly concordant among independent donors. Importantly, over half of these factors have not been previously described to play a functional role in HIV replication, providing numerous novel avenues for understanding HIV biology. These data further suggest that host-pathogen protein-protein interaction datasets offer an enriched source of candidates for functional host factor discovery and provide an improved understanding of the mechanics of HIV replication in primary T cells.


Conflict of interest statement

A.M. is a compensated cofounder, member of the boards of directors, and a member of the scientific advisory boards of Spotlight Therapeutics and Arsenal Biosciences. A.M. is a cofounder, member of the boards of directors, and a member of the scientific advisory board of Survey Genomics. A.M. is a compensated member of the scientific advisory board of NewLimit. A.M. owns stock in Arsenal Biosciences, Spotlight Therapeutics, NewLimit, Survey Genomics, PACT Pharma, and Merck. AM has received fees from 23andMe, PACT Pharma, Juno Therapeutics, Trizell, Vertex, Merck, Amgen, Genentech, AlphaSights, Rupert Case Management, Bernstein, and ALDA. A.M. is an investor in and informal advisor to Offline Ventures and a client of EPIQ. The Marson lab has received research support from Juno Therapeutics, Epinomics, Sanofi, GlaxoSmithKline, Gilead, and Anthem. N.J.K. has consulting agreements with the Icahn School of Medicine at Mount Sinai, New York, Maze Therapeutics, and Interline Therapeutics. He is a shareholder in Tenaya Therapeutics, Maze Therapeutics and Interline Therapeutics, and is financially compensated by GEn1E Lifesciences, Inc. and Twist Bioscience Corp. The Krogan Laboratory has received research support from Vir Biotechnology and F. Hoffmann-La Roche.

Figures

Fig. 1
Fig. 1. An arrayed screening pipeline for HIV host-factor identification.
A Schematic of the HIV host-factor screen design using high-throughput CRISPR–Cas9 gene editing in primary CD4+ T cells. B Scatterplots of the log2 fold change in infection relative to the plate median for each gRNA after data processing compared across technical replicates. C S-curve plots of the log2 fold change in infection relative to the plate median for each gRNA in every donor, rank-ordered by timepoint. The dashed red line indicates median; green dots represent CXCR4-targeting control gRNA and black dots represent nontargeting gRNA. D Box-and-whisker plot of the distribution of log2-normalized HIV infection rates for each control gRNA at each timepoint. Total n after filtering is indicated below each box; center line, median; box limits, upper and lower quartiles; whiskers, 1.5x interquartile range; points, outliers.
Fig. 2
Fig. 2. Next-generation sequencing reveals efficient and reproducible editing.
A Schematic of the deep-sequencing approach to quantify mutational efficiency for each gRNA. B Histograms depicting the allelic knockout efficiency for the most efficient (red), middle (green), and least-efficient (blue) gRNA per gene. Median values of each group are indicated by dashed vertical lines. C Representative scatterplot of mutational efficiency in a subset of randomly selected gRNA across two independent donors (r2 mean = 0.745, range 0.722–0.772 over 100 randomizations). D Scatterplot of mutational efficiency versus the log2 fold change in infection relative to the plate median for each gRNA at days 3 (left), 5 (middle), and 7 (right). Each gRNA dot is colored by phenotypic outcome based on empirically determined cutoffs to achieve a 1% false-positive rate.
Fig. 3
Fig. 3. Identification of 86 candidate HIV host factors in primary CD4+ T cells.
A Heatmap of the donor-average log2-normalized HIV-infection rate at each timepoint for each gRNA called as a hit (purple = decreased infection, pink = increased infection). Each gRNA is grouped by the HIV protein the target gene was found to interact with physically and by early- versus late-presenting phenotypes on the far left. Only donors that reached significance were included in the averages; the percent of donors showing the phenotype are indicated in an adjacent, red-colored heatmap. B Box-and-whisker plot of the distribution of log2-normalized cell counts per day for called dependency factors, restriction factors, and genes with no phenotype; center line, median; box limits, upper and lower quartiles; whiskers, 1.5x interquartile range; points, outliers. C Horizontal stacked bar chart representing the percent of factors previously reported to be HIV host factors in the NCBI GeneRIF database (green) per phenotypic designation, Chi-square test and p-value reported below. D Theoretical example of a host–pathogen arms race driving positive selection (top) with a table summarizing genes found under evolutionary positive selection in this study (bottom). The table summarizes the gene under selection (blue = candidate dependency factor, red = candidate restriction factor), the phenotype reported here, the ratio of nonsynonymous to synonymous changes in the gene body (dN/dS), p-value, number of sites under selective pressure, and if selection had been previously reported. A likelihood-ratio test was used to obtain a p-value, by comparing twice the difference in log-likelihoods with the chi-squared distribution with one degree of freedom; the Benjamini–Hochberg procedure was used to control the false-discovery rate.
Fig. 4
Fig. 4. A functional map of HIV Tat and Vif complexes.
A HIV Tat (yellow) is connected by blue edges to protein–protein interactors; black edges connect known human complexes (Corum database),. Candidate or known dependency and restriction factors are annotated with blue and red nodes, respectively; all Tat interactors have early-acting phenotypes and thus are annotated with green halos. Factors determined to have no functional role in HIV infection are light gray, while those of undetermined phenotype are in dark gray. B A schematic model of superelongation complex formation by HIV Tat. Host factors with identified dependency or restriction factor phenotypes in the study are colored blue or red, respectively. C Heatmap of the donor-average log2-normalized HIV-infection rate at each timepoint for each gRNA called as a hit (purple = decreased infection, pink = increased infection), focused on Tat-interacting factors. D Fold change in HIV infection upon knockout of a subset of Tat interactors. Points represent an average of three technical replicates in cells from two donors ±SD. Average mutational efficiency of each guide across donors is annotated at the right of each line. E Fold change in HIV infection upon knockout of a subset of Vif interactors. Points represent an average of three technical replicates ±SD for two donors plotted independently. The mutational efficiency of each guide is annotated at the right of each line. F Schematic depicting putative functions of known and novel HIV Vif-interacting PPIs. Shading indicates dependency (blue) or restriction factors (red) in this study.
Fig. 5
Fig. 5. A functional map of HIV-host interactions.
HIV proteins (yellow) are connected by blue edges to protein–protein interactors; black edges connect known human complexes (Corum database); dotted lines represent annotated HIV-host PPIs in the VirusMint database. Candidate dependency and restriction factors are represented as blue and red nodes, respectively. Candidate host factors with early-acting or late-acting phenotypes have green or brown halos, respectively. Factors with no functional role in HIV infection observed here are light gray, while those of undetermined phenotype are dark gray. Figure is adapted from.
Fig. 6
Fig. 6. Hit validation using multiplexed gRNA.
A Schematic of the multiplex gRNA approach for gene knock out in primary CD4+ T cells. B Bar charts depicting percent HIV-infected cells post challenge upon knockout with individual gRNA 1 through 4 versus a multiplexed pool of gRNAs 1 through 4 (average of technical triplicates ±SD). Western blots below depict protein depletion for each targeted gene. Three independent loci were targeted: CCNT1 (left), CYPA (middle), and LEDGF (right). C Box-and-whisker plot of the average percent of live CD4 + T cells in each well four days after electroporation with multiplexed gRNA; center line, median; box limits, upper and lower quartiles; whiskers, 1.5x interquartile range; black points, outliers. Outlier points are considered toxic and are labeled by targeted gene name. D S-curve plot of the log2 fold change in infection relative to the plate median at day 5 for each multiplexed gRNA, averaged across all 3 donors ±SD. The dashed black line indicates the median; the dashed gray lines represent the nontargeting range. Dots are colored by toxicity and by phenotype in the original screen as indicated. E Box-and-whisker plot of the distribution of log2-normalized HIV-infection rates for dependency factors (n = 52) versus restriction factors (n = 21) versus essential genes (n = 13) at day 5. Center line, median; box limits, upper and lower quartiles; whiskers, 1.5x interquartile range; p-value reflects a two-sided Wilcoxon rank-sum test comparing dependency factors and restriction factors each measured in three biologically independent replicates. F Line chart of log2-normalized HIV-infection rates over time for each validated hit (two-sided Wilcoxon rank-sum test, p-value < 0.1 at multiple timepoints). Restriction factors are shown above and dependency factors shown below with relevant controls. Genes with significant differences at day 3 are coded “early” and sorted by magnitude of effect; genes with significant differences at only days 5 or 7 are coded as “late”. G Log2-normalized HIV-infection rates at day 5 after multicycle replication versus at day 3 after single-cycle replication in the presence of Saquinavir. The linear regression line with 95% confidence interval is shown in gray.

References

    1. Archin NM, Margolis DM. Emerging strategies to deplete the HIV reservoir. Curr. Opin. Infect. Dis. 2014;27:29–35. - PMC - PubMed
    1. Deeks SG, Lewin SR, Bekker LG. The end of HIV: Still a very long way to go, but progress continues. PLoS Med. 2017;14:e1002466. - PMC - PubMed
    1. Richman DD, et al. The challenge of finding a cure for HIV infection. Science. 2009;323:1304–1307. - PubMed
    1. Siliciano JD, Siliciano RF. HIV-1 eradication strategies: design and assessment. Curr. Opin. HIV AIDS. 2013;8:318–325. - PMC - PubMed
    1. Harris RS, Hultquist JF, Evans DT. The restriction factors of human immunodeficiency virus. J. Biol. Chem. 2012;287:40875–40883. - PMC - PubMed

Publication types