. 2022 Apr 1;13(1):1744.
doi: 10.1038/s41467-022-29394-2.

AF2Complex predicts direct physical interactions in multimeric proteins with deep learning

Affiliations

AF2Complex predicts direct physical interactions in multimeric proteins with deep learning

Mu Gao et al. Nat Commun. .

Abstract

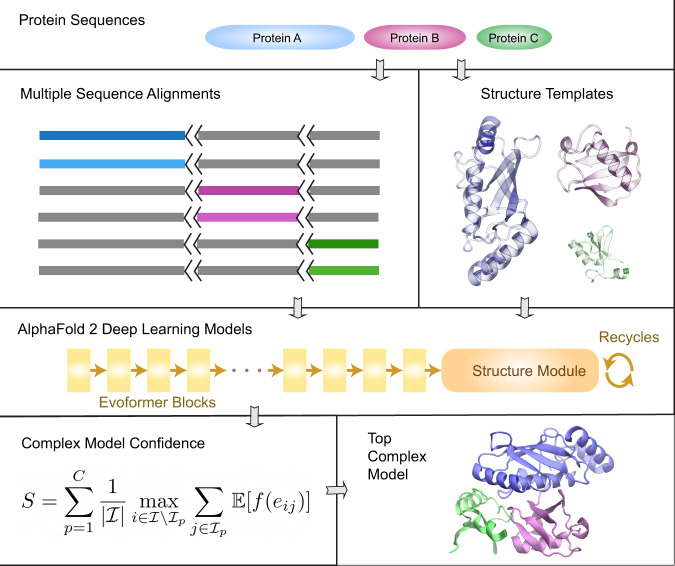
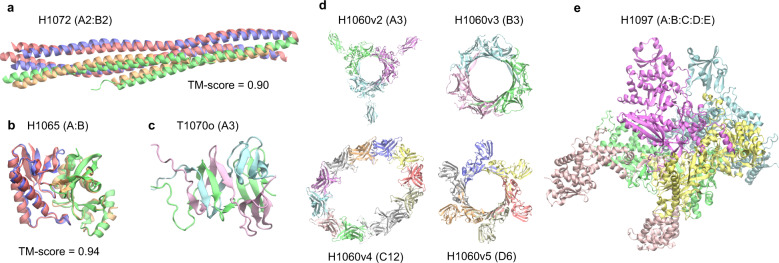
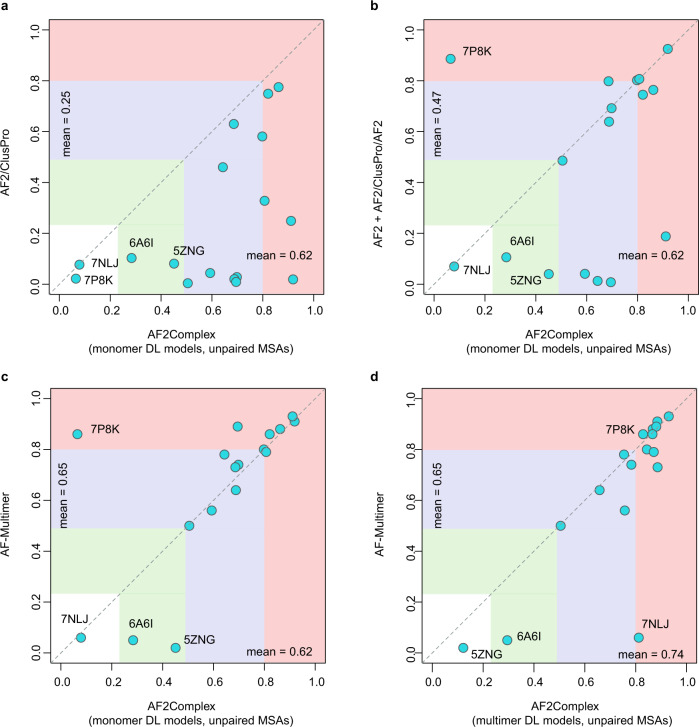
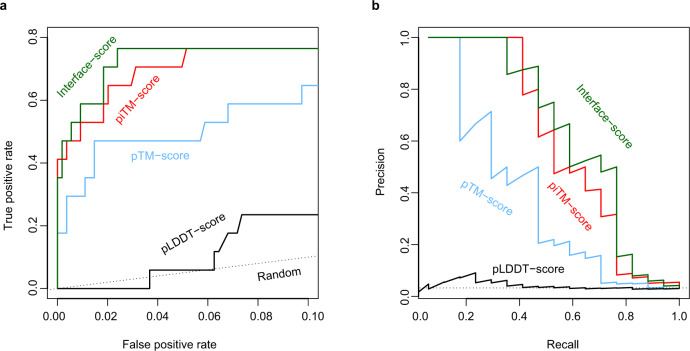
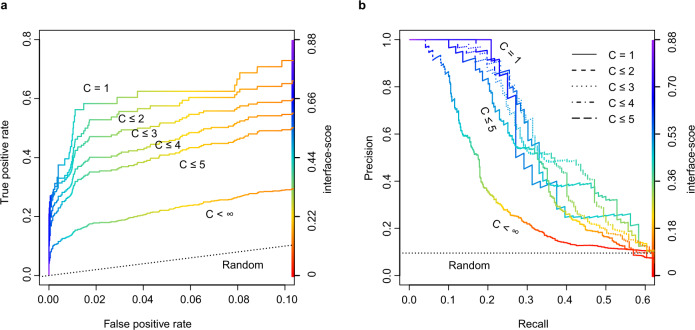
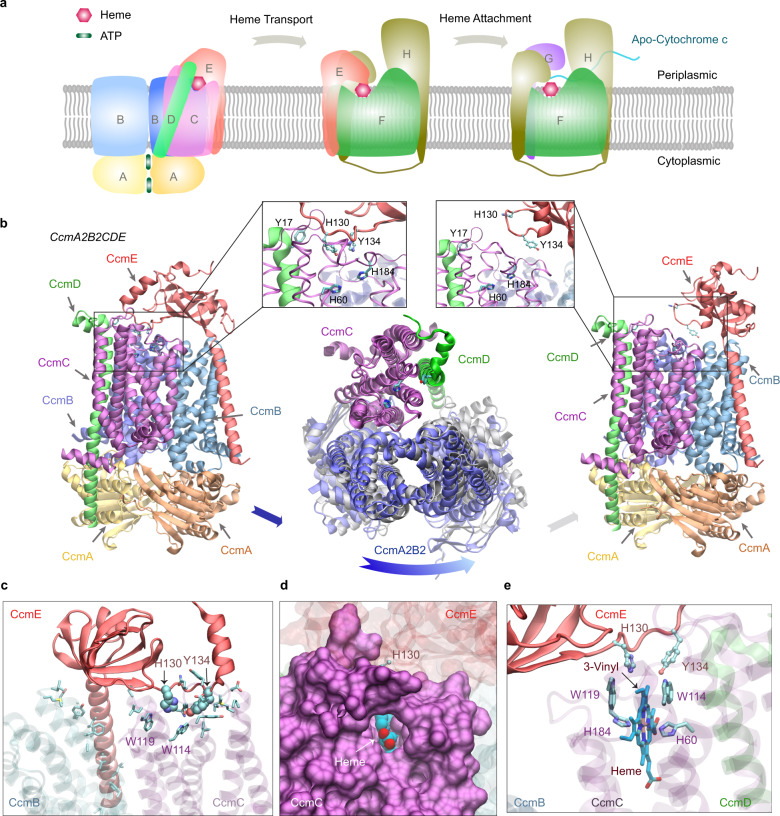
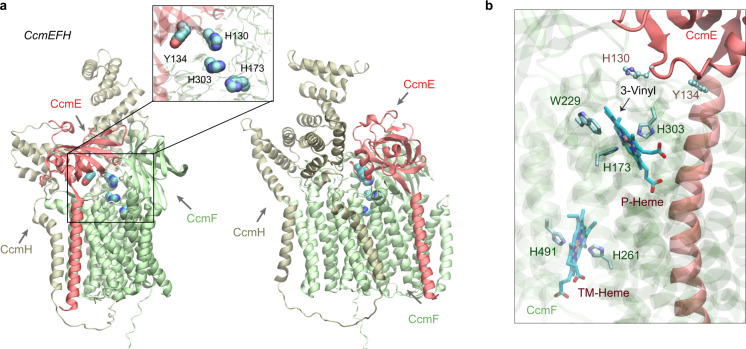
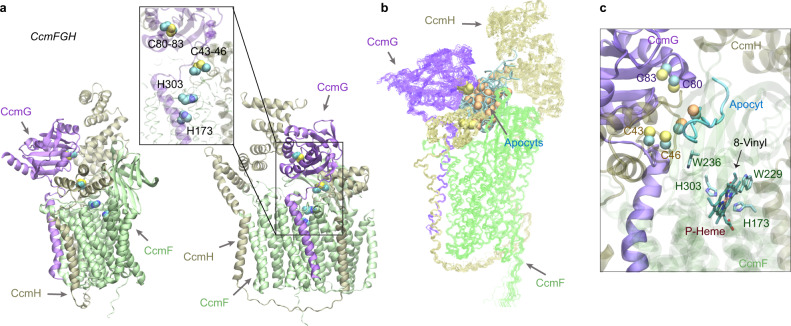
Accurate descriptions of protein-protein interactions are essential for understanding biological systems. Remarkably accurate atomic structures have been recently computed for individual proteins by AlphaFold2 (AF2). Here, we demonstrate that the same neural network models from AF2 developed for single protein sequences can be adapted to predict the structures of multimeric protein complexes without retraining. In contrast to common approaches, our method, AF2Complex, does not require paired multiple sequence alignments. It achieves higher accuracy than some complex protein-protein docking strategies and provides a significant improvement over AF-Multimer, a development of AlphaFold for multimeric proteins. Moreover, we introduce metrics for predicting direct protein-protein interactions between arbitrary protein pairs and validate AF2Complex on some challenging benchmark sets and the E. coli proteome. Lastly, using the cytochrome c biogenesis system I as an example, we present high-confidence models of three sought-after assemblies formed by eight members of this system.


Conflict of interest statement

The authors declare no competing interests.

Figures

Fig. 1
Fig. 1. Overview of the AF2Complex workflow.
The multiple sequence alignments of query protein sequences A (blue), B (purple), and C (green) are joined together by padding gaps (grey) in the MSA regions belonging to other proteins, and the short black lines represent an increase in the residue index to distinguish separate protein chains. Structure templates for individual proteins are also retrieved from the Protein Data Bank. Using these sequence and template features, an AF2 DL model generates a complex model after multiple recycles. The interface residues between proteins in the final complex model are then identified and their interface-score S is calculated to rank model confidence.
Fig. 2
Fig. 2. Top complex models generated by AF2Complex for selected CASP14 assembly targets.
Each target is labeled with its target name, e.g., H1072, followed by its stoichiometry in parentheses, e.g., A2:B2. For targets with available experimental structure coordinates, the similarity between the model and experimental structure is assessed by the TM-score. For other structures only an image of the predicted model is given. Models are colored red and green, and experimental structures are in blue and gold. a SYCE2-TEX12 delta-Ctip complex. b N4-cytosine methyltransferase. c G3M192 from Escherichia virus CBA120. Only the N-terminal domains, which have an intertwined complex structure, are shown from a model of the full trimer. d Four rings from the T5 phage tail subcomplex. e DNA-directed RNA polymerase from Bacillus phage AR9. All images were generated with the program VMD.
Fig. 3
Fig. 3. Comparison of AF2Complex and three alternative approaches on the CP17 set.
The coordinates of the circles correspond to the DockQ scores of the top overall models from each approach versus AF2Complex. a AF2 models docked by ClusPro. b Docking models refined by AF2, plus additional complex models obtained by running AF2 on paired MSAs according to Ref. . (c, d) AlphaFold-Multimer. The AF2 deep learning models trained for the prediction of monomeric protein structures, denoted as “monomer DL models”, were employed by AF2Complex in (A–C), and the AF-Multimer deep learning models, denoted as “multimer DL models”, were applied with AF2Complex in (d). All MSA inputs to AF2Complex are unpaired as described in Methods. Vertical and horizontal blocks represent the regions of incorrect (white), acceptable (green), medium (blue), and high-quality (red) complex models according to the DockQ score. The four most challenging targets are marked by their four-letter PDB accession codes.
Fig. 4
Fig. 4. Identification of true interacting protein pairs in the all-against-all pool for the CP17 set by various confidence metrics.
a Receiver operating characteristic curve and (b) the precision-recall curve. The random curve is the expected result by randomly guessing interacting protein pairs. piTM-, pTM- and pLDDT-score denote predicted interface TM-score, predicted TM-score, and predicted local distance difference test score, respectively.
Fig. 5
Fig. 5. A large-scale test on the E. coli proteome suggests that many pairs previously thought to interact directly are likely in assemblies of components that are not necessarily in direct contact.
The interface-score was used as the varying metric to derive the (a) ROC curve and (b) the precision-recall curve. For a dimer target, C is defined by the maximum of the appearances of its two monomers in this data set.
Fig. 6
Fig. 6. E. coli cytochrome c maturation system I.
a An illustration of the Ccm I system, composed of eight proteins named CcmABCDEFGH. The system covalently attaches heme molecules to cytochrome c proteins via three functional complexes. b Two models (left and right panels) of one complex: CcmA2B2CD engage CcmE (left panel) and disengage CcmE (right panel). which loads a heme from CcmA2B2CD and chaperones it to CcmF. Insets show conserved residues implicated for heme binding in CcmC, CcmD, and CcmE, respectively. Conformational differences between these two models are shown in the middle panel, where the backbone of CcmC was used to superimpose the two models. Viewed from the periplasmic side, the two conformations of CcmA2B2 are displayed in blue and grey. Movement relative to CcmC is evident in CcmA2B2 but not in CcmD. For clarity, CcmE is omitted in this superposition plot. c A view of interactions between CcmCD and CcmE in their engaged structural model shown in the left panel of (a). CcmCD representations are transparent for clarity. The side chains of interacting residues are shown. His130 and Tyr134 of CcmE are shown in the van der Waals representation, and other interacting residues, including Trp114 and Trp119 from the heme-binding WWD domain of CcmC, are shown in the licorice representation. (d, e) Views of a heme molecule bound in the putative binding-pocket in CcmC, using the structural model in which CcmE is bound to CcmA2B2CD as the initial apo structure. A pore for heme access in CcmC manifests, where CcmC is rendered in a surface representation (d). The heme is displayed in van der Waals (d) and licorice (e) representations. The vinyl group expected for His130CcmE attachment is marked in (e).
Fig. 7
Fig. 7. Structural models of the CcmEFH complex from E. coli.
a CcmE is believed to deliver heme to CcmF. Two views of a top model generated by AF2Complex are shown in the cartoon representation. The inset shows the key heme handling residues, His130 and Tyr134 of CcmE and the two histidines of CcmF. b Two heme molecules computationally placed in the expected heme-binding sites of CcmF using the model shown in (a). The critical heme Fe-coordinating residues, His173 (P-His1) and His303 (P-His2) for the P-heme delivered by CcmE and eventually attached to an apo-cytochrome c protein and His261 (TM-His1) and His461 (TM-His2) for the cofactor TM-heme are also shown.
Fig. 8
Fig. 8. Structural models of the CcmFGH complex with and without apo-cytochrome c substrates (apocyts) from E. coli.
a Two views of a top model of CcmFGH are shown in the same orientations as the two views in Fig. 7a, respectively. The CcmH N-terminal domain moves closer to the heme-binding sites of CcmF, leaving space to accommodate CcmG that now binds CcmF with CcmH. Critical cysteines of the CXXC motifs of CcmG (Cys80 and Cys83) and H (Cys43 and Cys46), and the P-heme-binding histidines (His173 and His303) of CcmE are shown in the vdW representations in the inset. b Superposition of 22 AF2Complex  models of the CcmEFH and apocyt acceptors. CcmFGH complexes are shown in lines, and apocyts are shown as cyan tubes. All apocyts are found within the same groove formed by the three Ccm proteins. The superposition used the backbone atoms of CcmFGH as the reference. The sulfur atoms from the CXXC motifs of apocyts are shown in orange spheres to differentiate from those of CcmGH. c A heme molecule computationally docked to the P-heme binding site in CcmF using one of the models shown in (b). One of the Cys residues of apocyt is found within 4 Å from Cys46 of CcmH. The distance between the other Cys residue of apocyt and the 8-vinyl group of the heme is about 16 Å.

Similar articles

Cited by

References

    1. Jumper J, et al. Highly accurate protein structure prediction with AlphaFold. Nature. 2021;596:583–589. - PMC - PubMed
    1. Tunyasuvunakool K, et al. Highly accurate protein structure prediction for the human proteome. Nature. 2021;596:590–596. - PMC - PubMed
    1. Skolnick J, Gao M, Zhou H, Singh S. AlphaFold 2: Why It Works and Its Implications for Understanding the Relationships of Protein Sequence, Structure, and Function. J. Chem. Inf. Model. 2021;61:4827–4831. - PMC - PubMed
    1. Marcotte EM, et al. Detecting Protein Function and Protein-Protein Interactions from Genome Sequences. Science. 1999;285:751–753. - PubMed
    1. Keskin Z, Gursoy A, Ma B, Nussinov R. Principles of protein-protein interactions: What are the preferred ways for proteins to interact? Chem. Rev. 2008;108:1225–1244. - PubMed

Publication types