. 2022 Apr 1;13(1):1747.
doi: 10.1038/s41467-022-29470-7.

Unprecedented decline of Arctic sea ice outflow in 2018

Affiliations

Unprecedented decline of Arctic sea ice outflow in 2018

Hiroshi Sumata et al. Nat Commun. .

Abstract

Fram Strait is the major gateway connecting the Arctic Ocean and North Atlantic Ocean, where nearly 90% of the sea ice export from the Arctic Ocean takes place. The exported sea ice is a large source of freshwater to the Nordic Seas and Subpolar North Atlantic, thereby preconditioning European climate and deep water formation in the North Atlantic Ocean. Here we show that in 2018, the ice export through Fram Strait showed an unprecedented decline since the early 1990s. The 2018 ice export was reduced to less than 40% relative to that between 2000 and 2017. The minimum export is attributed to regional sea ice-ocean processes driven by an anomalous atmospheric circulation over the Atlantic sector of the Arctic. The result indicates that a drastic change of the Arctic sea ice outflow and its environmental consequences happen not only through Arctic-wide ice thinning, but also by regional scale atmospheric anomalies.


Conflict of interest statement

The authors declare no competing interests.

Figures

Fig. 1
Fig. 1. Sketch of the Arctic Ocean and subarctic seas with sea ice drift pattern and ocean currents through Fram Strait.
BS Barents Sea, CB Canada Basin, EB Eurasian Basin, EGC East Greenland Current (thick black arrow), ESS East Siberian Shelf, FS Fram Strait (thick magenta line), GL Greenland, KS Kara Sea, LS Laptev Sea, NS Nordic Seas, SB Svalbard, TDS transpolar drift stream (thick sky blue arrow), WSC West Spitsbergen Current (thick orange arrow). The background color shows mean sea ice concentration in winter (January–March, 1980–2018 mean), and small blue arrows show annual mean sea ice drift field in 1980–2018.
Fig. 2
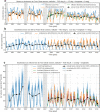
Fig. 2. Daily time series of sea ice properties in Fram Strait for 2016–2018 period.
a Easternmost site F11 and b westernmost site F14. The black lines depict annual mean effective ice thickness in each year, the period and value of which are shown by arrows and a number. The annual mean values are defined by an average from October of preceding year to September of the year. A longer time series (2003–2018) of daily sea ice properties of all moorings (F11–F14) can be found in Fig. S14 in the supplementary material.
Fig. 3
Fig. 3. Monthly mean time series of sea ice properties at the Fram Strait section for 1990–2018.
a Ice thickness, b southward ice drift speed, and c southward ice volume transport. Estimates from different data sources are shown in different color. Annual mean values are calculated from averages from October of preceding year to September of the year to represent the seasonal cycles of sea ice formation and melt. See method section for detail. AWI CS2smos product is used in the thickness time series in a and southward volume transport in c.
Fig. 4
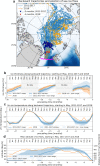
Fig. 4. Backward trajectory map and reconstructions of associated physical properties.
a trajectories of sea ice floes which arrived at Fram Strait in May, 2011–2017 and 2018, and reconstructions of b ice thickness, c 2 m air temperature, and d latitude along the trajectories back in time. The magenta line in panel a shows Fram Strait. The right edge of the panels bd denotes arrivals of the ice floes at Fram Strait, while the left edge denotes 2.5 year (30 months) before the arrival. Corresponding months are shown at the top of the panels bd. The ice thickness in panel b shows an average of independent reconstructions by three different ice thickness products (AWI CS2smos, Univ. Bristol, and NERC-CPOM) derived from CS2smos/CS2. The 2 m air temperature in panel c is obtained from ERA5. See method section for a description.
Fig. 5
Fig. 5. Spatial pattern and time series of sea-level pressure anomaly, wind field, and 2 m air temperature over the Fram Strait area from European Center for Medium-Range Weather Forecasts Reanalysis v5 (ERA5).
a Sea-level pressure anomaly in February, 2018 relative to 1990–2018 mean, b wind and pressure field in February, 2018, time series of c sea-level pressure difference between the Barents Sea and Greenland, d 10 m meridional wind over the Fram Strait area, and e 2 m air temperature anomaly in the north of Fram Strait. The pressure difference is calculated from the averages in the two black polygons shown in panel a, used in Tsukernik et al. (2010). The 10 m meridional wind and 2 m air temperature anomaly are calculated by an average in the green polygon and the blue sector in panel a. The gray shades shown in panels c, d, and e depict positive pressure difference (Barents Sea—Greenland) larger than 5 hPa on monthly basis.

References

    1. Peterson BJ, et al. Trajectory shifts in the Arctic and subarctic freshwater cycle. Science. 2006;313:1061–1066. - PubMed
    1. Carmack EC, et al. Freshwater and its role in the Arctic Marine System: sources, disposition, storage, export, and physical and biogeochemical consequences in the Arctic and global oceans. J. Geophys. Res. Biogeosci. 2015;121(3):675–717.
    1. Dai A, Trenberth KE. Estimates of freshwater discharge from continents: latitudinal and seasonal variations. J. Hydrometeorol. 2002;3:660–687.
    1. Foukal NP, Gelderloos R, Pickart RS. A continuous pathway of freshwater along the East Greenland shelf. Sci. Adv. 2020;6:eabc424. - PMC - PubMed
    1. Greene CH, Pershing PJ. Climate drives sea change. Science. 2007;315:1084–1085. - PubMed

Publication types