. 2022 Apr 1;13(1):1762.
doi: 10.1038/s41467-022-29378-2.

Biological invasions facilitate zoonotic disease emergences

Affiliations

Biological invasions facilitate zoonotic disease emergences

Lin Zhang et al. Nat Commun. .

Abstract

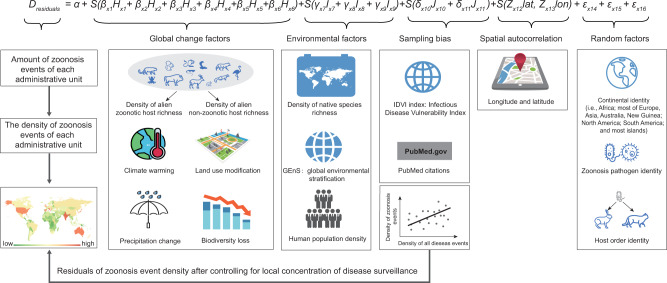
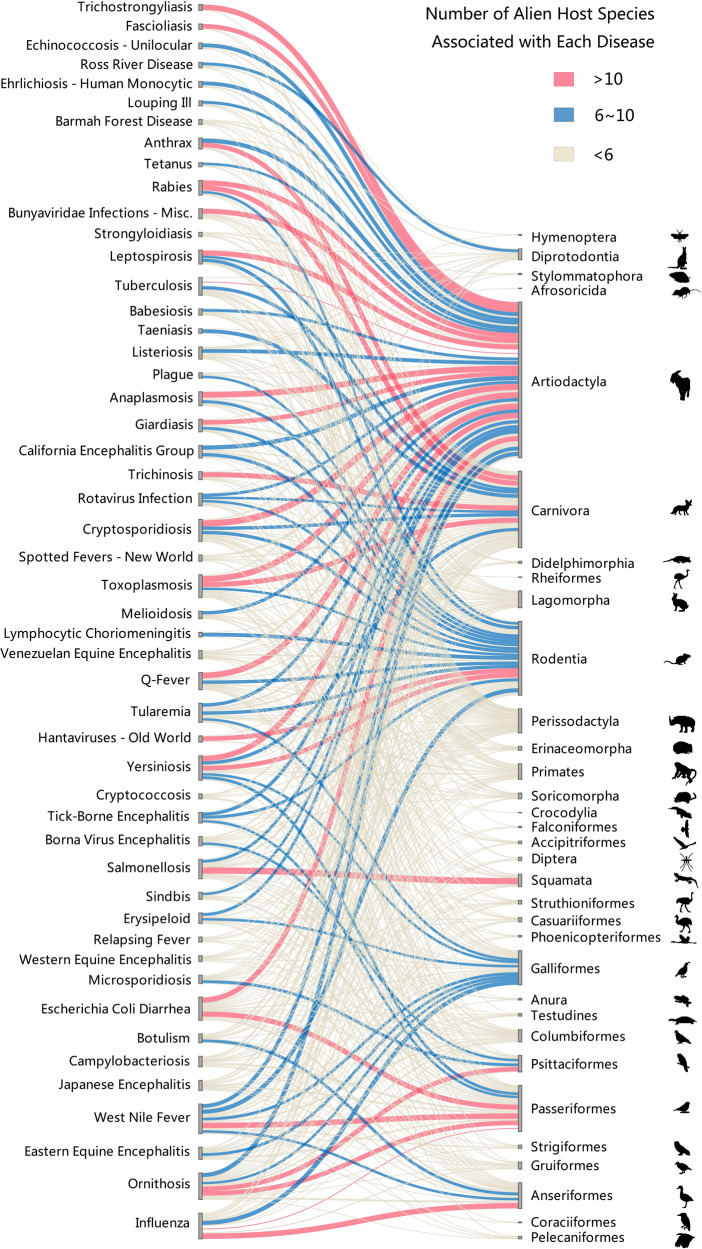
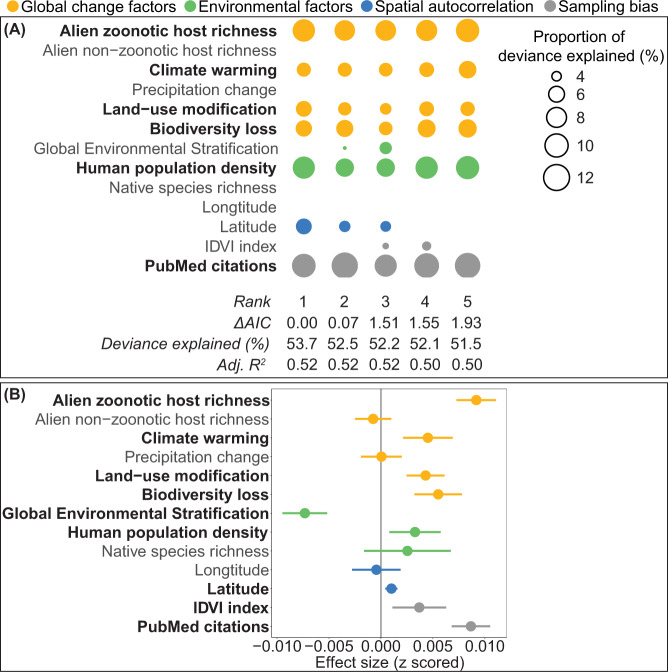
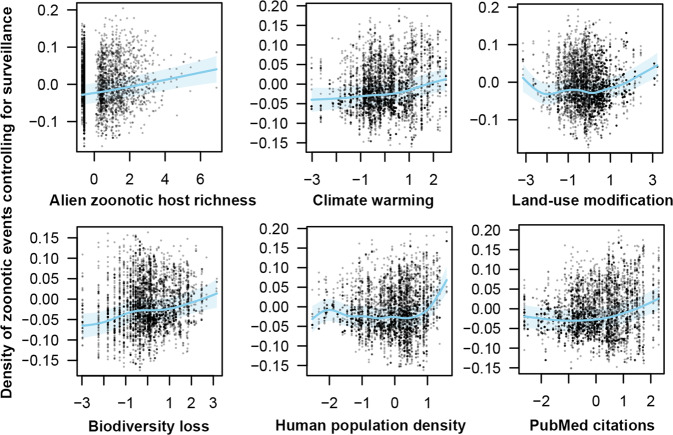
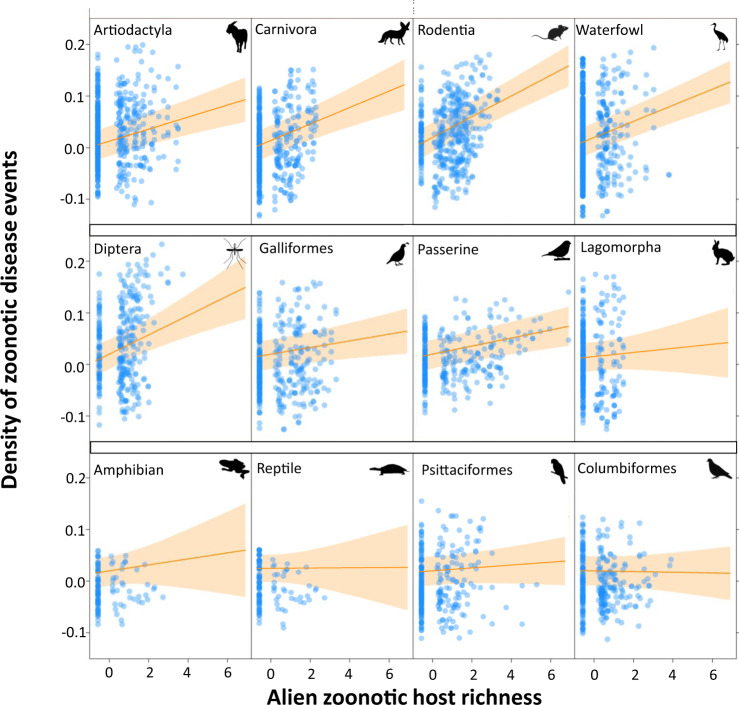
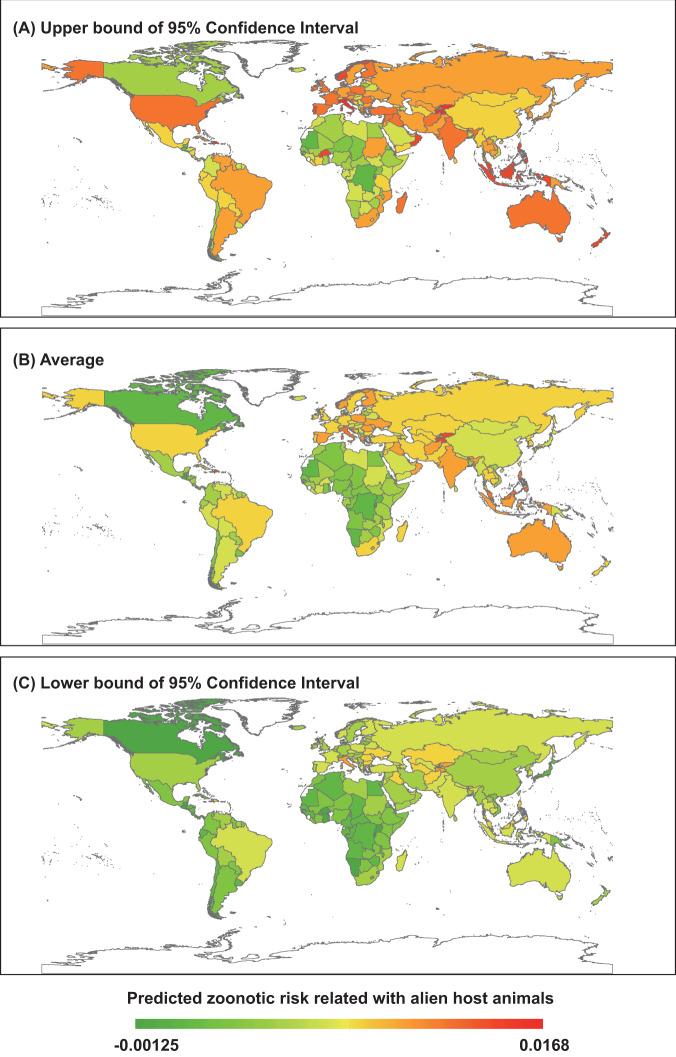
Outbreaks of zoonotic diseases are accelerating at an unprecedented rate in the current era of globalization, with substantial impacts on the global economy, public health, and sustainability. Alien species invasions have been hypothesized to be important to zoonotic diseases by introducing both existing and novel pathogens to invaded ranges. However, few studies have evaluated the generality of alien species facilitating zoonoses across multiple host and parasite taxa worldwide. Here, we simultaneously quantify the role of 795 established alien hosts on the 10,473 zoonosis events across the globe since the 14th century. We observe an average of ~5.9 zoonoses per alien zoonotic host. After accounting for species-, disease-, and geographic-level sampling biases, spatial autocorrelation, and the lack of independence of zoonosis events, we find that the number of zoonosis events increase with the richness of alien zoonotic hosts, both across space and through time. We also detect positive associations between the number of zoonosis events per unit space and climate change, land-use change, biodiversity loss, human population density, and PubMed citations. These findings suggest that alien host introductions have likely contributed to zoonosis emergences throughout recent history and that minimizing future zoonotic host species introductions could have global health benefits.


Conflict of interest statement

The authors declare no competing interests.

Figures

Fig. 1
Fig. 1. Analysis diagram to estimate the effect of alien animal invasions on zoonosis emergences at the global scale.
The role of alien animal zoonotic hosts was determined by accounting for global change factors (Hx1-x6), environmental factors (Ix7-x9), sampling bias (Jx10,11), spatial autocorrelation (Llat, lon), and a lack of independence among zoonoses by treating pathogen, host order and continent as random factor intercepts (εx14-x16). Thin-plate spline smooths for each predictor variable are designated by S(), and α, β, γ, δ, and Z are constants (α is an intercept and β, γ, δ and Z represent the coefficient estimates of different predictor variables, and ε represents the random effects). Silhouettes were freely obtained from “islide” plug-in (https://www.islide.cc).
Fig. 2
Fig. 2. Associations between the zoonotic diseases reported by the GIDEON database and alien zoonotic hosts.
Bipartite network analysis shows the relatedness between the top 50 zoonoses with the largest number of alien zoonotic host species and the alien zoonotic host orders. The exact number of zoonotic diseases per alien zoonotic host is provided in Supplementary Data 3. Width indicates the number of zoonotic diseases carried by alien zoonotic host species in each order. The order of figure column is based on the default output of the R software to minimize the number of crossovers. Animal silhouettes were obtained from PhyloPic.
Fig. 3
Fig. 3. Proportion of deviance explained and effect size of each predictor variable in model averaging analyses based on GAMMs.
Columns represent individual models and rows represent predictor variables, with smoothing function knot value = 10. Shown in bold are the variables that appear in all five of the most highly supported models in panel A and that have model-averaged 95% confidence intervals that do not overlap zero in panel B. The circle size in panel A represents the proportion of deviance explained by each predictor and any blanks indicate that the predictor is not included in the model. The panel B represents mean effect sizes with 95% confidence intervals of different predictor variables explaining the number of zoonosis events worldwide (n = 10,473, Supplementary Data 4).
Fig. 4
Fig. 4. Relationships of the six most important predictor variables with zoonosis emergences in the five highly supported models.
Scatter plots represent the partial residuals of each smoothed variable when controlling for other variables. Blue lines show the predicted function of each variable with mean and the shaded area as the 95% confidence band based on GAMMs. The dependent variable (zoonosis event density) is treated as the residuals of the fitted regression correlating the density of zoonosis events and the density of all disease events to account for the degree of overall disease surveillance (Supplementary Data 4). All predictor variables were standardized (to a mean of zero and standard deviation of one) before entering the model.
Fig. 5
Fig. 5. The relationship of alien zoonotic animal richness and the zoonosis emergences across alien host groups.
The strength of each host group is tested by including an interaction between the richness of alien zoonotic species with each of the 12 host orders identified as important in the GAMMs after accounting for other co-factors. Each host order had established alien populations in at least 50 administrative units. Lines show the predicted relationship between density of zoonotic disease events and alien zoonotic host richness, with mean and the shaded area as the 95% confidence band (Supplementary Data 4). All predictor variables were standardized (to a mean of zero and standard deviation of one) before entering the model. Animal silhouettes were obtained from PhyloPic.
Fig. 6
Fig. 6. Global map showing the potential contribution of alien zoonotic host introductions to zoonosis events of each administrative area at the global scale.
Maps are derived for predicted zoonosis events caused by alien host species and the relative risk is calculated by subtracting the GAMM fitted values excluding the zoonotic host introduction from those using all predictor variables in Supplementary Data 4.

References

    1. Jones KE, et al. Global trends in emerging infectious diseases. Nature. 2008;451:990–U994. - PMC - PubMed
    1. Dobson AP, et al. Ecology and economics for pandemic prevention. Science. 2020;369:379–381. - PubMed
    1. Schindler S, Staska B, Adam M, Rabitsch W, Essl F. Alien species and public health impacts in Europe: a literature review. NeoBiota. 2015;27:1.
    1. Young HS, Parker IM, Gilbert GS, Sofia Guerra A, Nunn CL. Introduced species, disease ecology, and biodiversity–disease relationships. Trends Ecol. Evol. 2017;32:41–54. - PubMed
    1. Chinchio E, et al. Invasive alien species and disease risk: an open challenge in public and animal health. PLoS Pathog. 2020;16:e1008922. - PMC - PubMed

Publication types