. 2022 Apr 1;12(1):5535.
doi: 10.1038/s41598-022-09070-7.

Improved calibration of electrochemical aptamer-based sensors

Affiliations

Improved calibration of electrochemical aptamer-based sensors

Alex M Downs et al. Sci Rep. .

Abstract

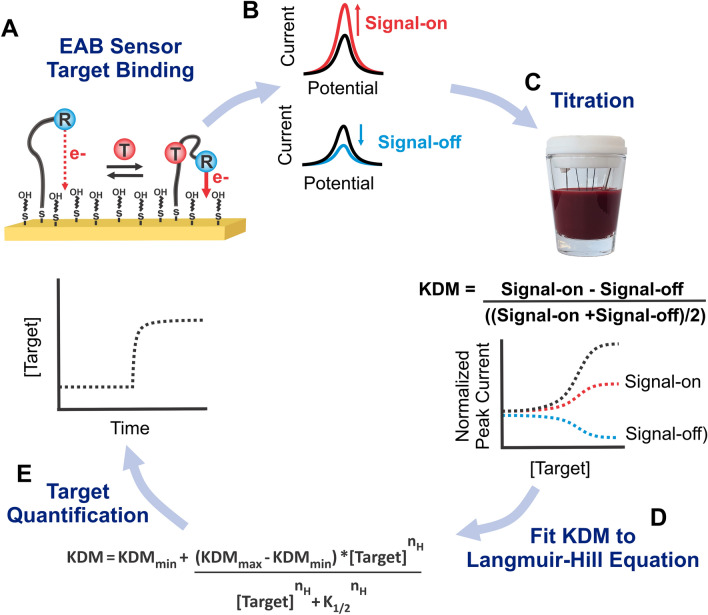
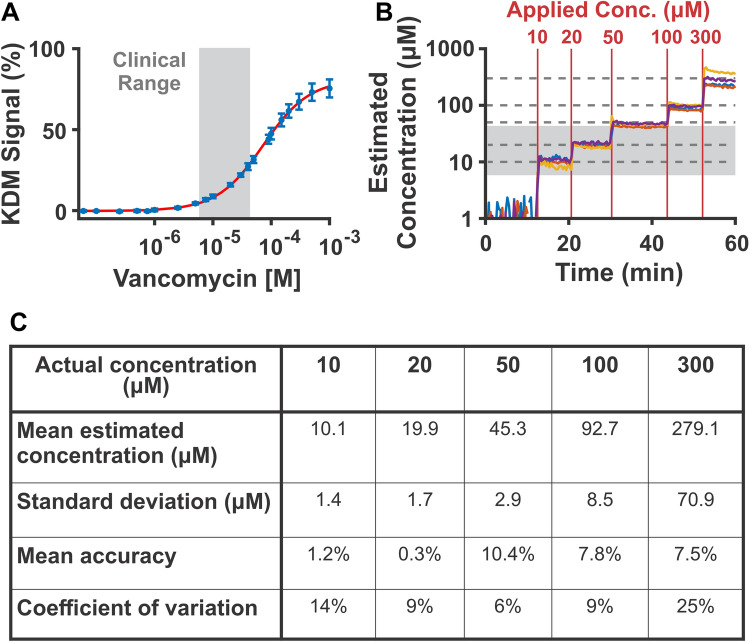
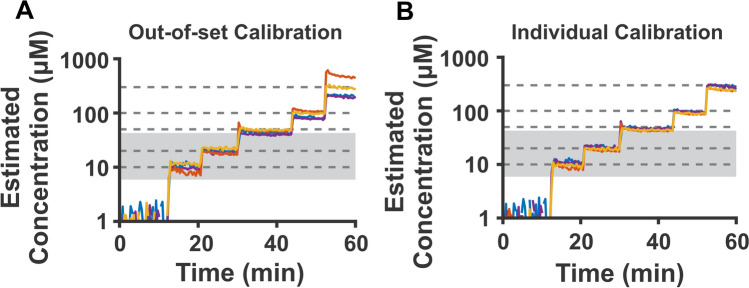
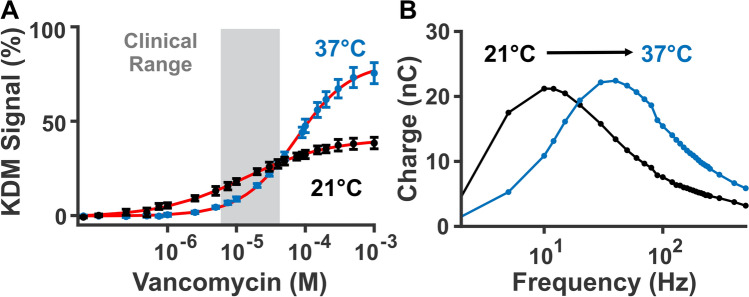
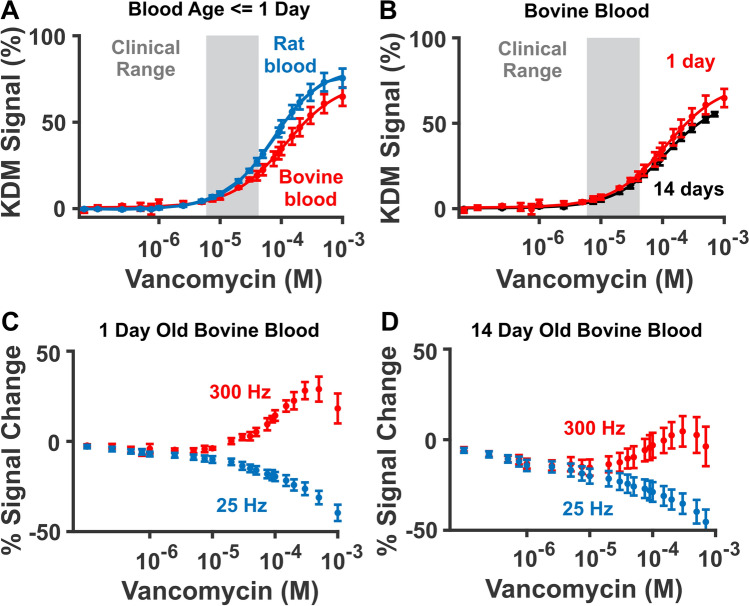
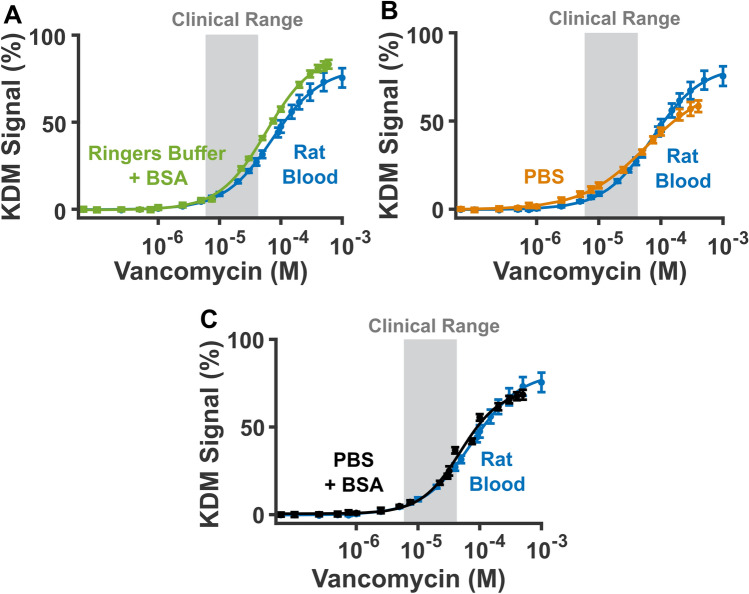
Electrochemical aptamer-based (EAB) sensors support the real-time, high frequency measurement of pharmaceuticals and metabolites in-situ in the living body, rendering them a potentially powerful technology for both research and clinical applications. Here we explore quantification using EAB sensors, examining the impact of media selection and temperature on measurement performance. Using freshly-collected, undiluted whole blood at body temperature as both our calibration and measurement conditions, we demonstrate accuracy of better than ± 10% for the measurement of our test bed drug, vancomycin. Comparing titrations collected at room and body temperature, we find that matching the temperature of calibration curve collection to the temperature used during measurements improves quantification by reducing differences in sensor gain and binding curve midpoint. We likewise find that, because blood age impacts the sensor response, calibrating in freshly collected blood can improve quantification. Finally, we demonstrate the use of non-blood proxy media to achieve calibration without the need to collect fresh whole blood.


Conflict of interest statement

K.W.P. discloses service on the scientific advisory boards of Diagnostic Biochips Inc. and Nutromics, both of which are developing applications related to this work. All other authors have no competing interest/conflict of interest to declare.

Figures

Figure 1
Figure 1
(A) EAB sensors consist of a redox-reporter-modified (R) aptamer attached to a gold electrode coated with a passivating self-assembled monolayer (here 6-mercapto-1-hexanol). Upon binding of target (T), a change in electron transfer kinetics between the redox reporter and the surface occurs, which is easily monitored using square wave voltammetry. (B) Depending upon the square-wave frequency employed, the peak currents seen in square wave voltammetry will increase (“signal on” behavior) or decrease (“signal off”) in response to target binding. (C) To determine responses at different frequencies, we titrate the sensors with known amounts of target. To increase gain and correct for the appearance of drift, we obtain Kinetic Differential Measurement (KDM) values by taking the difference in normalized peak currents collected at a signal-on and a signal-off frequency, then dividing that value by the average of the signal-on and signal-off peak currents. (D) We then fit the KDM values to a Hill-Langmuir equation, extracting parameters for KDMmax (the maximum KDM response, or gain) KDMmin and K1/2. (E) Using these parameters, we convert observed KDM measurements into concentration estimates.
Figure 2
Figure 2
Vancomycin-detecting EAB sensors calibrated using a calibration curve collected in matched media and temperature easily achieve clinically useful measurement accuracy. (A) Here we created a calibration curve by fitting the average response of four sensors to a Hill-Langmuir isotherm using data collected at 37 °C in freshly-collected rat blood. We derive KDM values by subtracting the normalized peak heights collected at 300 Hz from those collected at 25 Hz, and dividing by their average. We indicate the clinical range of vancomycin in grey. Specifically, the clinical window of vancomycin ranges from 6 to 42 µM, which reflects the minimum target concentrations to achieve clinical effect, to the mean maximum peak concentrations concentrations,. The error bars shown here and in the following figures reflect the standard deviation of replicate measurements performed using independent sensors (K1/2 = 73 ± 4 µM, n = 4). The error reported for these and all other K1/2 values reflect 95% confidence intervals. (B) We then apply this calibration curve to quantify measurements performed using the same four sensors in 37 °C fresh rat blood to which 10, 20, 50, 100, or 300 µM vancomycin has been added (dotted lines, red lines). We indicate the clinical range of vancomycin in grey. (C) From these measurements, we calculate mean estimated concentration, standard deviation, mean accuracy (defined as 100*(expected – observed)/observed), and coefficient of variation (100*population standard deviation/population mean). We observe better than 10% accuracy for all challenges.
Figure 3
Figure 3
Calibrating sensors using out-of-set data, or calibrating individual sensors to their respective calibration curve does not greatly change sensor accuracy in vancomycin’s clinical range (highlighted in grey). (A) To calibrate sensors “out-of-set,” for each sensor, we calibrate using a calibration curve formed from the other three sensors. (B) To “individually” calibrate the sensors, we use the calibration curve collected for a specific sensor to quantify its own resulting dose–response curve.
Figure 4
Figure 4
EAB signaling changes significantly between room and body temperature. (A) For example, calibration curves measured in freshly collected rat blood at 21 °C (black, n = 4 sensors, K1/2 = 13 ± 2 µM) and 37 °C (blue, n = 4 sensors, K1/2 = 73 ± 4 µM) differ in their binding midpoint, Hill coefficient, and signal gain (Table S3). (B) This occurs at least in part because the electron transfer rate from the redox reporter changes with temperature. Specifically, the peak charge transfer rate shifts toward higher frequencies at higher temperatures. To illustrate this, we plot here charge transfer versus frequency for a representative sensor in absence of target. We do so by determining square wave voltammogram peak current, and dividing it by its given interrogation frequency (additional sensor curves shown in Figure S1).
Figure 5
Figure 5
(A) Titrations performed in fresh rat blood and commercially sourced, one-day-old bovine blood produce distinct calibration curves. (B) To determine whether this is driven by species-specific differences in blood, or the greater age of the commercially sourced bovine blood, we compared calibration curves obtained in a bovine blood sample 1 day (red, K1/2 = 116 ± 15 µM) and 14 days (black, K1/2 = 112 ± 9 µM) after it was collected. Doing so, we find that the KDM response does not change significantly in the clinical range. (C, D) Examining the signal at the two square-wave frequencies used to perform KDM (here, 25 Hz and 300 Hz) we see that, for the 14-day-old blood, there is a notable signal decrease at vancomycin concentrations far below the aptamer’s dissociation constant. Given that no target-induced response should occur at these low concentrations, we believe this is an artifact due to time-dependent sensor degradation in the older blood.
Figure 6
Figure 6
Here, we investigate whether simpler media can reproduce the response seen in freshly-collected rat blood. To do so, we compare titrations (KDM values derived from 25 and 300 Hz) collected in 37 °C freshly collected rat blood to (A) 37 °C Ringer’s buffer with 35 mg/mL bovine serum albumin (BSA), (B) 37 °C phosphate buffered saline (PBS) with 2 mM MgCl2, and (C) 37 °C PBS with 2 mM MgCl2 and 35 mg/mL bovine serum albumin. From these data we observe that calibration in 37˚C PBS with added BSA is a reasonable proxy for fresh rat blood. Of note, the close correspondence between the sensor’s response in simple buffers and in whole blood indicate that the sensor does not respond significantly to the components naturally present in blood.

References

    1. White RJ, Phares N, Lubin AA, Xiao Y, Plaxco KW. Optimization of electrochemical aptamer-based sensors via optimization of probe packing density and surface chemistry. Langmuir. 2008;24:10513–10518. doi: 10.1021/la800801v. - DOI - PMC - PubMed
    1. Idili A, et al. Seconds-resolved pharmacokinetic measurements of the chemotherapeutic irinotecan in situ in the living body. Chem. Sci. 2019;10:8164–8170. doi: 10.1039/C9SC01495K. - DOI - PMC - PubMed
    1. Idili A, Gerson J, Kippin T, Plaxco KW. Seconds-resolved, in situ measurements of plasma phenylalanine disposition kinetics in living rats. Anal. Chem. 2021;93:4023–4032. doi: 10.1021/acs.analchem.0c05024. - DOI - PMC - PubMed
    1. Li H, et al. A Biomimetic phosphatidylcholine-terminated monolayer greatly improves the in vivo performance of electrochemical aptamer-based sensors. Angew. Chem. 2017;56:7492–7495. doi: 10.1002/anie.201700748. - DOI - PMC - PubMed
    1. Arroyo-Currás N, et al. Subsecond-resolved molecular measurements in the living body using chronoamperometrically interrogated aptamer-based sensors. ACS Sensors. 2018;3:360–366. doi: 10.1021/acssensors.7b00787. - DOI - PubMed

Publication types