. 2022 Apr 1;8(1):35.
doi: 10.1038/s41531-022-00288-w.

Multi-modality machine learning predicting Parkinson's disease

Affiliations

Multi-modality machine learning predicting Parkinson's disease

Mary B Makarious et al. NPJ Parkinsons Dis. .

Abstract

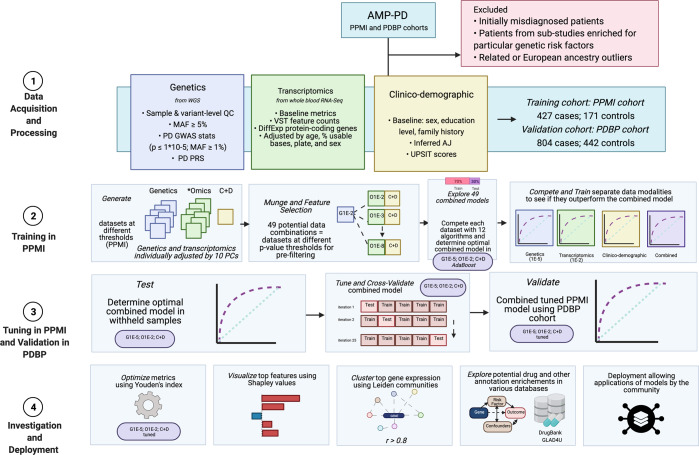
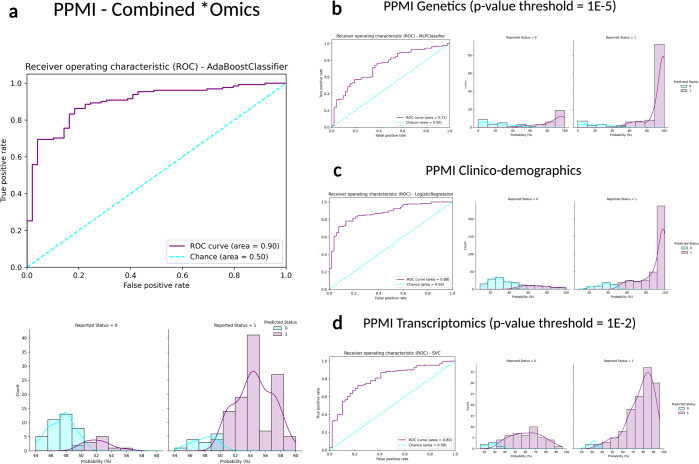
Personalized medicine promises individualized disease prediction and treatment. The convergence of machine learning (ML) and available multimodal data is key moving forward. We build upon previous work to deliver multimodal predictions of Parkinson's disease (PD) risk and systematically develop a model using GenoML, an automated ML package, to make improved multi-omic predictions of PD, validated in an external cohort. We investigated top features, constructed hypothesis-free disease-relevant networks, and investigated drug-gene interactions. We performed automated ML on multimodal data from the Parkinson's progression marker initiative (PPMI). After selecting the best performing algorithm, all PPMI data was used to tune the selected model. The model was validated in the Parkinson's Disease Biomarker Program (PDBP) dataset. Our initial model showed an area under the curve (AUC) of 89.72% for the diagnosis of PD. The tuned model was then tested for validation on external data (PDBP, AUC 85.03%). Optimizing thresholds for classification increased the diagnosis prediction accuracy and other metrics. Finally, networks were built to identify gene communities specific to PD. Combining data modalities outperforms the single biomarker paradigm. UPSIT and PRS contributed most to the predictive power of the model, but the accuracy of these are supplemented by many smaller effect transcripts and risk SNPs. Our model is best suited to identifying large groups of individuals to monitor within a health registry or biobank to prioritize for further testing. This approach allows complex predictive models to be reproducible and accessible to the community, with the package, code, and results publicly available.


Conflict of interest statement

H.L.L., H.I., F.F., D.V., Y.S., and M.A.N. declare that they are consultants employed by Data Tecnica International, whose participation in this is part of a consulting agreement between the US National Institutes of Health and said company. H.R.M. is employed by UCL. In the last 24 months, he reports paid consultancy from Biogen, Biohaven, Lundbeck; lecture fees/honoraria from Wellcome Trust, Movement Disorders Society. Research Grants from Parkinson’s UK, Cure Parkinson’s Trust, PSP Association, CBD Solutions, Drake Foundation, Medical Research Council, Michael J Fox Foundation. H.R.M. is also a co-applicant on a patent application related to C9ORF72—Method for diagnosing a neurodegenerative disease (PCT/GB2012/052140). The study’s funders had no role in the study design, data collection, data analysis, data interpretation, or writing of the report. Authors M.B.M., A.D., I.V., E.H., D.S., S.B.C., J.J.K., M.B., W.N., R.H.C., S.H.H., J.A.B., J.F.C., M.M., D.W.C., K.V.K.-J, J.A.H., C.B., and A.B.S. declare no competing interests. All authors and the public can access all data and statistical programming code used in this project for the analyses and results generation. M.A.N. takes final responsibility for the decision to submit the paper for publication.

Figures

Fig. 1
Fig. 1. Workflow and Data Summary.
Scientific notation in the workflow diagram denotes minimum p values from reference GWAS or differential expression studies as a pre-screen for feature inclusion. Blue indicates subsets of genetics data (also denoted as “G”), green indicates subsets of transcriptomics data (also denoted as *omics or “O”), yellow indicates clinico-demographic data (also denoted as C + D), and purple indicates combined data modalities. PD Parkinson’s disease, AMP-PD accelerating medicines partnership in Parkinson’s disease, PPMI Parkinson’s progression marker initiative, PDBP Parkinson’s disease biomarker program, WGS whole-genome sequencing, GWAS genome-wide association study, QC quality control, MAF minor allele frequency, PRS polygenic risk score.
Fig. 2
Fig. 2. Receiver operating characteristic curves and case probability density plots in withheld training samples at default thresholds comparing performance metrics in different data modalities from the PPMI dataset.
P values mentioned indicate the threshold of significance used per datatype, except for the inclusion of all clinico-demographic features. a PPMI combined *omics dataset (genetics p value threshold = 1E-5, transcriptomics p value threshold = 1E-2, and clinico-demographic information); b PPMI genetics-only dataset (p value threshold = 1E-5); c PPMI clinico-demographics only dataset; d PPMI transcriptomics-only dataset (p value threshold = 1E-2). Note that x-axis limits may vary as some models produce less extreme probability distributions than others inherently based on fit to the input data and the algorithm used, further detailed images are included in Supplementary Fig. 5. PPMI Parkinson’s progression marker initiative, ROC receiver operating characteristic curve.
Fig. 3
Fig. 3. Receiver operating characteristic and case probability density plots in the external dataset (PDBP) at validation for the trained and then tuned models at default thresholds.
Probabilities are predicted case status (r1), so controls (status of 0) skews towards more samples on the left, and positive PD cases (status of 1) skews more samples on the right. a Testing in PDBP the combined *omics model (genetics p value threshold = 1E-5, transcriptomics p value threshold = 1E-2, and clinico-demographic information) developed in PPMI prior to tuning the hyperparameters of the model; b Testing in PDBP the combined *omics model (genetics p value threshold = 1E-5, transcriptomics p value threshold = 1E-2, and clinico-demographic information) developed in PPMI after tuning the hyperparameters of the model. PPMI Parkinson’s progression marker initiative, PDBP Parkinson’s disease biomarker program, ROC receiver operating characteristic curve.
Fig. 4
Fig. 4. Feature importance plots for top 5% of features in data.
The plot on the left has lower values indicated by the color blue, while higher values are indicated in red compared to the baseline risk estimate. Plot on the right indicates directionality, with features predicting for cases indicated in red, while features better-predicting controls are indicated in blue. SHAP Shapley values, UPSIT University of Pennsylvania smell identification test, PRS polygenic risk score.

References

    1. Nalls MA, et al. Diagnosis of Parkinson’s disease on the basis of clinical and genetic classification: a population-based modelling study. Lancet Neurol. 2015;14:1002–1009. - PMC - PubMed
    1. Green ED, et al. Strategic vision for improving human health at The Forefront of Genomics. Nature. 2020;586:683–692. - PMC - PubMed
    1. Sudlow C, et al. UK biobank: an open access resource for identifying the causes of a wide range of complex diseases of middle and old age. PLoS Med. 2015;12:e1001779. - PMC - PubMed
    1. Rizzo G, et al. Accuracy of clinical diagnosis of Parkinson disease: a systematic review and meta-analysis. Neurology. 2016;86:566–576. - PubMed
    1. Lake J, Storm CS, Makarious MB, Bandres-Ciga S. Genetic and transcriptomic biomarkers in neurodegenerative diseases: current situation and the road ahead. Cells. 2021;10:1030. - PMC - PubMed