. 2022 Apr 1;8(1):15.
doi: 10.1038/s41522-022-00276-1.

Dietary fat promotes antibiotic-induced Clostridioides difficile mortality in mice

Affiliations

Dietary fat promotes antibiotic-induced Clostridioides difficile mortality in mice

Keith Z Hazleton et al. NPJ Biofilms Microbiomes. .

Abstract

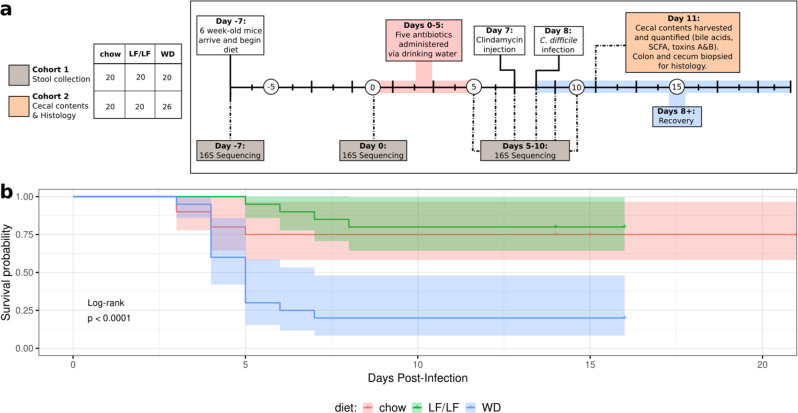
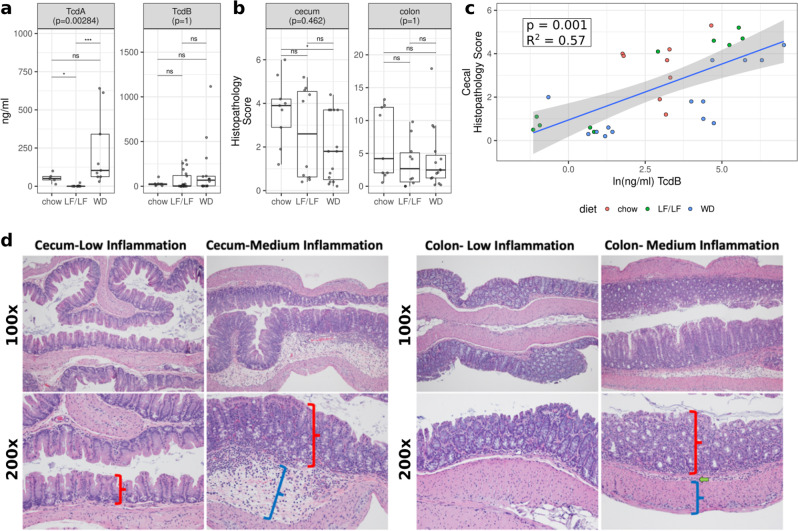
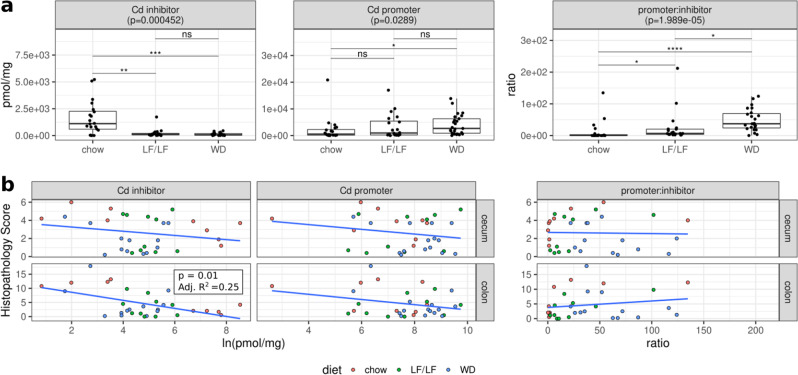
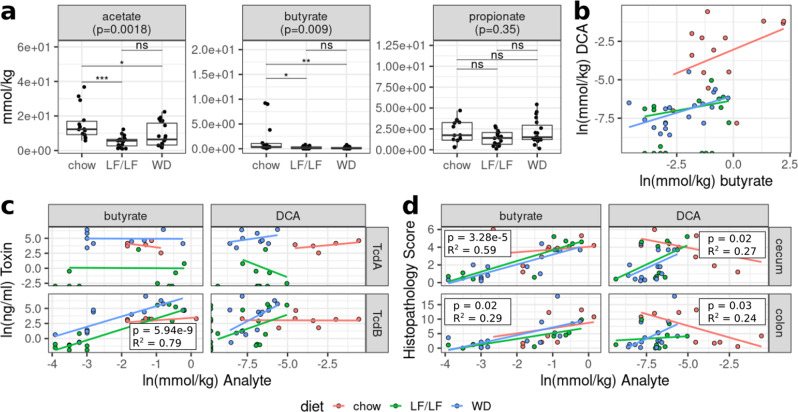
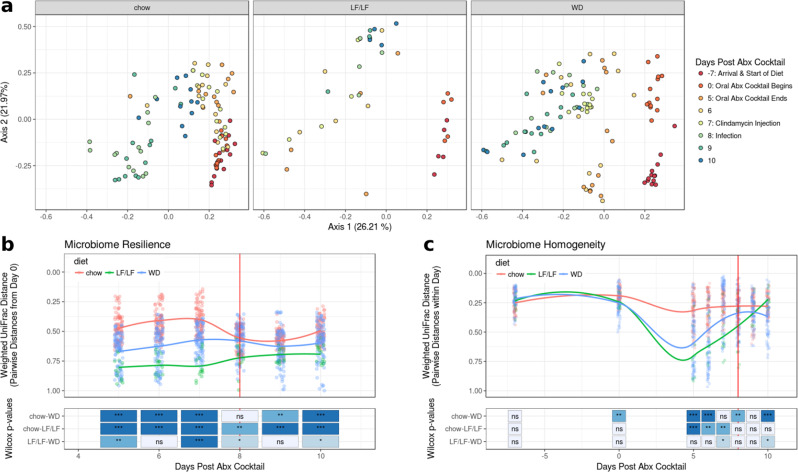
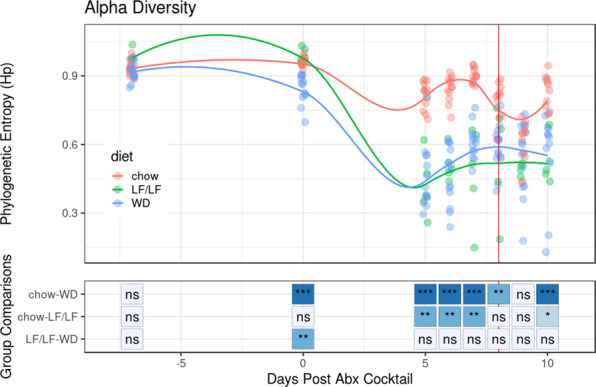
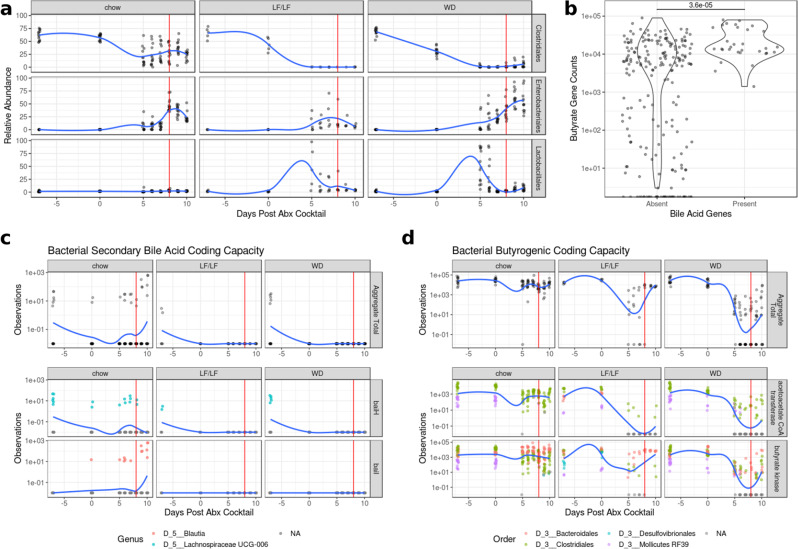
Clostridioides difficile infection (CDI) is the leading cause of hospital-acquired diarrhea, and emerging evidence has linked dietary components with CDI pathogenesis, suggesting that dietary modulation may be an effective strategy for prevention. Here, we show that mice fed a high-fat/low-fiber "Western-type" diet (WD) had dramatically increased mortality in a murine model of antibiotic-induced CDI compared to a low-fat/low-fiber (LF/LF) diet and standard mouse chow controls. We found that the WD had a pro- C. difficile bile acid composition that was driven in part by higher levels of primary bile acids that are produced to digest fat, and a lower level of secondary bile acids that are produced by the gut microbiome. This lack of secondary bile acids was associated with a greater disturbance to the gut microbiome with antibiotics in both the WD and LF/LF diet compared to mouse chow. Mice fed the WD also had the highest level of toxin TcdA just prior to the onset of mortality, but not of TcdB or increased inflammation. These findings indicate that dietary intervention to decrease fat may complement previously proposed dietary intervention strategies to prevent CDI in high-risk individuals.


Conflict of interest statement

The authors declare no competing interests.

Figures

Fig. 1
Fig. 1. Experimental design of the murine model of antibiotic-induced CDI and survival curves.
a C. difficile challenge experimental design. The figure legend at the left panel indicates the samples sizes for 2 cohorts; more information on batching and n’s per assay is given in Supplementary Table 2. Cohort 1 was followed for 13 days post C. difficile gavage to monitor survival and gut microbiome composition over time. Cohort 2 was sacrificed at 3 days post C. difficile gavage to collect cecal contents for measurement of metabolites and toxin and colon and cecal mucosa for histopathology (some assays were only conducted on a subset of Cohort 2, but all in at least two independent experiments; see Supplementary Table 2 for details). Gray and orange boxes indicate the time points at which samples were collected for the respective cohorts. b Survival curves on the three diets. Statistical significance as assessed by log-rank comparison is indicated.
Fig. 2
Fig. 2. Toxin and histopathology scores by diet.
a TcdA and TcdB production across diets as determined by ELISA. b Histologic inflammation scores across diets as determined by a blinded histologist. Significant differences were calculated with a Kruskal–Wallis and Dunn’s post hoc test. Kruskal–Wallis p-values were corrected for multiple comparisons with the FDR algorithm of Benjamini and Hochberg. Also, see Supplementary Fig. 2 for statistical analysis with linear modeling that controlled for batch. Median and Interquartile Range (IQR) indicated. (*p< 0.05, **p < 0.01, ***p < 0.001, ****p< 0.0001). c Linear regression of cecal histopathology against C. difficile TcdB burden. (p = 0.001 with model cecum_infl ~TcdB and FDR correction). d Example sections of cecal (left) and colon (right) tissues with low or medium inflammation. No samples had levels of inflammation considered to be high. The cecum was scored for injury according to the system of Barthel et al. 2003. Scoring of inflammation using the Barthel scoring system is restricted to neutrophils in the mucosa portion of the cecum. In low cecal inflammation, no neutrophils are observed in the mucosa (red bracket) while they are observed with medium inflammation. Medium cecal inflammation also displayed submucosal edema (blue bracket) that is thought to occur at least to some degree due to the neutrophils present in the submucosa. The colon (right panels) was scored for injury according to the system of Dieleman et al. 1998. This system takes into account the relative quantity of inflammatory cells as well as whether they are found only in the mucosa layer (red bracket), are also in the submucosa (green arrow), or are found all the way through the muscularis (blue bracket) and into the peritoneal cavity.
Fig. 3
Fig. 3. Bile acid pools in cecal contents of infected mice 3 days post C. difficile infection.
a Cecal levels of C. difficile inhibitors (CDCA, UDCA, a_MCA, b_MCA, LCA, DCA), C. difficile promoters (TCA, CA), DCA, and ratios of promoters:inhibitors across diets (chow n;= 20, LF n = 20, WD n = 26; Supplementary Table 2). Significant differences calculated with a Kruskal–Wallis and Dunn’s post hoc test. Kruskal–Wallis p-values were corrected for multiple comparisons with the FDR algorithm of Benjamini and Hochberg. Median and IQR indicated. (*p < 0.05, **p < 0.01, ***p < 0.001, ****p < 0.0001). b Linear regressions of cecal or colonic histology against CD inhibitors, CD promoters, and the promoter:inhibitor ratios. Only colon inflammation versus C. difficile inhibitors was significant.
Fig. 4
Fig. 4. Relationships between microbial metabolites (SCFAs and the secondary bile acid DCA) and diet, toxin, and inflammation.
a Cecal levels of the SCFAs acetate, butyrate, and propionate. p-values were determined using a Kruskal–Wallis with Dunn’s post hoc test. Median and IQR indicated. (*p < 0.05, **p < 0.01, ***p <0.001). b Multiple linear regression of DCA levels as a function of butyrate and diet. Model = ln(DCA) ~ln(butyrate) + diet + ln(butyrate)*diet. R-squared 0.855 p < 0.0001. c Multiple linear regressions of C. difficile toxin TcdA and TcdB concentrations against butyrate and DCA while controlling for dietary interactions. d Multiple linear regressions of cecal or colonic histology against butyrate and DCA while controlling for dietary interactions.
Fig. 5
Fig. 5. Beta diversity plots of the fecal microbiome by diet during antibiotic treatment and infection with C. difficile.
Vertical red lines in b and c designate the day of C. difficile infection (chow n = 13, LF n = 5, WD n = 13). a Weighted UniFrac PCoA plots of all samples with each diet highlighted in separate panels. b Resilience of microbiome composition assessed by within-mouse pairwise weighted UniFrac distances between day 0 (7 days post diet switch and prior to oral antibiotics) and later time points and c Longitudinal plot of microbiome turnover homogeneity as plotted by intra-time point pairwise Weighted UniFrac distances within diet groups. Significant differences between diet groups were calculated by Kruskal–Wallis followed by Dunn’s post hoc test. Trend lines were fit using local polynomial regression. ***p < 0.001. **p < 0.01, *p < 0.05 ns non-significant.
Fig. 6
Fig. 6. Alpha-diversity (phylogenetic entropy) of the fecal microbiome during murine CDI model.
Data for each individual mouse is plotted as well as the fitted local polynomial regression for each diet group. Significant differences between diet groups were calculated by Kruskal–Wallis followed by Dunn’s post hoc test. *p < 0.05, **p < 0.01, ***p < 0.001.
Fig. 7
Fig. 7. Changes in key taxa, and secondary bile acid and butyrate coding capacity during the CDI protocol.
The vertical red line in a, c, and d indicate the day of C. difficile infection. All trend lines were fit using local polynomial regression. a Relative abundance of key bacterial orders during antibiotic treatment and infection. A summary of significant differences of these taxa across diets is in Supplementary Fig. 4. b Violin plots of abundance of butyrate genes from PICRUSt2 analysis binned by the presence of secondary bile acid-producing genes (Wilcoxon p < 0.001). c Time course of the coding capacity of secondary bile acid genes. The top row shows the total capacity of each sample (baiH and baiI) while the bottom two rows show specific taxa contributions of key genes in the Bai operon. d Time course of the coding capacity of butyrate-producing genes by diet. The top row shows the total capacity as measured by but and buk genes while the bottom two rows show specific taxa contributions of but and buk specifically. Taxa with mean relative abundance < 0.01% were filtered from the analysis.

References

    1. Lessa FC, et al. Burden of Clostridium difficile infection in the United States. N. Engl. J. Med. 2015;372:825–834. - PMC - PubMed
    1. Leffler DA, Lamont JT. Clostridium difficile infection. N. Engl. J. Med. 2015;372:1539–1548. - PubMed
    1. Ng J, et al. Clostridium difficile toxin-induced inflammation and intestinal injury are mediated by the inflammasome. Gastroenterology. 2010;139:542–552. - PubMed
    1. Battaglioli EJ, et al. Clostridioides difficile uses amino acids associated with gut microbial dysbiosis in a subset of patients with diarrhea. Sci. Transl. Med. 2018;10:eaam7019. - PMC - PubMed
    1. Lozupone CA, et al. Meta-analyses of studies of the human microbiota. Genome Res. 2013;23:1704–1714. - PMC - PubMed

Publication types

LinkOut - more resources