. 2022 Apr 1;12(1):5534.
doi: 10.1038/s41598-022-09564-4.

Analysis of individual-level data from 2018-2020 Ebola outbreak in Democratic Republic of the Congo

Affiliations

Analysis of individual-level data from 2018-2020 Ebola outbreak in Democratic Republic of the Congo

Harley Vossler et al. Sci Rep. .

Abstract

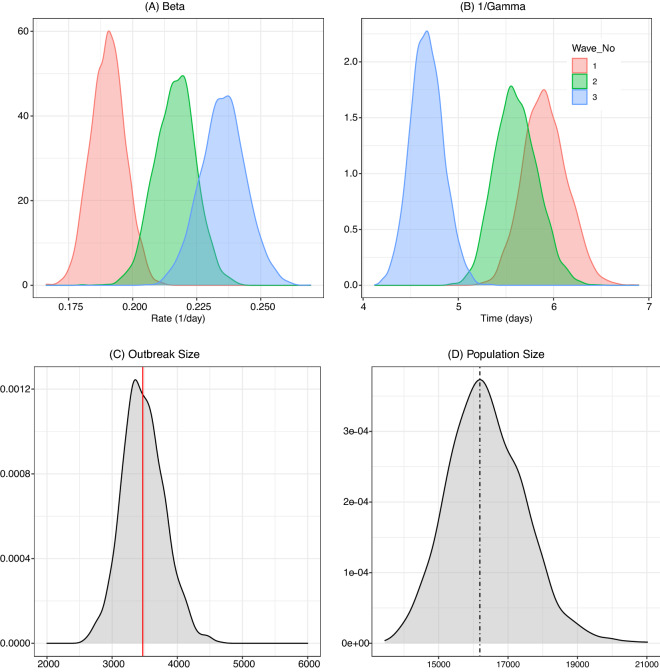
The 2018-2020 Ebola virus disease epidemic in Democratic Republic of the Congo (DRC) resulted in 3481 cases (probable and confirmed) and 2299 deaths. In this paper, we use a novel statistical method to analyze the individual-level incidence and hospitalization data on DRC Ebola victims. Our analysis suggests that an increase in the rate of quarantine and isolation that has shortened the infectiousness period by approximately one day during the epidemic's third and final wave was likely responsible for the eventual containment of the outbreak. The analysis further reveals that the total effective population size or the average number of individuals at risk for the disease exposure in three epidemic waves over the period of 24 months was around 16,000-a much smaller number than previously estimated and likely an evidence of at least partial protection of the population at risk through ring vaccination and contact tracing as well as adherence to strict quarantine and isolation policies.


Conflict of interest statement

The authors declare no competing interests.

Figures

Figure 1
Figure 1
DRC Ebola dataset. (A) The spatial distribution of 3481 EVD cases across the northern DRC health zones during Ebola 2018–2020 outbreak. (B) The flowchart of personal records available up to September 12, 2019 available for the current analysis. The total number of available individual disease records was 3080. Map created using open software R with geospatial data obtained from.
Figure 2
Figure 2
Daily incidence and removal rates. Daily incidence (grey bars) and removal counts (red dots) during DRC Ebola 2018–2020 outbreak between August 15, 2018 and September 12, 2020 along with their respective trendlines (loess smoothers). The blue trendline above the plot represents daily effective reproduction number Rt defined as the ratio of daily number of new infections to new removals. The vertical lines indicate cut-off dates for data collection in each wave as listed in Table 1.
Figure 3
Figure 3
Model fit. Comparison of the statistical model fit (red curve) with the observed daily incidence (onset) and removal relative counts for all 3 waves of the epidemic combined. The shaded region indicates the 95% credibility bounds based on the posterior distributions of the model parameters estimated separately for each wave with values summarized in Table 2.
Figure 4
Figure 4
Top panels: parameters in different waves. The posterior distributions of β and 1/γ parameters for each of the three epidemic waves. The large increase in the rate of infection between waves 1 and 2 is clearly visible in panel (A). In panel (B), the density of 1/γ represents the distribution of time from symptom onset to removal. Between wave 1 and wave 3 of the epidemic, the average time shortened from 6 to 4.6 days. Bottom panels: outbreak size and effective population size. (C) The posterior density of the outbreak size based on the statistical model and the actual number of observed EVD cases (vertical red line). (D) The posterior density of the effective population size for the epidemic. The vertical line corresponds to the empirical outbreak size (red line in panel (C)).

References

    1. Aruna A, Mbala P, Minikulu L, Mukadi D, Bulemfu D, Edidi F, Bulabula J, Tshapenda G, Nsio J, Kitenge R, et al. Ebola virus disease outbreak-Democratic Republic of the Congo, August 2018–November 2019. Morb. Mortal. Wkly Rep. 2019;68(50):1162. doi: 10.15585/mmwr.mm6850a3. - DOI - PMC - PubMed
    1. Kalenga OI, Moeti M, Sparrow A, Nguyen V-K, Lucey D, Ghebreyesus TA. The ongoing Ebola epidemic in the Democratic Republic of Congo, 2018–2019. N. Engl. J. Med. 2019;381(4):373–383. doi: 10.1056/NEJMsr1904253. - DOI - PubMed
    1. Spengler JR, Ervin ED, Towner JS, Rollin PE, Nichol ST. Perspectives on West Africa Ebola virus disease outbreak, 2013–2016. Emerg. Infect. Dis. 2016;22(6):956. doi: 10.3201/eid2206.160021. - DOI - PMC - PubMed
    1. Mutombo PBWB, Nappa FK, Zalagile PA, Ali MM, Kulimba DM, Kokolomami JHT. The experience of control measures for individuals affected by the ebola virus disease in the north-eastern region of the Democratic Republic of the Congo, 2019. Central Afri. J. Public Health. 2019;5(6):322.
    1. Ehrhardt SA, Zehner M, Krähling V, Cohen-Dvashi H, Kreer C, Elad N, Gruell H, Ercanoglu MS, Schommers P, Gieselmann L, et al. Polyclonal and convergent antibody response to Ebola virus vaccine rVSV-ZEBOV. Nat. Med. 2019;25(10):1589–1600. doi: 10.1038/s41591-019-0602-4. - DOI - PubMed

Publication types

MeSH terms