. 2022 Apr 1;5(1):301.
doi: 10.1038/s42003-022-03229-8.

A benzodiazepine activator locks Kv7.1 channels open by electro-mechanical uncoupling

Affiliations

A benzodiazepine activator locks Kv7.1 channels open by electro-mechanical uncoupling

Julian A Schreiber et al. Commun Biol. .

Abstract

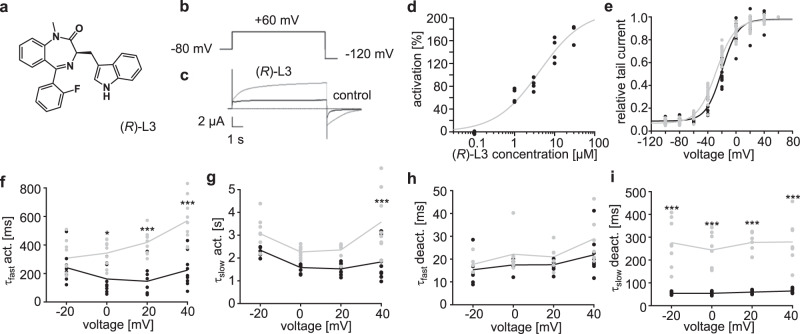
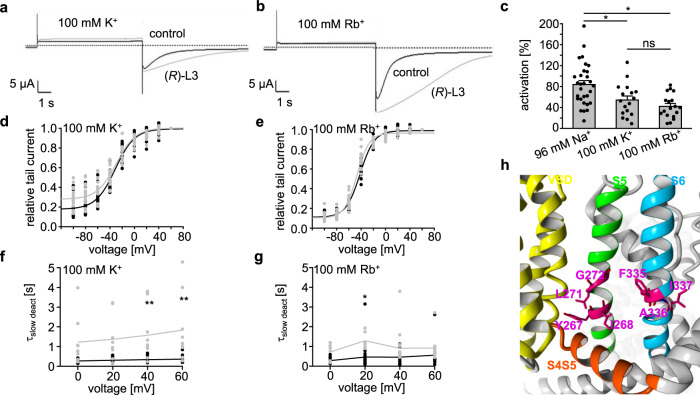
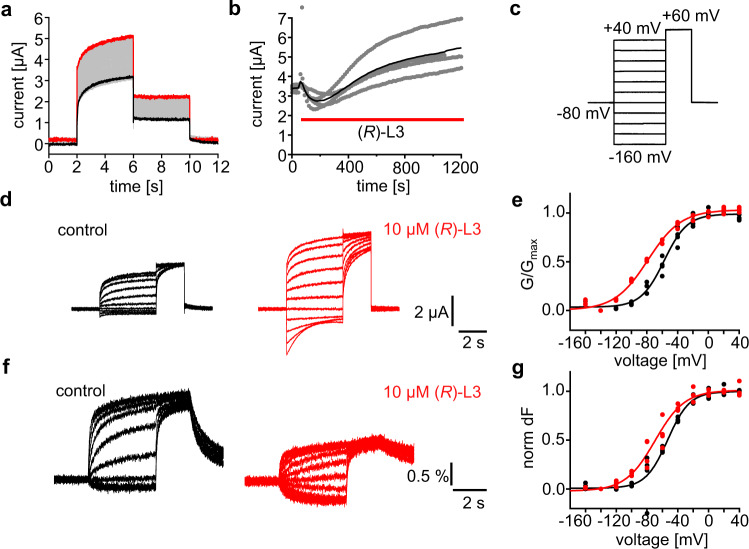
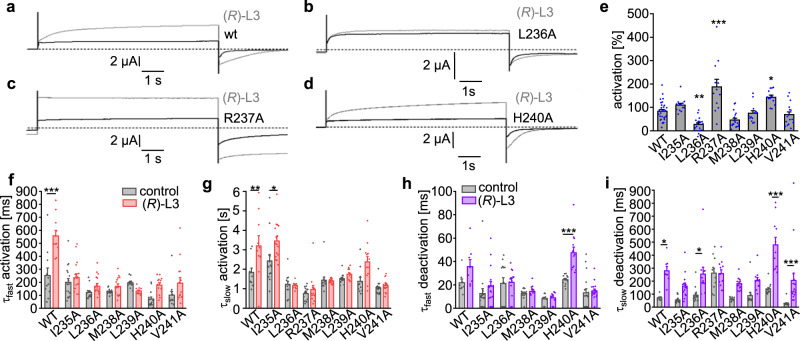
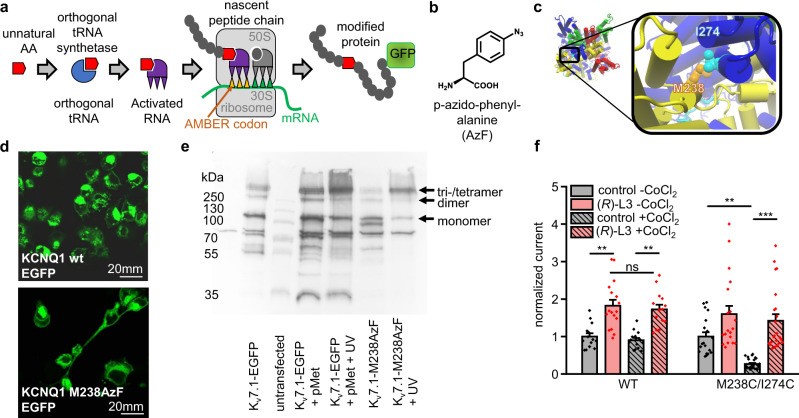
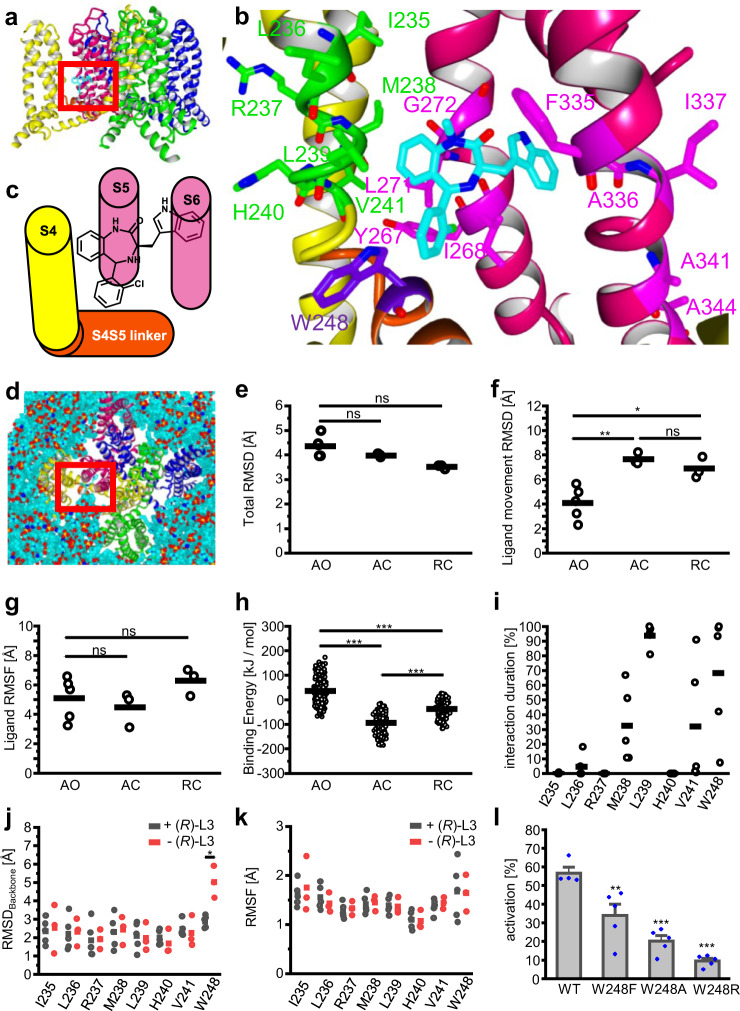
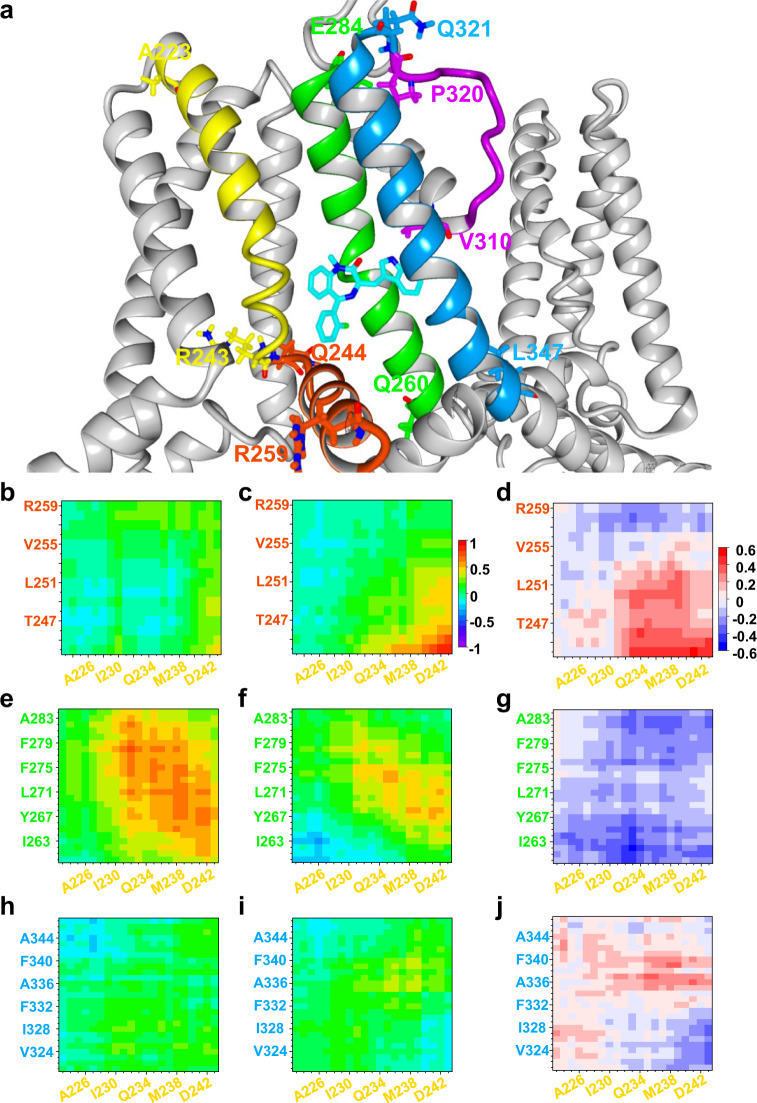
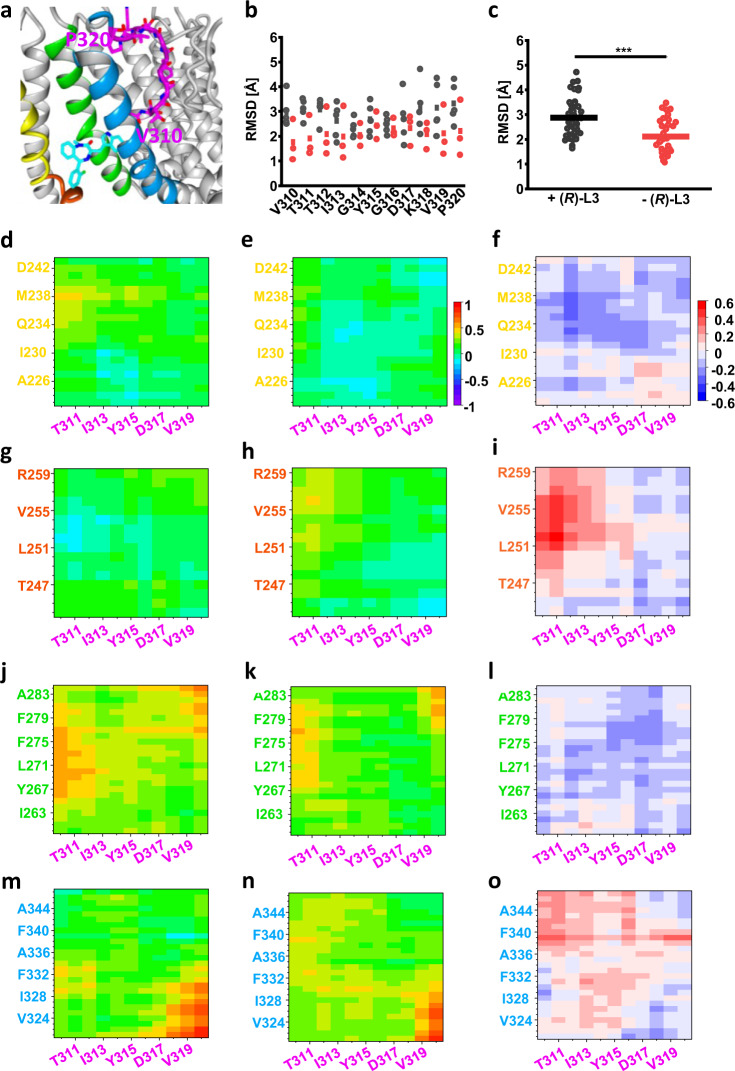
Loss-of-function mutations in Kv7.1 often lead to long QT syndrome (LQTS), a cardiac repolarization disorder associated with arrhythmia and subsequent sudden cardiac death. The discovery of agonistic IKs modulators may offer a new potential strategy in pharmacological treatment of this disorder. The benzodiazepine derivative (R)-L3 potently activates Kv7.1 channels and shortens action potential duration, thus may represent a starting point for drug development. However, the molecular mechanisms underlying modulation by (R)-L3 are still unknown. By combining alanine scanning mutagenesis, non-canonical amino acid incorporation, voltage-clamp electrophysiology and fluorometry, and in silico protein modelling, we show that (R)-L3 not only stimulates currents by allosteric modulation of the pore domain but also alters the kinetics independently from the pore domain effects. We identify novel (R)-L3-interacting key residues in the lower S4-segment of Kv7.1 and observed an uncoupling of the outer S4 segment with the inner S5, S6 and selectivity filter segments.


Conflict of interest statement

The authors declare the following competing interests: J.i.S. and J.C. are cofounders of a startup company VivoCor LLC, which is targeting IKs for the treatment of cardiac arrhythmia. Other authors declare they have no competing interests.

Figures

Fig. 1
Fig. 1. (R)-L3 activates and slows the rates of activation and deactivation of hKv7.1 channels expressed in Xenopus oocytes.
a Chemical structure of (R)-L3. b Pulse sequences for voltage-clamp experiments. c Effect of 1 µM (R)-L3 on hKv7.1 currents, recorded in an oocyte by a 7-s pulse to potentials of −100 mV to +60 mV from a holding potential of −80 mV. Currents were recorded in control solution containing 0.1% DMSO followed by perfusion with 1 μM (R)-L3 containing solution. d Dose–response curve for (R)-L3 from hKv7.1 expressing oocytes at +40 mV test voltage. Each concentration was applied to four independent oocytes (n = 20) e Voltage dependence of current activation in the absence (black; n = 13) and presence of (R)-L3 (gray; n = 15) determined from peak tail currents measured at −120 mV. Currents were normalized to the peak tail currents elicited after a pulse to +40 mV. fi Kinetics were evaluated in both absence (black; ctrl) and presence (gray; +(R)-L3) of 1 µM (R)-L3 and fitted by a two-component exponential function. Time constants are calculated for individual oocytes and given for fast (f; n = 9 for both conditions) and for slow (g; n = 9 for ctrl, n = 8 for + (R)-L3) component of Kv7.1 activation as well as for fast (h; n = 8 for ctrl, n = 6 for + (R)-L3) and for slow (i; n = 7 for ctrl, n = 8 for + (R)-L3)) component of Kv7.1 deactivation. Significance of mean differences was analyzed by one-way ANOVA and posthoc mean comparison Tukey test (*p < 0.05, ***p < 0.001).
Fig. 2
Fig. 2. Effect of (R)-L3 on hKv7.1 in high K+ and Rb+ buffer.
a, b Representative current traces in 100 mM K+ (a) and 100 mM Rb+ (b) before (black; ctrl) and after (gray; +(R)-L3) addition of 1 µM (R)-L3. c Activation of hKv7.1 channel currents by 1 µM (R)-L3 expressed as percent change in current in high K+ and Rb+ (n = 18 for K+, n = 17 for Rb+) compared to activation measured in ND96 (n = 30). Significance of mean differences was evaluated by one-way ANOVA and posthoc mean comparison Tukey test (ns for p > 0.05, *p < 0.05). d, e Current-voltage relationship for hKv7.1 expressing oocytes in the absence (black, n = 18 for K+ and Rb+) and presence (gray, n = 17 for K+, n = 18 for Rb+) of 1 µM (R)-L3 in 100 mM K+ (d) and 100 mM Rb+ (e). V1/2 values were determined from normalized peak tail currents at −120 mV for each oocyte and fitted to Boltzmann equation. f, g Slow deactivation component of hKv7.1 in high K+ (f) and high Rb+ (g) in the absence (black; n = 15 for K+, n = 18 for Rb+) and the presence (gray; n = 9 for K+ and n = 18 for Rb+) of (R)-L3. Time constants τslow deact were determined by two-component exponential fit for each oocyte and voltage step. h Depiction of KCNQ1 in activated state (AO, derived from Kuenze et al. Amino acids crucial for (R)-L3 activity (magenta) are located at the lower S5 (green) and S6 (blue) helix. Most side chains of the crucial amino acids are orientated to the S4S5 Linker (orange) and VSD (yellow) of an adjacent KCNQ1 subunit.
Fig. 3
Fig. 3. (R)-L3 potentiates Kv7.1VCF (C214A/G219C/C331A) currents and left shifts the voltage-dependence of G/Gmax and dF/F.
a Whole-cell currents from an oocyte expressing Kv7.1VCF labeled with Alexa 488 C5 maleimide. Every 15 s, the membrane voltage was pulsed from the −80 mV resting potential to +60 mV for 4 s, followed by 2 s tails at −40 mV. Currents before (black) and after (red) a bolus of (R)-L3 was added to the bath (final concentration ~10 μM). b Steady-state current at +60 mV versus time during application of (R)-L3 (indicated by red bar). Blackline represents the mean value, gray dots represent raw data from each measurement (n = 4). c Pulse protocol for simultaneous current and fluorescence recordings in (d-g). d Sample current trace from a single oocyte before (black) and after (red) exposure to ~10 μM (R)-L3. e G/Gmax voltage relationship of Kv7.1VCF expressing oocytes in the absence (black) and presence (red) of (R)-L3 (n = 4 for both conditions). f Sample fluorescence trace from an oocyte before (black) and after (red) exposure to ~10 μM (R)-L3. g dF/F voltage relationship of Kv7.1VCF expressing oocytes in the absence (black) and presence (red) of (R)-L3 (n = 4 for both conditions).
Fig. 4
Fig. 4. Sensitivity of S4 residues to (R)-L3 modulation.
ad Representative current traces of wildtype (a) and mutant channels L236A (b), R237A (c) and H240 (d). e Current amplitude activation of Kv7.1 channel mutants by 1 µM (R)-L3 expressed as percent change in current measured at the end of a 7-s pulse to +40 mV (n = 30 for WT, n = 13 for I235A, n = 18 for L236A, n = 12 for R237A, n = 18 for M238A, n = 13 for L239A, n = 12 for H240A, n = 16 for V241A). Significance of mean differences was evaluated by one-way ANOVA and posthoc mean comparison Tukey Test (*p < 0.05, **p < 0.01, ***p < 0.001). fi Effect of (R)-L3 on hKv7.1 channel mutant activation and deactivation rates. Kinetics were evaluated in both absence and presence of 1 µM (R)-L3 and fitted by two-component exponential function (number of independent oocytes for (fi) are given in SI Table 3).
Fig. 5
Fig. 5. Photo-crosslinking of the photo-activatable non-canonical amino acid AzF leads to formation of multimers.
a, b Using the amber suppression methodology for incorporation of non-canonical amino acids (ncAAs), we introduced the photo-activatable non-canonical amino acid AzF (b) at M238 position into mutant Kv7.1-EGFP-M238AMBER-Stop. HEK cells were co-transfected with cDNA encoding Kv7.1-EGFP-M238amber-Stop, suppressor tRNA and AzF-tRNA synthetase. Addition of the ncAA p-azido-phenylalanine (AzF) at 0.5 mM to the cell culture medium allowed for incorporation of the ncAA. c I274 interacts with M238 from the adjacent subunit in activated state in silico. d Successful incorporation and full-length protein expression was assayed by confocal EGFP imaging. e Kv7.1-EGFP-M238AzF expressing HEK cells were incubated in high K+ solutions (137 mM KCl) leading to channels preferentially in depolarized (calculated Vm of about −8.9 mV) states. UV irradiation caused formation of multimers under high K+ / preferentially depolarizing conditions consistent with the predicted interaction. f Normalized currents of hKv7.1 WT and hKv7.1 M238C/I274C expressing oocytes in the absence and presence of (R)-L3 and Co2+ ions (number of oocytes for each condition see SI Table 2).
Fig. 6
Fig. 6. Binding site localization and in silico simulation results.
a Depiction of tetrameric KCNQ1 AO model with subunits colored in magenta (Mol A), yellow (Mol B), green (Mol C) and blue (Mol D). Proposed binding site of (R)-L3 is marked by red square. b Close-up depiction of (R)-L3 (CPK-color coded with cyan for carbon) binding site with S4 (yellow) and S4S5 linker (orange) from subunit Mol B and S5 and S6 helix (magenta) from subunit Mol A. Previous analyzed amino acids from S5 and S6 with impact on (R)-L3 activity are colored in purple, while newly analyzed residues from S4 and S4S5 linker are colored in green or violet. c Schematic illustration of (R)-L3 binding site between S4 (yellow) and S4S5 linker (orange) from subunit Mol B and S5 and S6 (pink) from subunit Mol A. d Depiction of KCNQ1 AO model embedded in membrane for MD simulation. Subunits Mol A-D are colored like in 5A and (R)-L3 binding site is marked by red square. e Root mean square deviation (RMSD) of 30 ns MD simulations for complete modeled structures AO (n = 5 simulations), AC (n = 3) and RC (n = 3) with (R)-L3 for every simulation. Means are shown as bar and have no significant differences indicated by ns. f RMSD of Ligand movement of (R)-L3 from start to end of the 30 ns MD simulation of KCNQ states AO (n = 5), AC (n = 3) and RC (n = 3). g (R)-L3 Root mean square fluctuation (RMSF) for 30 ns MD simulation with KCNQ1 state models AO (n = 5), AC (n = 3) and RC (n = 3). Mean differences are not significant (ns; p > 0.05). h Binding Energy [kJ/mol] of (R)-L3 calculated for all simulation snapshots from 10 to 30 ns of MD simulations for KCNQ1 models AO (n = 405 snapshots), AC (n = 243) and RC (n = 243). i Percentage duration of hydrophobic interaction between (R)-L3 and mutated amino acids from S4 and S4S5 linker over total MD simulation time of 30 ns for AO simulations (n = 5). j, k Backbone RMSD and RMSF of mutated residues in the absence (n = 3 simulations)/presence (n = 5 simulations) of (R)-L3. l activity of 1 µM (R)-L3 at wildtype KCNQ1 expressing oocytes compared to mutations W248F, W248A, and W248R (n = 4 for WT, n = 5 for W248F, W248A, and W248R).
Fig. 7
Fig. 7. Dynamic cross-correlation matrices (DCCMs) for interactions between VSD (S4, S4S5 linker) and PD (S5, S6).
a (R)-L3 (CPK-color code with cyan for carbon) binding site between subunit Mol A and B with interacting secondary structures S4 (Mol B, yellow), S4S5 linker (Mol B, orange), S5 (Mol A, green), S6 (Mol A, blue) and selectivity filter (Mol A, purple). First and last amino acid of all secondary structures are shown in the same color. b, c Dynamic cross-correlation matrix (DCCM) for S4 (Mol B, yellow) and S4S5 linker (Mol B, orange) in the absence (b) and presence (c) of (R)-L3 from −1 (fully anticorrelated) over 0 (not correlated) to 1 (fully correlated). d Increase (positive values, red) and decrease (negative values, blue) of correlation between S4 and S4S5 linker residues depending on the presence of (R)-L3. e, f DCCM for S4 (Mol B, yellow) and S5 (Mol A, green) in the absence (e)/presence (f) of (R)-L3. g Increase (positive values, red) and decrease (negative values, blue) of correlation between S4 and S5 residues depending on the presence of (R)-L3. h, i DCCM for S4 (Mol B, yellow) and S6 (Mol A, blue) in the absence (h)/presence (i) of (R)-L3. j Increase (positive values, red) and decrease (negative values, blue) of correlation between S4 and S6 residues depending on the presence of (R)-L3. All data of Fig. 7 are derived from 5 independent simulations in the presence and 3 independent simulations in the absence of (R)-L3.
Fig. 8
Fig. 8. Dynamic cross-correlation matrices (DCCMs) for interactions between Pore helix and S4-S6.
a Close-up depiction of (R)-L3 binding site with S4 (yellow), S4S5 linker (orange), S5 (green), S6 (blue) and selectivity filter (purple) with all amino acids from V310 to P320. b, c RMSD of selectivity Filter residues V310 – P320 individually (b) and in total (c) in the absence (black) and presence (red) of (R)-L3. Means are given as squares (b) or bars (c). (d, e) Dynamic cross-correlation matrix (DCCM) for S4 (Mol B, yellow) and selectivity filter (Mol A, purple) in the absence (d) and presence (e) of (R)-L3 from −1 (fully anticorrelated) over 0 (not correlated) to 1 (fully correlated). f Increase (positive values, red) and decrease (negative values, blue) of correlation between S4 and selectivity filter residues depending on the presence of (R)-L3. g, h DCCM for S4S5 linker (Mol B, orange) and selectivity filter (Mol A, purple) in the absence (g)/presence (h) of (R)-L3. (i) Increase (positive values, red) and decrease (negative values, blue) of correlation between S4S5 linker and selectivity filter residues depending on the presence of (R)-L3. j, k DCCM for S5 (Mol A, green) and selectivity filter (Mol A, purple) in the absence (j)/presence (k) of (R)-L3. l Increase (positive values, red) and decrease (negative values, blue) of correlation between S5 and selectivity filter residues depending on the presence of (R)-L3. m, n DCCM for S6 (Mol A, blue) and selectivity filter (Mol A, purple) in the absence (m)/presence (n) of (R)-L3. o Increase (positive values, red) and decrease (negative values, blue) of correlation between S6 and selectivity filter residues depending on the presence of (R)-L3. All data of Fig. 8 are derived from 5 independent simulations in the presence and 3 independent simulations in the absence of (R)-L3.

References

    1. Jespersen T, Grunnet M, Olesen SP. The KCNQ1 potassium channel: From gene to physiological function. Physiology. 2005;20:408–416. - PubMed
    1. Wrobel, E., Tapken, D. & Seebohm, G. The KCNE tango—how KCNE1 interacts with Kv7.1. Front. Pharmacol.3, 142 (2012). - PMC - PubMed
    1. Abbott GW, Goldstein SA. A superfamily of small potassium channel subunits: form and function of the MinK-related peptides (MiRPs) Q Rev. Biophys. 1998;31:357–398. - PubMed
    1. McCrossan ZA, Abbott GW. The MinK-related peptides. Neuropharmacology. 2004;47:787–821. - PubMed
    1. Piccini M, et al. KCNE1-like gene is deleted in AMME contiguous gene syndrome: identification and characterization of the human and mouse homologs. Genomics. 1999;60:251–257. - PubMed

Publication types

Substances