. 2022 Apr;7(4):570-580.
doi: 10.1038/s41564-022-01088-x. Epub 2022 Apr 1.

Viruses affect picocyanobacterial abundance and biogeography in the North Pacific Ocean

Affiliations

Viruses affect picocyanobacterial abundance and biogeography in the North Pacific Ocean

Michael C G Carlson et al. Nat Microbiol. 2022 Apr.

Abstract

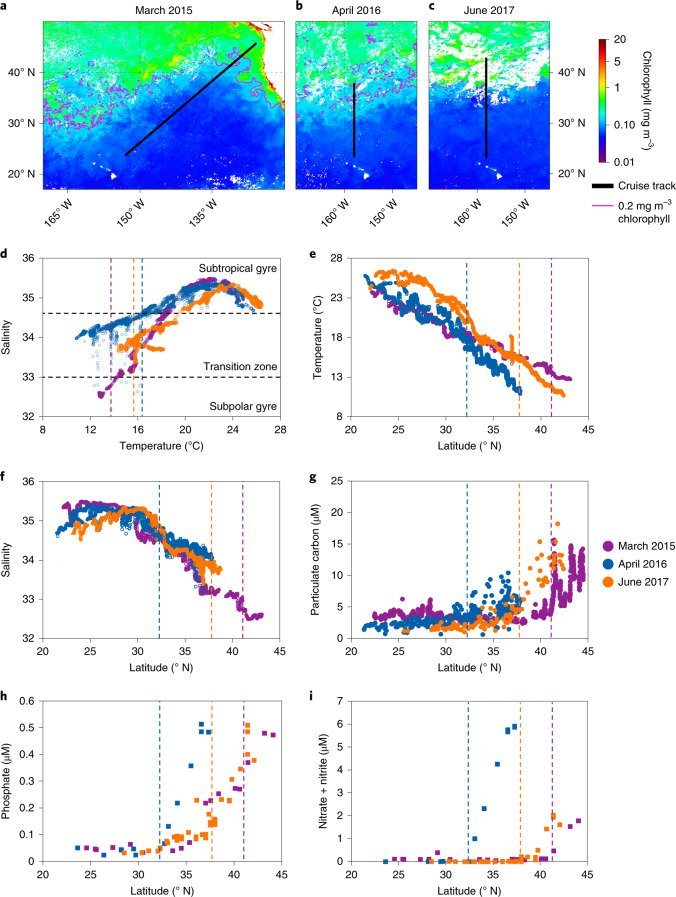
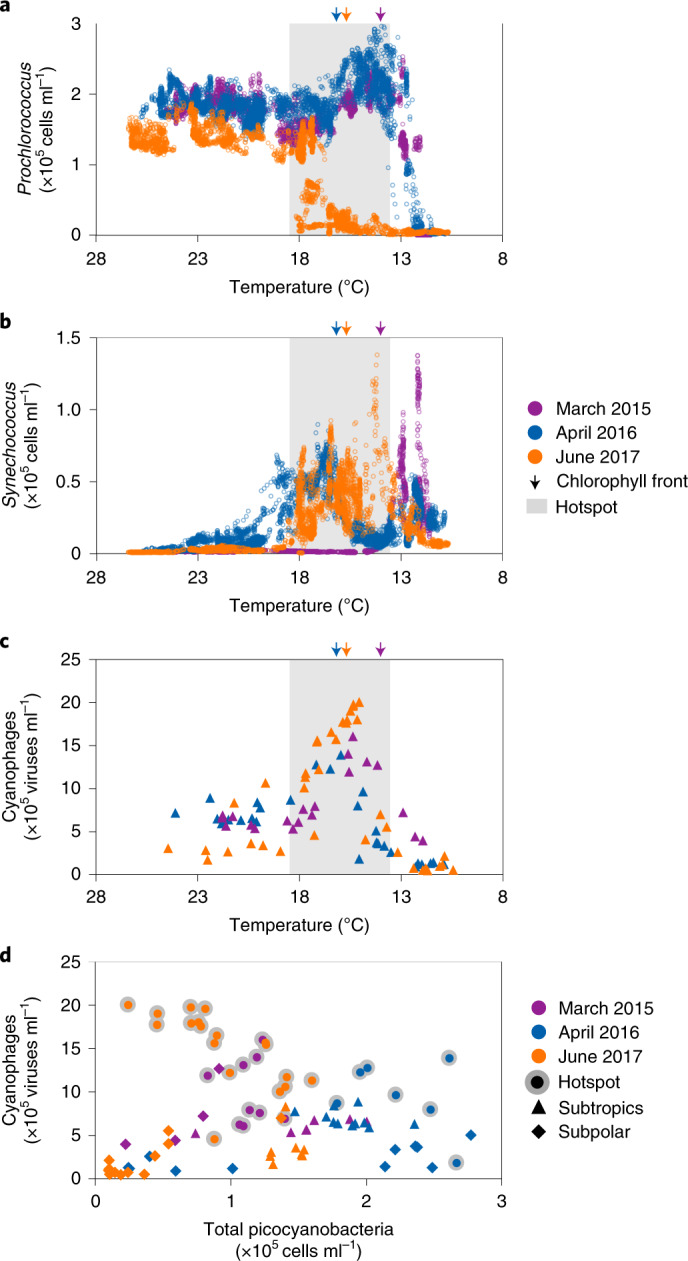
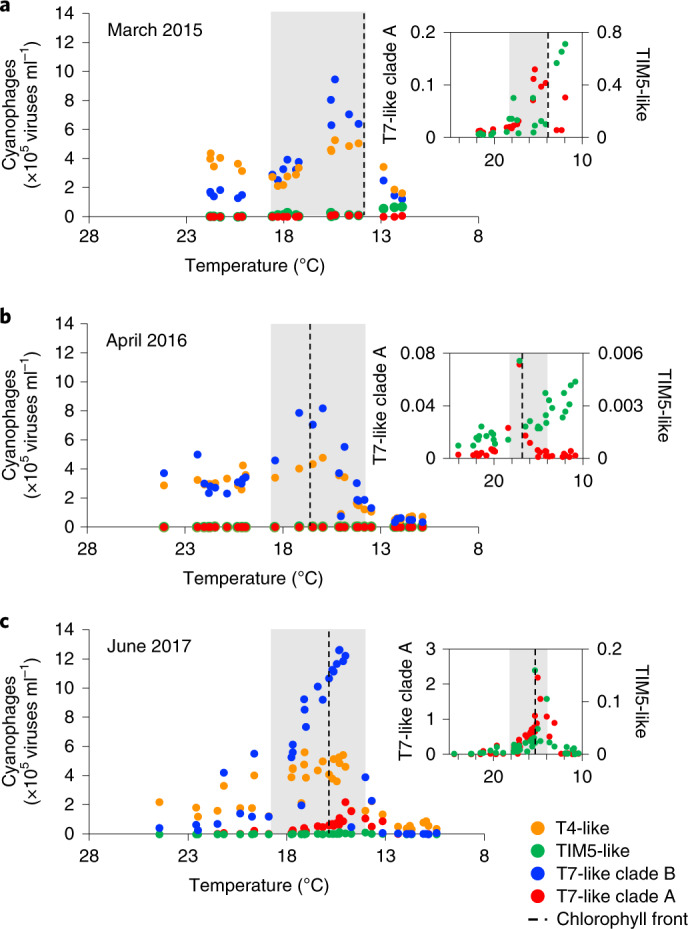
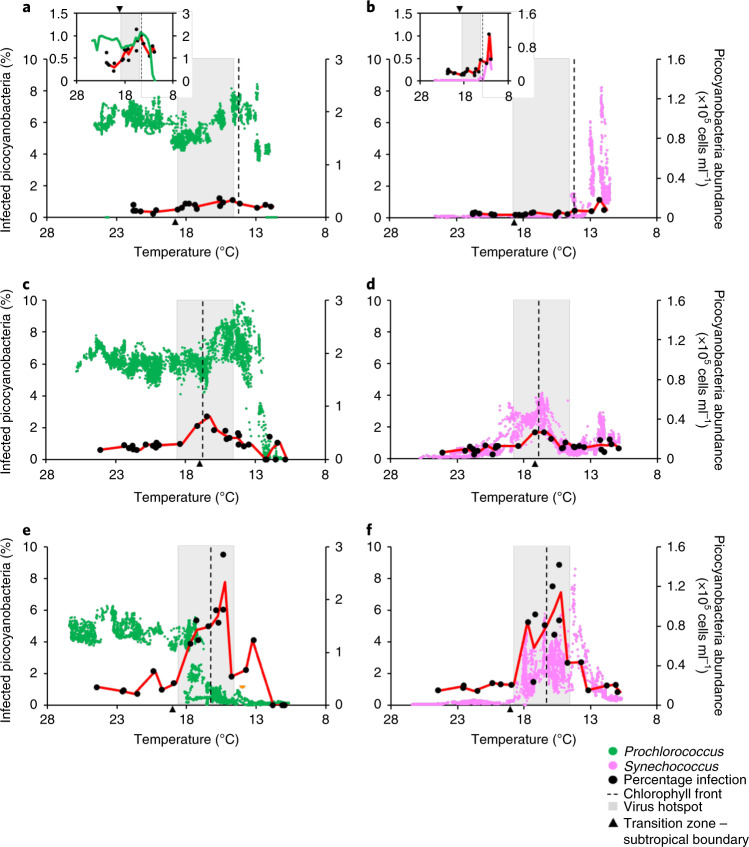
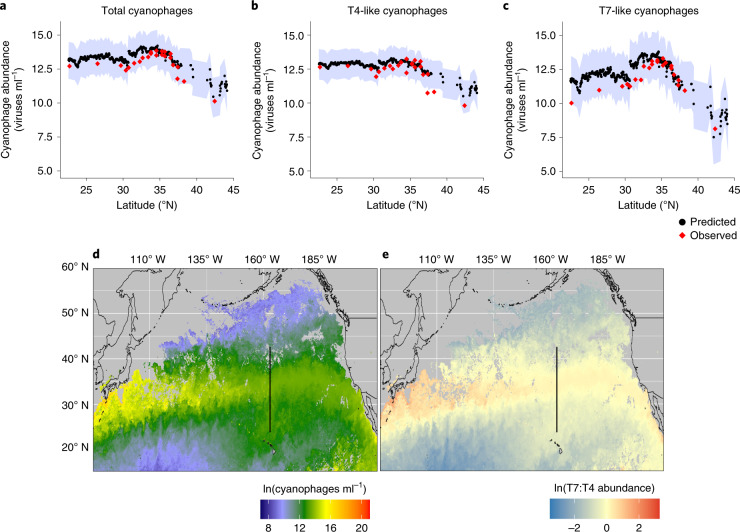
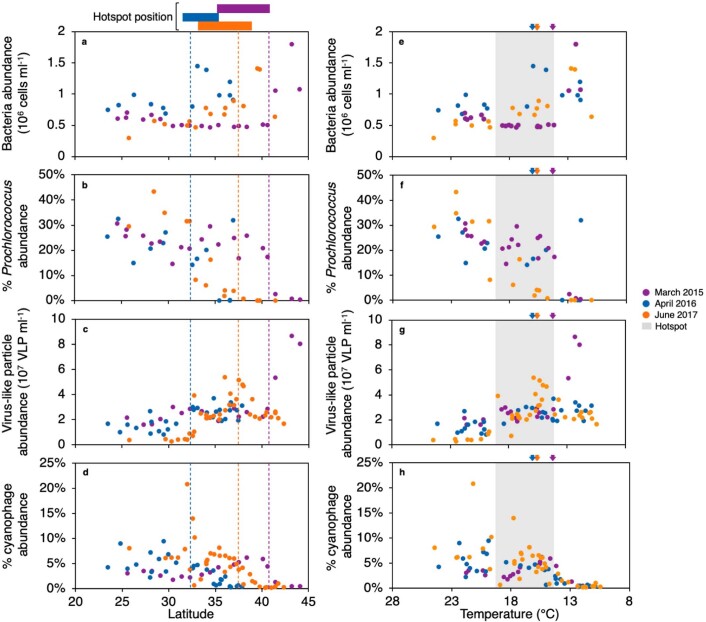
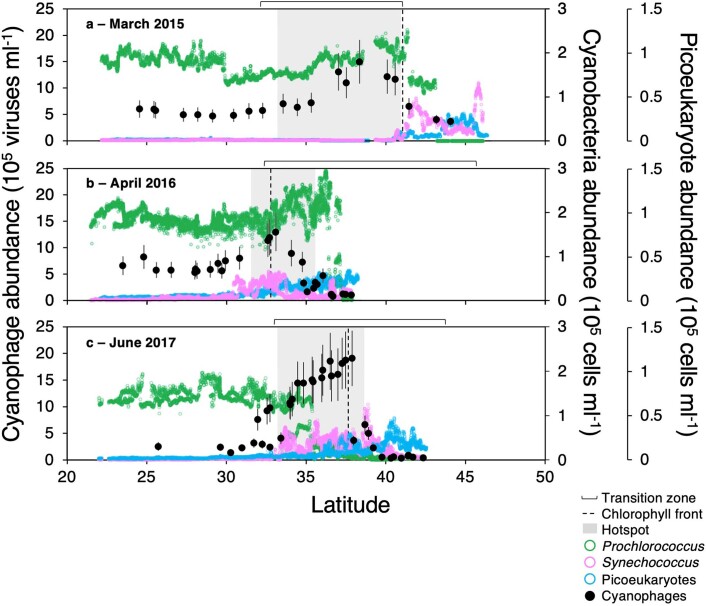
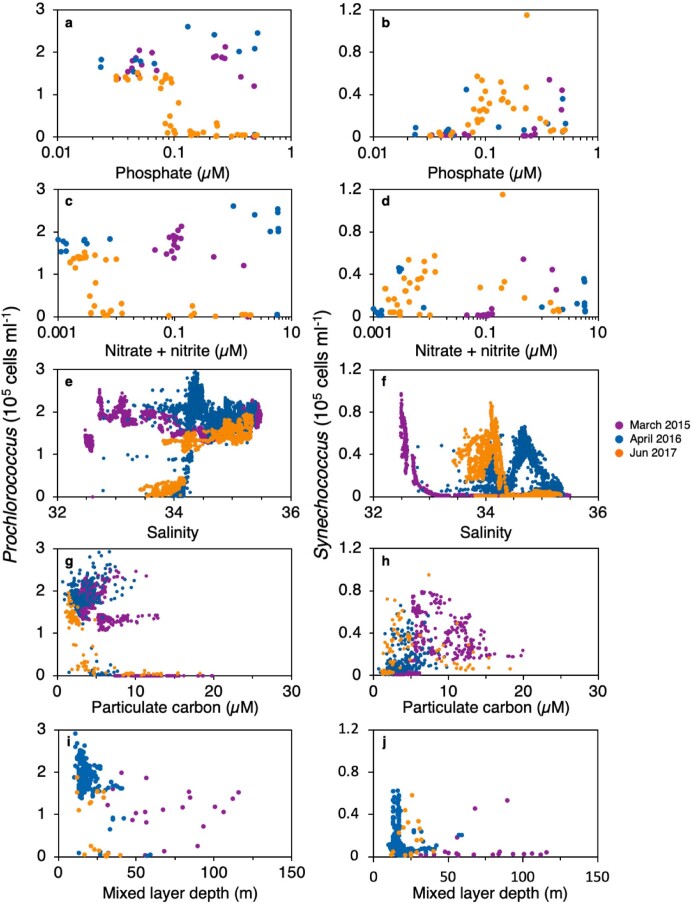
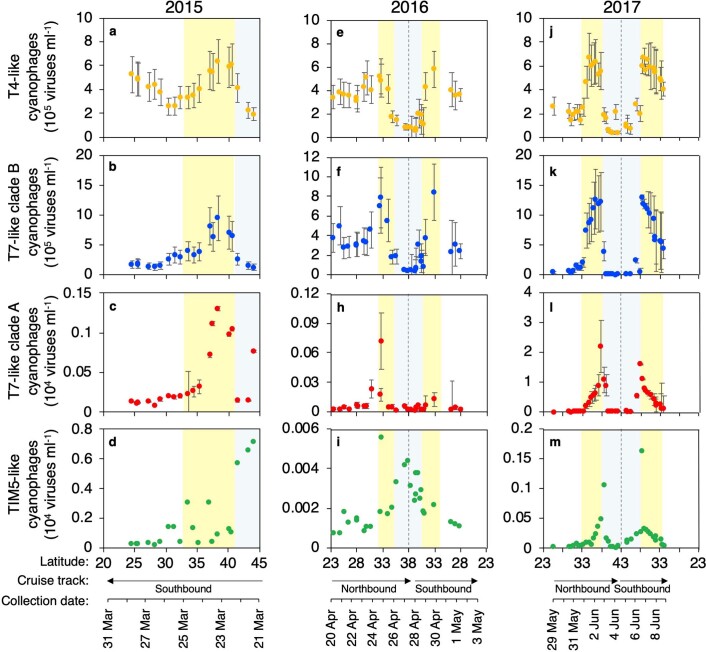
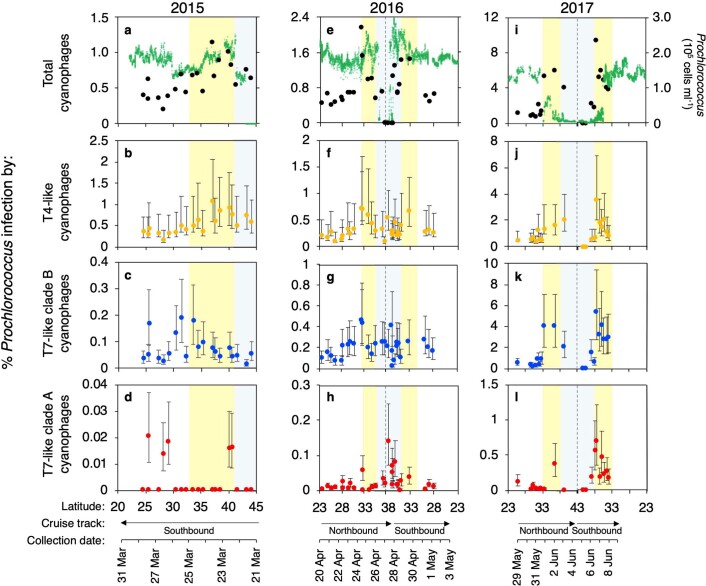
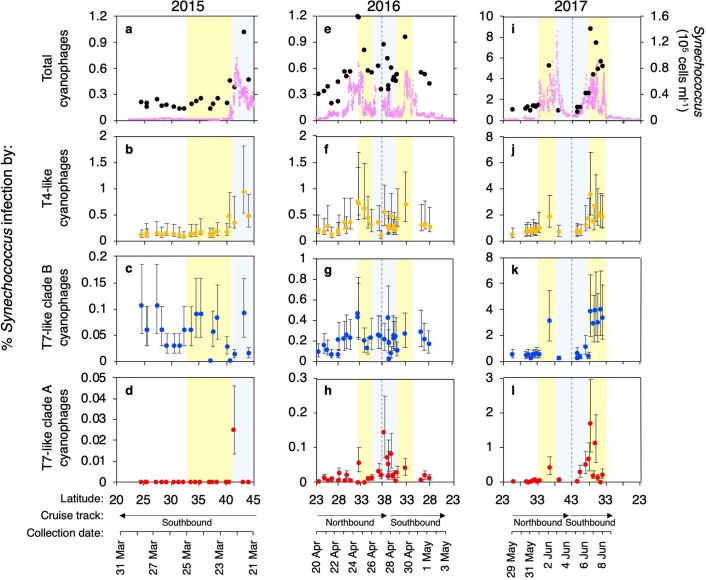
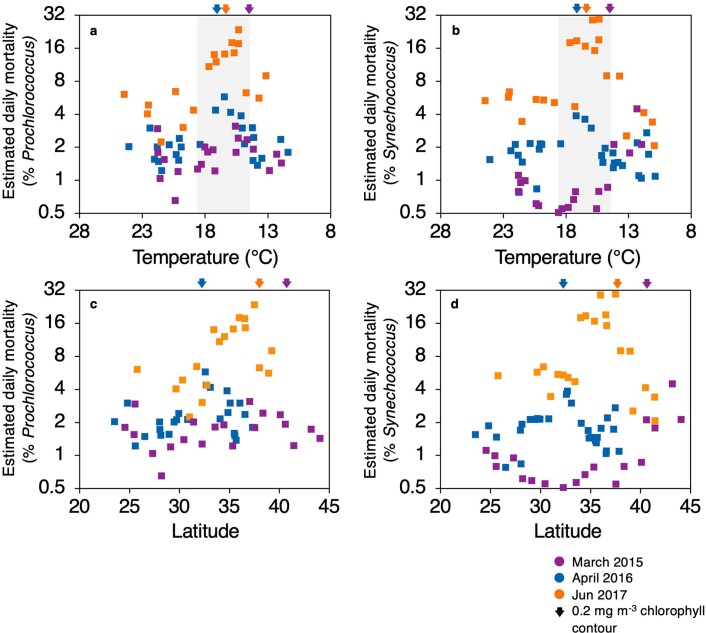
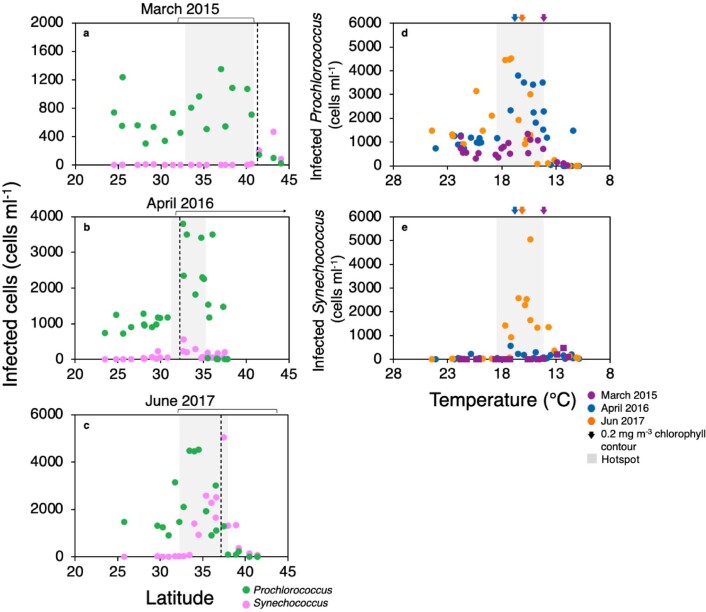
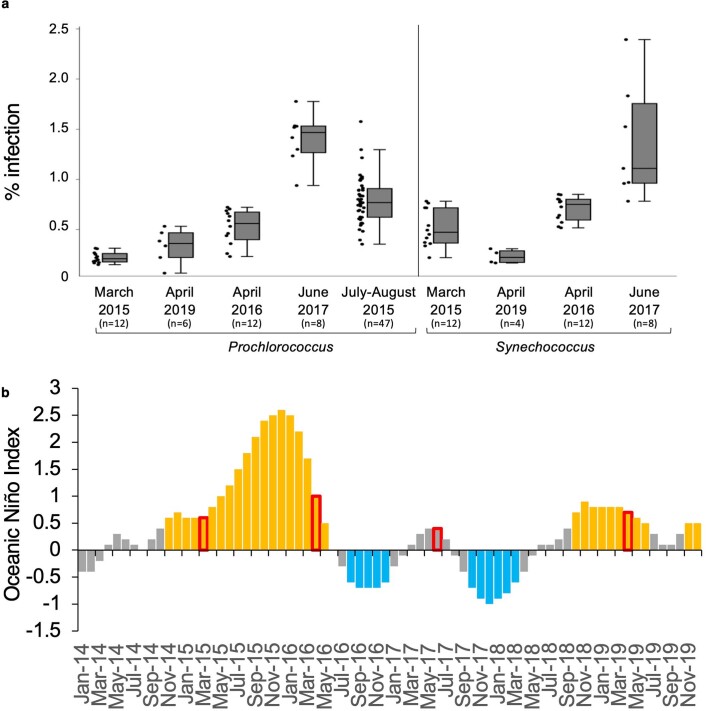
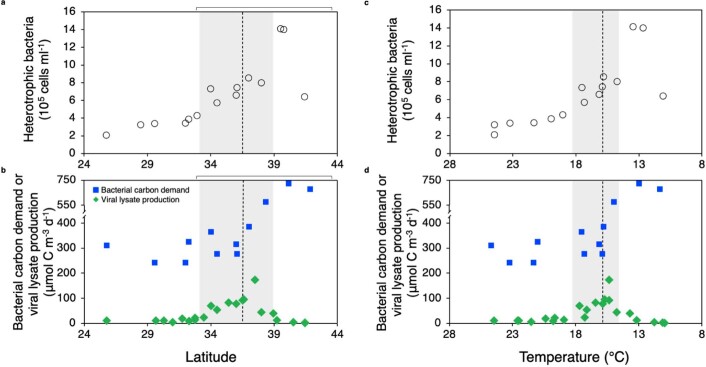
The photosynthetic picocyanobacteria Prochlorococcus and Synechococcus are models for dissecting how ecological niches are defined by environmental conditions, but how interactions with bacteriophages affect picocyanobacterial biogeography in open ocean biomes has rarely been assessed. We applied single-virus and single-cell infection approaches to quantify cyanophage abundance and infected picocyanobacteria in 87 surface water samples from five transects that traversed approximately 2,200 km in the North Pacific Ocean on three cruises, with a duration of 2-4 weeks, between 2015 and 2017. We detected a 550-km-wide hotspot of cyanophages and virus-infected picocyanobacteria in the transition zone between the North Pacific Subtropical and Subpolar gyres that was present in each transect. Notably, the hotspot occurred at a consistent temperature and displayed distinct cyanophage-lineage composition on all transects. On two of these transects, the levels of infection in the hotspot were estimated to be sufficient to substantially limit the geographical range of Prochlorococcus. Coincident with the detection of high levels of virally infected picocyanobacteria, we measured an increase of 10-100-fold in the Synechococcus populations in samples that are usually dominated by Prochlorococcus. We developed a multiple regression model of cyanophages, temperature and chlorophyll concentrations that inferred that the hotspot extended across the North Pacific Ocean, creating a biological boundary between gyres, with the potential to release organic matter comparable to that of the sevenfold-larger North Pacific Subtropical Gyre. Our results highlight the probable impact of viruses on large-scale phytoplankton biogeography and biogeochemistry in distinct regions of the oceans.


Conflict of interest statement

The authors declare no competing interests.

Figures

Fig. 1
Fig. 1. Gradients in environmental conditions across the North Pacific gyres.
ac, Transects of three cruises overlaid on monthly averaged satellite-derived sea-surface chlorophyll in March 2015 (a), April 2016 (b) and June 2017 (c). d, Temperature–salinity diagram showing the boundaries of the subtropical and subpolar gyres (black dashed lines) based on the salinity thresholds reported by Roden. ei, Temperature (e), salinity (f) as well as the levels of particulate carbon (g), phosphate (h) and nitrate + nitrite (i) as a function of latitude. The coloured dashed lines show the position of the 0.2 mg m−3 chlorophyll contour. For environmental variables plotted against temperature, see Supplementary Fig. 3.
Fig. 2
Fig. 2. Shifts in the distributions of Prochlorococcus, Synechococcus and cyanophages in the North Pacific Ocean.
ac, The distributions of Prochlorococcus (a), Synechococcus (b) and cyanophages (c) were measured at high resolution in the surface waters along the transects of the three cruises in this study and plotted as a function of temperature. d, The relationship between the total numbers of picocyanobacteria and cyanophages. There was no relationship across the data from all regimes (Pearson’s r = −0.008, two-sided P = 0.9, n = 87). Picocyanobacteria correlated positively with cyanophages in the subtropics (Pearson’s r = 0.54, two-sided P = 0.02, n = 26). In the hotspot, the picocyanobacteria abundance correlated negatively with that of cyanophages across all three cruises (Pearson’s r = −0.56, two-sided P = 0.0005, n = 34). There was no relationship found in the subpolar region (Pearson’s r = 0.2, two-sided P = 0.2, n = 27).
Fig. 3
Fig. 3. Cyanophage community composition across the North Pacific gyres.
ac, Cyanophage abundance for the March 2015 (a), April 2016 (b) and June 2017 (c) transects. Insets: T7-like clade A and TIM5-like cyanophage abundances on an expanded scale (similar to the main images, the units for the vertical axes are ×105 viruses ml−1). The grey shaded regions show the position of the virus hotspot. See Extended Data Fig. 4 for the confidence intervals and out-and-back reproducibility and Supplementary Fig. 4 for cyanophage lineages plotted against latitude.
Fig. 4
Fig. 4. Viral infection patterns of picocyanobacteria in the North Pacific Ocean.
af, Viral infection levels (black) of Prochlorococcus (a,c,e) and Synechococcus (b,d,f) plotted against temperature for the March 2015 (a,b), April 2016 (c,d) and June 2017 (e,f) transects. Insets: infection levels on an expanded scale. The solid lines show infection (red), Prochlorococcus (green) and Synechococcus (pink) averaged and plotted for every 0.5 °C. The dashed lines and shaded regions show the position of the chlorophyll front and the virus hotspot, respectively. For plots by latitude and the upper and lower bounds of infection, see Extended Data Figs. 5 and 6.
Fig. 5
Fig. 5. Prediction of cyanophage abundances.
ac, Model-based predictions of cyanophage abundances corresponding to the empirically measured total (a), T4-like (b) and T7-like clade B (c) cyanophage abundances along a transect in the North Pacific in April 2019. The shaded regions show the 95% confidence interval for the model predictions. d,e, Predicted total cyanophages (d) and the ratio of T4-like/T7-like clade B cyanophages (e) in June 2017 in the North Pacific Ocean. The black lines indicate the cruise track. The grey areas represent regions with no values due to cloud cover or that were beyond the limits of the predictive model. The hotspot peak corresponds to yellow regions in d and red regions in e.
Extended Data Fig. 1
Extended Data Fig. 1. Bacteria and virus abundances across the transects.
Total bacteria (heterotrophic and picocyanobacteria) (a, e), percent Prochlorococcus of total bacteria (b, f), total virus-like particles (c, g), and percent cyanophages of total virus-like particles (d, h) in the surface waters of the North Pacific in March 2015 (purple), April 2016 (blue), and June 2017 (orange). Data are plotted against latitude (a-d) or temperature (e-h). Dashed lines (a-d) or arrows (e-h) show the latitude of the 0.2 mg·m−3 chlorophyll contour as in Fig. 1. Colour bars at the top (a-d) or shaded region (e-h) indicate the position of the virus hotspot.
Extended Data Fig. 2
Extended Data Fig. 2. Latitudinal distributions of picophytoplankton and cyanophages in the North Pacific Ocean.
Semicontinuous sampling of picophytoplankton across the transects. Note that the scale of picoeukaryote abundances is 2-fold lower than that of the picocyanobacteria. Cyanophage abundances are averages determined from 10,000 bootstrapping and resamplings of the phage-to-polony conversion efficiencies (see Methods). Error bars show 95% confidence intervals for cyanophage abundances which are the 95% quantiles of the bootstrap analyses.
Extended Data Fig. 3
Extended Data Fig. 3. Comparison of picocyanobacterial abundances to abiotic factors.
Prochlorococcus (left) and Synechococcus (right) abundances plotted against concentrations of phosphate (a,b), nitrate+nitrite (c,d), particulate carbon (e,f), salinity (g,h), and mixed layer depth (i,j) for the March 2015 (purple), April 2016 (blue), and June 2017 (orange) transects.
Extended Data Fig. 4
Extended Data Fig. 4. Recurrent patterns in the abundances of different cyanophage lineages.
T4-like (orange), T7-like clade B (blue), T7-like clade A (red), and TIM5-like (green) cyanophage abundances are plotted for the 2015 (left panel, a-d), 2016 (middle panel, e-i), and 2017 (right panel, j-m) transects against latitude (primary x-axis). Northbound and southbound legs of the transects in 2016 and 2017, indicated below the axis, are unfolded on the x-axis as they overlap, and dashed lines indicate the switch in direction between the two transect legs. Date of sample collection is shown as a secondary x-axis. Cyanophage abundances are averages determined from 10,000 bootstrapping and resamplings of the phage-to-polony conversion efficiencies (see Methods). Error bars show 95% confidence intervals for cyanophage abundances which are the 95% quantiles of the bootstrap analyses. The location of the hotspot is indicated by yellow shading, sampling occurring northward of the hotspot is indicated by light blue shading. Note the change in the magnitude of the vertical axis for the different cyanophage lineages.
Extended Data Fig. 5
Extended Data Fig. 5. Recurrent patterns in the infection of Prochlorococcus by different cyanophage lineages.
Prochlorococcus abundances are shown in green (top row: a, e, i). Infection levels by all cyanophages combined (black: a, e, i), T4-like (orange: b, f, j), T7-like clade B (blue: c, g, k), and T7-like clade A (red: d, h, l) cyanophages are plotted against the latitudinal position of the cruise track. Northbound and southbound legs of the transects in 2016 and 2017, indicated below the axis, are unfolded on the x-axis as they overlap, and dashed lines indicate the switch in direction between the two transect legs. Date of sample collection is shown as a secondary x-axis. Infection levels are averages determined from 10,000 bootstrapping and resamplings of the cell-to-polony conversion efficiencies (see Methods). The maximum and minimum bounds of infection are represented by error bars. The limit of accurate detection of infection using this assay is <0.05% infection. The location of the hotspot is indicated by yellow shading, sampling occurring northward of the hotspot is indicated by blue shading.
Extended Data Fig. 6
Extended Data Fig. 6. Recurrent patterns in the infection of Synechococcus by different cyanophage lineages.
Synechococcus abundances are shown in pink (top row: a, e, i). Infection levels by all cyanophages combined (black: a, e, i), T4-like (orange: b, f, j), T7-like clade B (blue: c, g, k), and T7-like clade A (red: d, h, l) cyanophages are plotted against the latitudinal position of the cruise track. Northbound and southbound legs of the transects in 2016 and 2017, indicated below the axis, are unfolded on the x-axis as they overlap, and dashed lines indicate the switch in direction between the two transect legs. Date of sample collection is shown as a secondary x-axis. Infection levels are averages determined from 10,000 bootstrapping and resamplings of the cell-to-polony conversion efficiencies (see Methods). The maximum and minimum bounds of infection are represented by error bars. The limit of accurate detection of infection using this assay is <0.05% infection. The location of the hotspot is indicated by yellow shading, sampling occurring northward of the hotspot is indicated by blue shading.
Extended Data Fig. 7
Extended Data Fig. 7. Estimated daily virus-mediated mortality of the picocyanobacterial in the North Pacific Ocean.
Mortality of Prochlorococcus (a, c) and Synechococcus (b, d) plotted against temperature (a, b) and latitude (c, d) was estimated by multiplying the instantaneous infection measurements by the number of infection cycles that could be completed in 24 hours based on temperature and light intensity adjusted average cyanophage latent periods (Supplementary Table 3).
Extended Data Fig. 8
Extended Data Fig. 8. Changes in infected cell densities across latitude and temperature.
The density (cells·ml−1) of total infected Prochlorococcus (green) and Synechococcus (pink) are shown by latitude for the March 2015 (a), April 2016 (b), and June 2017 (c) transects. Prochlorococcus (d) and Synechococcus (e) infected cell abundances plotted against temperature across the March 2015 (purple), April 2016 (blue), and June 2017 (orange) transects. Shaded regions indicate the hotspot, dashed lines (a-c) or arrows (d, e) indicate the chlorophyll front, and brackets (a-c) indicate the transition zone.
Extended Data Fig. 9
Extended Data Fig. 9. Seasonal and interannual infection dynamics.
(a) Seasonally increasing infection levels for Prochlorococcus (left) and Synechococcus (right) from cruises in March 2015, April 2019, April 2016, June 2017 (this study), and July-August 2015 in the subtropical gyre. Boxes show the median, 1st quartile, 3rd quartile, minimum and maximum are shown by box-and-whisker plots. Individual data points are shown to the left of each box. (b) Oceanic Niño Indices for 2014–2019 from the National Oceanographic and Atmospheric Administration. Warm phases (>0.5) are indicated by orange, neutral phases (−0.5–0.5) are indicated by grey, and cool phases (<−0.5) are indicated by blue. Red boxes indicate the timing of the March 2015, April 2016, July 2017 and April 2019 cruises in this study. A record marine heatwave occurred in 2015 and 2016 when infection levels were low. The 2017 transects which had high viral infection occurred during a cool phase of the El Niño Oscillation. When El Niño conditions and the warm temperature anomaly returned in 2019, infection levels were low in the subtropical gyre in April, consistent with both seasonal and climatic hypotheses.
Extended Data Fig. 10
Extended Data Fig. 10. Virus-mediated organic matter production and heterotrophic bacteria abundances across the transects in June 2017.
(a, c) The abundances of heterotrophic bacteria along the June 2017 transects are reproduced from Extended Data Fig. 1 for ease of comparison. (b, d) Estimated bacterial carbon demand (blue) calculated from 3H-Leucine incorporation and an assumed bacterial growth efficiency of 0.15 and virus-mediated lysate production (green) based on daily picocyanobacteria mortality. Dashed lines indicate the 0.2 mg·m−3 chlorophyll front. Shaded regions indicate the position of the cyanophage hotspot and brackets indicate the transition zone.

Comment in

Similar articles

Cited by

References

    1. Moore CM, et al. Processes and patterns of oceanic nutrient limitation. Nat. Geosci. 2013;6:701–710.
    1. Cullen, J., Franks, P., Karl, D. M. & Longhurst, A. in The Sea Vol. 12 (eds Robinson, A. R. et al.) 297–335 (Wiley, 2002).
    1. Thomas MK, Kremer CT, Klausmeier CA, Litchman E. A global pattern of thermal adaptation in marine phytoplankton. Science. 2012;338:1085–1088. - PubMed
    1. Browning TJ, et al. Nutrient co-limitation at the boundary of an oceanic gyre. Nature. 2017;551:242–246. - PubMed
    1. Longhurst, A. R. Ecological Geography of the Sea (Academic Press, 2007).

Publication types