. 2022 May;27(5):2470-2484.
doi: 10.1038/s41380-022-01486-x. Epub 2022 Apr 1.

Astrocytes derived from ASD individuals alter behavior and destabilize neuronal activity through aberrant Ca2+ signaling

Affiliations

Astrocytes derived from ASD individuals alter behavior and destabilize neuronal activity through aberrant Ca2+ signaling

Megan Allen et al. Mol Psychiatry. 2022 May.

Abstract

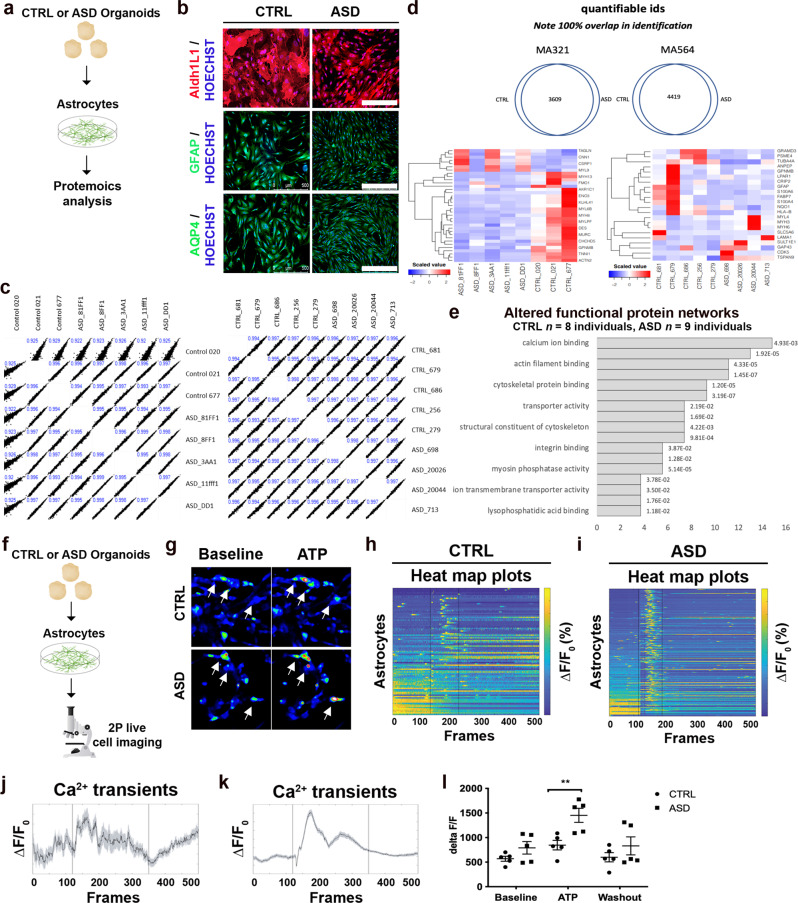
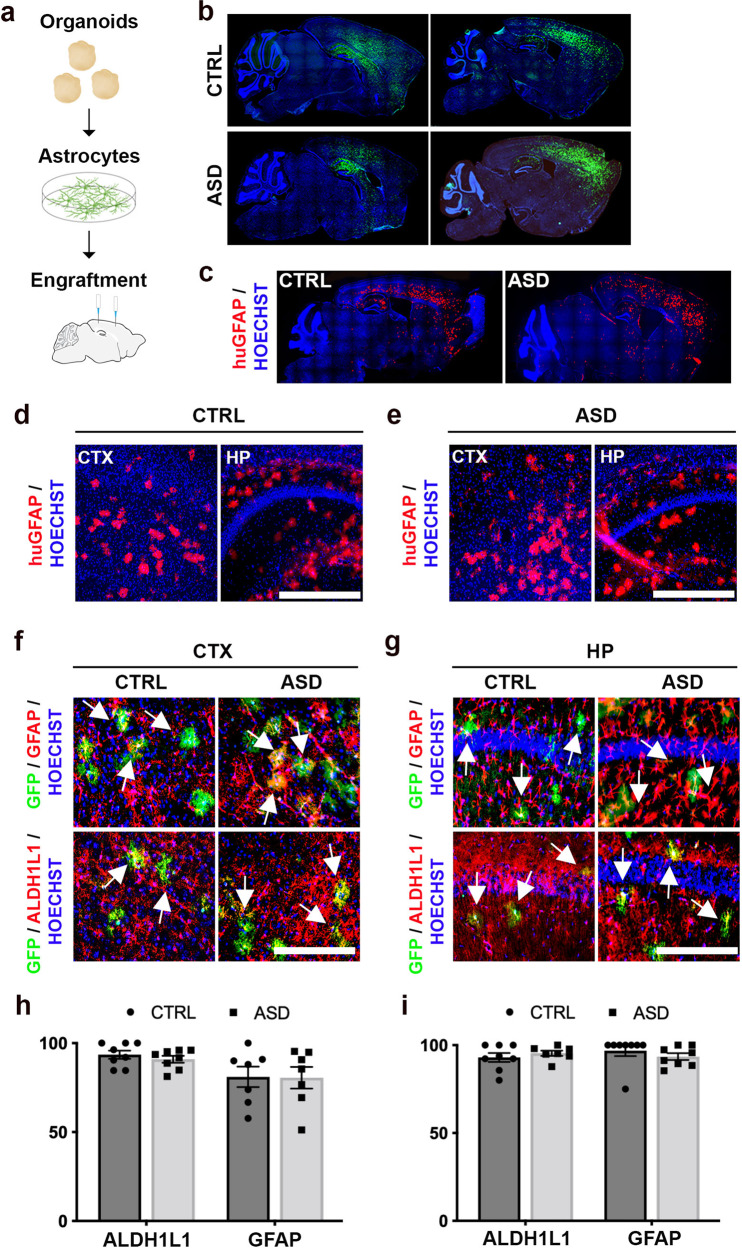
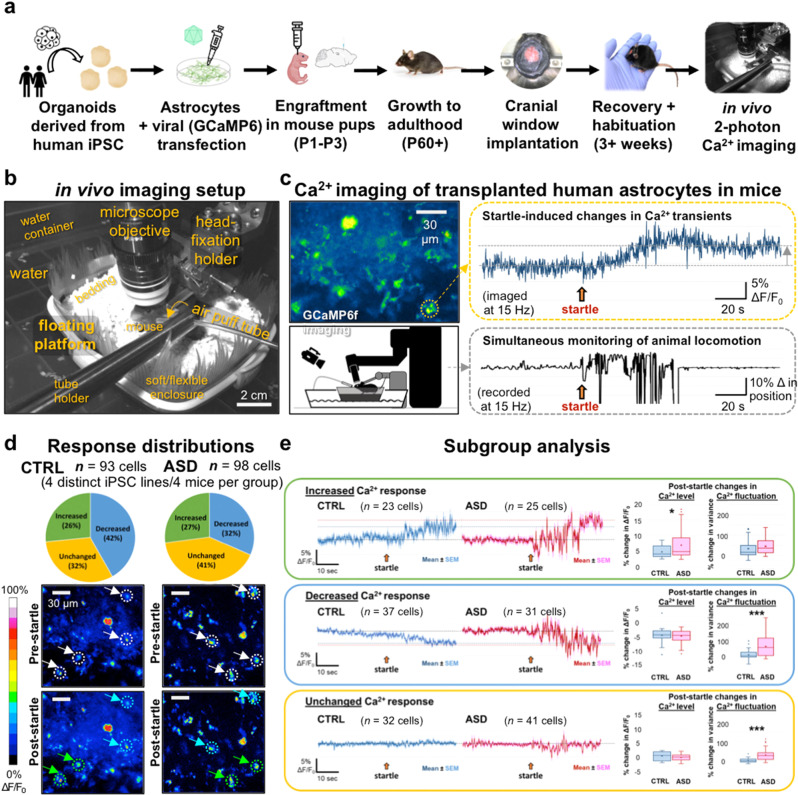
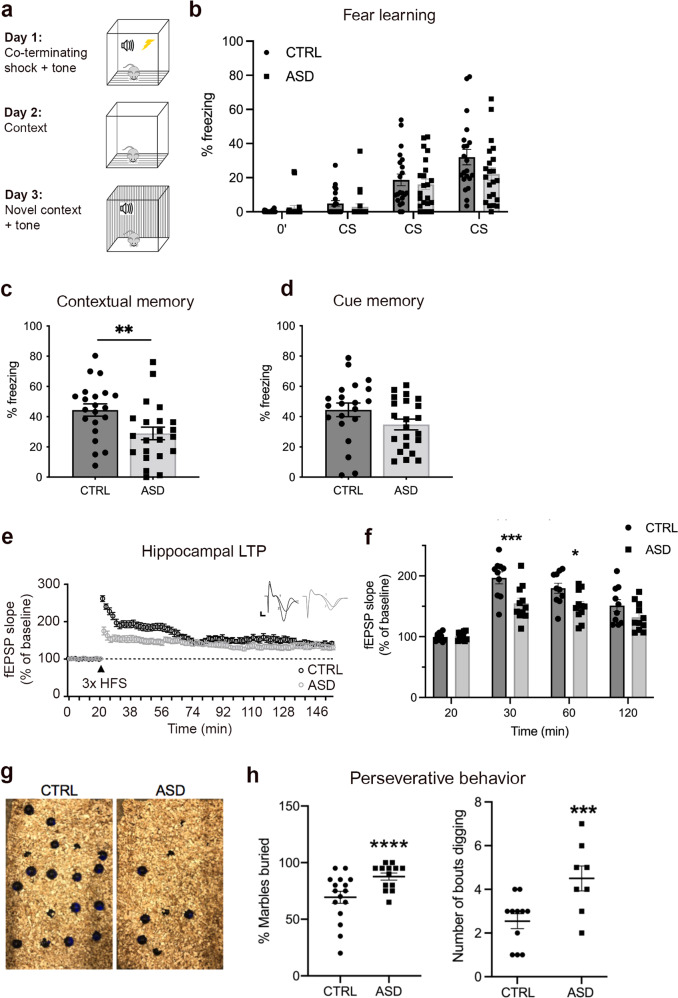
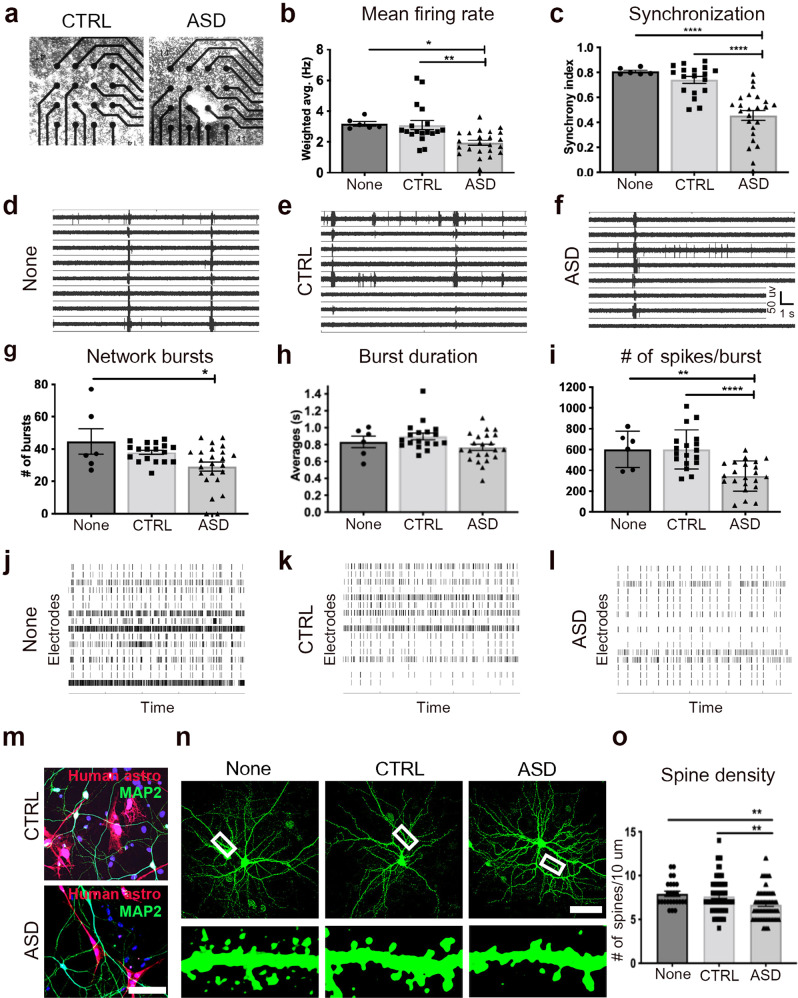
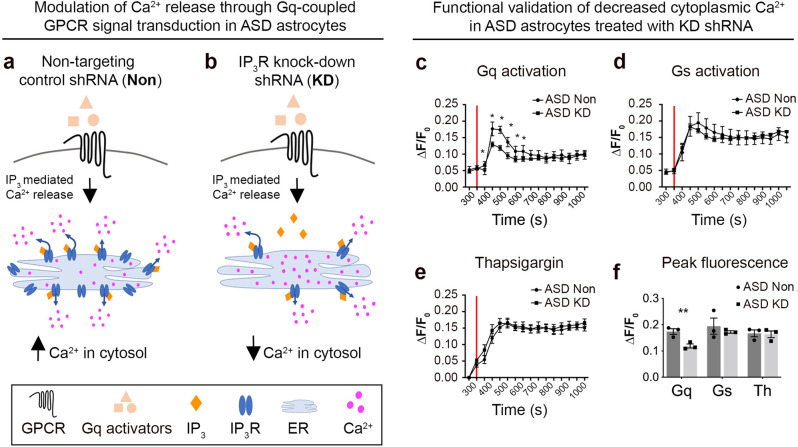
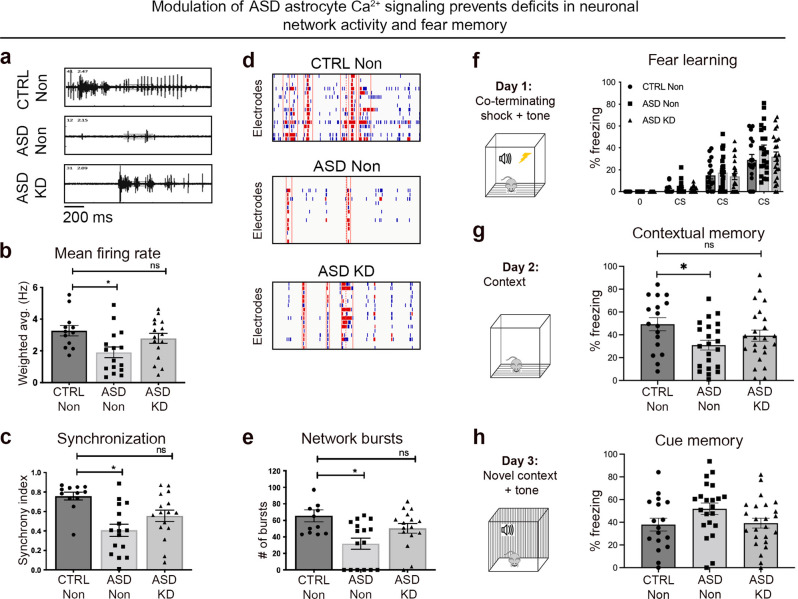
The cellular mechanisms of autism spectrum disorder (ASD) are poorly understood. Cumulative evidence suggests that abnormal synapse function underlies many features of this disease. Astrocytes regulate several key neuronal processes, including the formation of synapses and the modulation of synaptic plasticity. Astrocyte abnormalities have also been identified in the postmortem brain tissue of ASD individuals. However, it remains unclear whether astrocyte pathology plays a mechanistic role in ASD, as opposed to a compensatory response. To address this, we combined stem cell culturing with transplantation techniques to determine disease-specific properties inherent to ASD astrocytes. We demonstrate that ASD astrocytes induce repetitive behavior as well as impair memory and long-term potentiation when transplanted into the healthy mouse brain. These in vivo phenotypes were accompanied by reduced neuronal network activity and spine density caused by ASD astrocytes in hippocampal neurons in vitro. Transplanted ASD astrocytes also exhibit exaggerated Ca2+ fluctuations in chimeric brains. Genetic modulation of evoked Ca2+ responses in ASD astrocytes modulates behavior and neuronal activity deficits. Thus, this study determines that astrocytes derived from ASD iPSCs are sufficient to induce repetitive behavior as well as cognitive deficit, suggesting a previously unrecognized primary role for astrocytes in ASD.


Conflict of interest statement

The authors declare no competing interests.

Figures

Fig. 1
Fig. 1. Aberrant Ca2+ activity in ASD astrocytes.
a, b Spontaneous generation of human astrocytes. a Astrocytes were dissociated from ASD or CTRL organoids at day 75 and expanded in culture (see “Methods” section). b Representative images from immunostainings shows that astrocytes dissociated from organoids expressed multiple astrocyte markers: ALDH1L1, GFAP, and AQP4 as well as Vimentin and S100Beta (see also Supplementary Fig. 1b–d). ce Proteomic study identified Ca2+ signaling as the most significantly altered network in ASD astrocytes. Proteins were extracted from astrocytes and labeled with Tandem Mass Tag (TMT) chemistry followed by LC/MS analysis. c Two independent proteomic runs and analyses, of which each exhibited high experimental reproducibility. d Venn diagrams for both runs revealed 3609 and 4419 proteins, respectively, which were common to both CTRL and ASD astrocyte samples. e GO analysis revealed enrichment for Ca2+ ion binding proteins in ASD samples. fi Increased Ca2+ activity in ASD astrocytes. f CTRL or ASD astrocytes were loaded with Ca2+ indicator dye (Fluo-4-am, 1 μM). Data are shown as the change in fluorescent activity divided by baseline fluorescent activity (ΔF/F0). g Representative still images taken from the imaging videos highlighted fluorescent activity under baseline conditions (left) and after application of 50 μM ATP (right). Arrows point to cells that expressed Ca2+ transients under baseline conditions (left) and after stimulation with ATP (50 μM). ASD astrocytes responded to stimulation with more intense transients as evidenced by increased fluorescence (hotter color) (see also Supplementary Video 1). Representative heat maps of Ca2+ responses from CTRL (h) or ASD (i) astrocytes across time visually confirmed enhanced evoked responses from ASD astrocytes (application of ATP occurred within black vertical lines). Evoked responses (ΔF/F0) from all CTRL (j) and ASD (k) recordings, sampled over multiple days of recording and from multiple ASD lines, were plotted as a function of time (frames). l Quantification of the maximal peak amplitude of Ca2+ upon application of ATP showed that, when compared to CTRL astrocytes, ASD astrocytes exhibited increased Ca2+ activity in response to ATP. In summary, two independent experiments confirmed that ASD astrocytes harbor dysfunctional Ca2+ signaling. Scale bar = 500 μm. Data are represented as mean ± SEM. Proteomics analysis: CTRL n = 8 lines; ASD n = 9 lines. Two-photon Ca2+ imaging: CTRL n = 865 cells from five lines; ASD n = 847 cells from five lines.
Fig. 2
Fig. 2. Organoid-derived astrocytes migrate throughout the mouse cortex and survive into adulthood.
a Schematic of experimental workflow. We transplanted a total of 8–10 × 105 astrocytes (infected with CAG-GFP virus) into the brains of Rag2KO neonatal mice, spread out over four injection sites, which were bilateral along the midline, anterior and posterior to bregma. be Immunostained whole brain slices cut on the sagittal plane both for GFP (b) and the human-specific GFAP epitope (huGFAP) at P60 showed a wide and homogenous spread throughout the cortex (c) (see also Supplementary Fig. 4 for stereological quantifications). d, e Representative higher magnification images illustrated the spread of huGFAP in cortex and hippocampus of chimeric mice. fi Representative co-immunostained images of chimeric brains revealed high co-localization of GFP expression (human astrocytes, green) with the two astrocyte markers, GFAP (red, top panel) and ALDH1L1 (red, bottom) in the cortex (f) and hippocampus (g). Arrows indicate examples of dual positive cells. More than 90% of GFP+ cells expressed astrocyte markers suggesting that astrocytes retained their identities upon maturation in the adult mouse brain (h and i, see also Supplementary Fig. 5). These results establish that CTRL and ASD astrocytes dissociated from organoids generated homogenous transplantations in host brains. CTX Cortex, HP Hippocampus. Scale bar = 500 μm for d and e and 250 μm for f and g. Data are represented as mean ± SEM. Co-localization: CTRL and ASD n = 8 per group (2 mice/2 distinct lines, and 4 slices per brain).
Fig. 3
Fig. 3. In vivo imaging confirms aberrant Ca2+ activity in ASD astrocytes.
a Schematic of experimental workflow. b In vivo imaging setup. Photograph with labeled components of our custom-designed floating platform, developed to provide a tactile virtual-reality environment for head-fixed mice and to enable imaging of actively locomoting animals with minimal motion confounds (see “Methods” for details). c Ca2+ imaging of transplanted human astrocytes in mice. Left, upper panel: a representative image of GCaMP6f-expressing human astrocytes in the cortex of a mouse engrafted with cells derived from a CTRL human subject. Right, upper panel (orange box): Ca2+ transient recorded from the cell marked by the orange circle on the left image, showing an increase in Ca2+ level after the startle/air-puff stimulus (orange arrow). Left bottom panel: schematic of the imaging setup. The mouse is situated at the center on top of an enclosed platform (boat) floating on water (see “Methods” for details). Right bottom panel (gray box): representative trace of recorded locomotion during imaging, produced by analyzing the infrared video recording and plotting the light intensity change of a select ROI (region of interest) on the floating platform. As animal movement directly translated into platform displacement, any body motion generated by the animal could be tracked with accuracy and high temporal resolution, even heavy breathing could be seen indicated by the brief ticks at the latter part of the recording. d Response distributions. Transplanted human astrocytes displayed a variety of Ca2+ activity responses in vivo in reaction to the air-puff startle stimulus, including increased, decreased, and unchanged Ca2+ levels. We segmented the cells with a 20-μm-diameter mask, which encompassed both soma and processes. Top: pie charts showing the percent distribution of each response types in CTRL and ASD astrocytes. Bottom: representative images of CTRL and ASD astrocytes before and after startle. White circles and arrows (upper panels) point to sample cells showing post-startle increased (green arrows/circles) and decreased (blue arrows/circles) Ca2+ responses. e Subgroup analysis. For all traces, the mean ± SEM are plotted, representing the population average. Top (green box): increased response (cells displaying a positive change in ΔF/F after startle). Box plots showing ASD cells exhibit a significantly larger increase than CTRL cells (post-startle % change in ΔF/F: CTRL: +4.66 ± 0.384%, n = 23; ASD: +6.81 ± 0.937%, n = 25; unpaired t-test, p = 0.04). No significant differences are found in the changes in fluctuation between CTRL and ASD cells. Middle (blue box): decreased Ca2+ response subgroup (cells showing negative change in ΔF/F after startle). Both CTRL and ASD show decreases in Ca2+ to similar levels (~ −5%). However, there is a drastic difference in their change in Ca2+ fluctuations. Compare the flat downward sloping blue trace vs. the red trace with the dramatic fluctuation after startle. The box plots quantitatively illustrate this difference (Post-startle change in Ca2+ fluctuation: CTRL: 7.08 ± 4.74%, n = 37; ASD: 60.74 ± 11.04%, n = 31; unpaired t-test, p = 0.000062). Bottom (orange box): unchanged Ca2+ response subgroup (cells whose changes in Ca2+ levels are between +2 and −2%). While CTRL cells in this group show a completely flat and unresponsive activity profile, the ASD cells with unchanged Ca2+ levels showed a highly significant change in Ca2+ fluctuation (30% increase in variance) (Post-startle change in Ca2+ fluctuation: CTRL: 1.39 ± 2.08%, n = 32; ASD: 30.75 ± 4.63%, n = 41, unpaired t-test, p = 0.00000036).
Fig. 4
Fig. 4. ASD astrocyte chimeric mice exhibit impaired fear memory and hippocampal LTP along with repetitive behavior.
ad ASD astrocyte chimeric mice displayed deficits in fear memory but not in fear learning. a Schematic summarizing classical fear-conditioning paradigm. On day 1, mice were trained to associate an audible tone (30 s duration, 70 dB) with a co-terminating foot shock (1-s duration, 0.7 mA). Testing days 2 and 3 measured freezing behavior in response to exposure to the training context or an audible cue in a novel context, respectively. Freezing behavior in the testing trials provided a quantifiable measure of fear memory (see also “Methods”). b There was no significant difference in the rate of acquisition learning between CTRL and ASD mice (ANOVA with Bonferroni posthoc test p value >0.05). c ASD chimeric mice showed reduced freezing behavior when exposed to the fear context (unpaired t-test = 0.009). d No differences were found in the freezing behavior between CTRL or ASD chimeric mice during cue presentation in a novel context (unpaired t-test = 0.10). e, f LTP was tested as a synaptic correlate of learning and memory in hippocampal brain slices (400 µm) of 4–6-month old transplanted mice. ASD astrocyte chimeric brain slices showed reduced potentiation in the early phase of LTP compared to control (30–60 min). ASD astrocyte chimeric brain slices displayed the greatest differences in the fEPSP slope within the first 60 min of recording (f). g, h To test ASD chimeric mice for repetitive behavior, we employed the marble burying test as well as monitored circling and backflipping. Marbles were scored as buried if at least 60% of the marble was covered (30-min period) (g). ASD astrocyte chimeric mice buried significantly more marbles when compared to CTRL astrocyte chimeric mice (unpaired t-test = 0.009) but exhibited no circling or backflipping (h). Taken together, these results indicate that ASD astrocytes induce ASD-related perseverative behavior, memory dysfunction, and hippocampal LTP deficits. Data are represented as mean ± SEM. Fear testing: CTRL n = 21 male and female mice/4 distinct lines, ASD n = 22 male and female mice/3 distinct lines; LTP: CTRL n = 10 slices, 4 mice/2 distinct lines; ASD n = 10 slices, 5 mice/2 distinct lines). Marble burying behavior: CTRL n = 16 mice/5 distinct lines, ASD n = 13 mice/5 distinct lines.
Fig. 5
Fig. 5. ASD astrocytes decrease neuronal network firing and spine density in vitro.
al Primary hippocampal neurons dissociated from E16-18 WT mouse brains were co-cultured with human astrocytes isolated from CTRL or ASD organoids to measure spontaneous network activity with MEA. CTRL cultures refer to co-culturing of CTRL human astrocytes with hippocampal neuronal cultures (naturally containing some mouse astrocytes), and ASD cultures refer to co-culturing of ASD human astrocytes with hippocampal neuronal cultures (naturally containing some mouse astrocytes). “None” cultures refer to hippocampal neuronal cultures (containing some mouse astrocytes) without any addition of human astrocytes. a Representative images of co-cultures plated in a single well of a 48-well array plate. b ASD astrocyte co-cultures displayed decreased mean network firing rate when compared to CTRL co-cultures and None. (ANOVA with Tukey’s posthoc test None vs. CTRL p value = 0.98, None vs. ASD p value = 0.02, CTRL vs. ASD p value = 0.002, see also Supplementary Video 2). c ASD astrocytes also disrupted network synchronization when compared to CTRL astrocytes and None (None vs. CTRL p value = 0.65, None vs. ASD p value <0.0001, CTRL vs. ASD p value < 0.0001). df Representative raw traces of spontaneous spiking activity over a 10-s period. g ASD astrocytes decreased the # of network bursts when compared to None (None vs. ASD p value = 0.02, CTRL vs. ASD p value = 0.06). h, i ASD astrocytes did not affect average burst duration but decreased the # of spikes per burst network (None vs. ASD p value = 0.005, CTRL vs. ASD p value <0.0001). jl Representative raster plots (4-min) demonstrated the decrease in burst number and spikes per bursts in the ASD co-culture group compared to CTRL co-culture and None. mo Spine density quantified in a 10 μm dendritic segment at least 20 μm away from the soma in hippocampal neurons co-cultured with ASD or CTRL human astrocytes. m Immunostained co-cultures with human astrocytes infected with CMV GFP lentivirus (pseudo colored red) prior to co-culture. n Neurons were labeled with a αCamKII GFP AAV at DIV5 and fixed at DIV18 (10 μm dendritic segments shown at bottom). o ASD astrocytes decreased spine density on primary hippocampal neurons (None vs. CTRL p value = 0.78, None vs. ASD 0.009, CTRL vs. ASD p value = 0.004). These results provide direct evidence that ASD astrocytes influence structural and functional properties of neurons that weaken electrophysiological activity. Scale bar = 100 μm. Data are represented as mean ± SEM. MEA: None n = 6 wells, CTRL n = 18 wells, 3 distinct lines; ASD n = 22–24 wells, 4 distinct lines. Spine quantification: None n = 25 neurons, CTRL n = 71 neurons co-cultured with 4 distinct lines, ASD n = 81 neurons co-cultured with 5 distinct lines. CTRL: Co-cultures of CTRL human astrocytes with mouse hippocampal neurons. ASD: Co-cultures of ASD human astrocytes with mouse hippocampal neurons. None: Mouse hippocampal neuron cultures with no human astrocytes.
Fig. 6
Fig. 6. Modulation of Ca2+ signaling in ASD astrocytes.
a, b ASD astrocytes were transduced with an shRNA lentivirus to downregulate IP3Rs (KD). As a control, ASD astrocytes were infected with a non-targeting shRNA lentivirus (Non). cf A high throughput Ca2+ mobilization assay was optimized (see “Methods”) for validation of Ca2+ modulation upon knockdown of IP3Rs. c ASD KD astrocytes responded to the application of a cocktail of Gq activators (red line, 50 μM DHPG, 50 μM norepinephrine, 50 μM ATP, and 50 nM Endothelin 1) with diminished Ca2+ mobilization compared to ASD Non astrocytes. d ASD KD astrocytes did not display reduced Ca2+ mobilization in response to activation of Gs GPCR signal transduction (12.5 nM forskolin), which does not rely on IP3R mediated Ca2+ release from the ER, indicating the specificity of the KD system. e No differences were detected in the total Ca2+ concentration stored in the ER between ASD KD or Non astrocytes. Application of thapsigargin (2 μM, red line) depleted the ER Ca2+ and inhibited reuptake by Sarco/ER Ca2+-ATPase (SERCA) Ca2+ pumps. f ASD KD astrocytes showed lower Ca2+ responses to Gq activation compared ASD astrocytes, which indicates that IP3R reduction in ASD astrocytes modulated evoked increases in cytosolic Ca2+ from internal stores without changing its total concentration in the ER (Gq activation vs. Thapsigargin).
Fig. 7
Fig. 7. ASD astrocytes with modulated Ca2+ signaling do not induce impaired network activity and memory.
ae Human astrocytes were infected with either the non-targeting shRNA lentivirus (Non) or the IP3Rs shRNA lentivirus (KD) and co-cultured with primary hippocampal neurons. a Decrease in spiking pattern in untreated ASD Non co-cultures was corrected upon IP3Rs KD in ASD astrocytes. b As in Fig. 5, ASD co-cultures displayed decreased mean network firing rate when compared to CTRL co-cultures. Modulation of ASD astrocyte Ca2+ mobilization conferred protection against deficits in mean firing rate (see also Supplementary Video 3). c Similarly, ASD Non co-cultures displayed lower synchronicity that was corrected in ASD KD co-cultures. d Downregulation of IP3R rescued the phenotypes in network burst number (red hash marks surrounded by red boxes) and spikes per bursts (red hash marks) in the ASD astrocytes. e Unlike untreated ASD astrocytes, ASD KD astrocytes displayed similar number of network bursts when compared to CTRL astrocytes. These findings suggest that fine-tuning ASD astrocyte Ca2+ levels protects against deficits induced by untreated ASD astrocytes. fh CTRL Non astrocytes, ASD Non astrocytes, and ASD KD astrocytes were transplanted into the brains of neonatal Rag2KO mice. f Similar to the previous experiment, there was no significant difference in the rate of acquisition learning between CTRL and ASD mice. g As in Fig. 4, ASD Non chimeric mice showed reduced freezing behavior when exposed to the fear context relative to CTRL Non chimeric mice. However, this difference was eliminated between ASD KD and CTRL Non chimeric mice, indicating that amelioration of cytosolic Ca2+ in ASD astrocytes prevents fear memory deficits. h No significant differences were detected in freezing behavior between CTRL, ASD, and ASD KD mice during cue presentation in a novel context. Together, these results indicate that exaggerated Ca2+ release from internal stores in ASD astrocytes is responsible for neuronal network activity and memory deficits caused by these cells. MEA: CTRL Non co-cultures n = 12 wells, 3 distinct lines; ASD Non n = 10–16 wells, 4 distinct lines; ASD KD n = 15–16 wells, 4 distinct lines. Fear testing: CTRL Non n = 17 male and female mice, transplanted with 2 distinct lines, ASD Non n = 22 male mice, transplanted with 4 distinct lines, ASD KD n = 24 male mice, transplanted with 4 distinct lines. CTRL Non: Control human astrocytes infected with non-targeting shRNA lentivirus. ASD Non: ASD astrocytes infected with non-targeting shRNA lentivirus. ASD KD: ASD astrocytes infected with IP3R shRNA lentivirus.

Similar articles

Cited by

References

    1. de la Torre-Ubieta L, Won H, Stein JL, Geschwind DH. Advancing the understanding of autism disease mechanisms through genetics. Nat Med. 2016;22:345–61. doi: 10.1038/nm.4071. - DOI - PMC - PubMed
    1. Chaste P, Leboyer M. Autism risk factors: genes, environment, and gene-environment interactions. Dialogues Clin Neurosci. 2012;14:281–92. doi: 10.31887/DCNS.2012.14.3/pchaste. - DOI - PMC - PubMed
    1. Constantino JN, Todd RD. Autistic traits in the general population: a twin study. Arch Gen Psychiatry. 2003;60:524–30. doi: 10.1001/archpsyc.60.5.524. - DOI - PubMed
    1. Ronald A, Happe F, Price TS, Baron-Cohen S, Plomin R. Phenotypic and genetic overlap between autistic traits at the extremes of the general population. J Am Acad Child Adolesc Psychiatry. 2006;45:1206–14. doi: 10.1097/01.chi.0000230165.54117.41. - DOI - PubMed
    1. Betancur C, Sakurai T, Buxbaum JD. The emerging role of synaptic cell-adhesion pathways in the pathogenesis of autism spectrum disorders. Trends Neurosci. 2009;32:402–12. doi: 10.1016/j.tins.2009.04.003. - DOI - PMC - PubMed

Publication types